A modern organization protects its information systems with a whole suite of technologies that generate thousands of security alerts every day. Looking at these alerts in bulk, you’ll see that a significant share are false positives. Ideally, these alerts would be filtered out automatically so that analysts could focus on the ones that may point to a real incident. However, writing filters is a time-consuming task in itself. To create a correct filter, an analyst needs to:
Review the logs
Ident
A modern organization protects its information systems with a whole suite of technologies that generate thousands of security alerts every day. Looking at these alerts in bulk, you’ll see that a significant share are false positives. Ideally, these alerts would be filtered out automatically so that analysts could focus on the ones that may point to a real incident. However, writing filters is a time-consuming task in itself. To create a correct filter, an analyst needs to:
Review the logs
Identify the source of the activity
Define filtering boundaries
Choose filtering criteria
Write a rule
Check that the filter is robust
This post looks at how filter creation itself can be automated to reduce analyst workload.
Filter validity criteria
In the context of security alerts, a filter is a combination of event field values that marks a detection as a false positive and not worth the analyst’s attention. Filters can be generated for any combination of event fields, but not every combination yields a valid filter. That’s why we need to define validity criteria: conditions showing that a specific filter actually removes noise and doesn’t suppress useful alerts.
Detection rules in security systems typically contain a set of conditions, and each of them can generate an alert. A specific event triggers a given fragment of a detection rule. The set of events that a given fragment responds to is what we’ll call its context. A good filter should cover the entire context where possible, without going beyond it. Filters that are too broad or too narrow are useless. For example, a filter based solely on PowerShell would exclude too many events, including some that deserve the analyst’s attention. Most of the filtered events would also be unrelated to the rule in question. A filter on a specific ID, on the other hand, would cover only one event, which may never recur.
Problems in filter generation
We can run into a number of problems when creating filters. First, events often contain an excessive number of fields (around 400 on average), and most of them aren’t needed for filtering. At the same time, generating and ranking combinations of these fields is also fairly resource-intensive. So, the first step is to discard the irrelevant fields and keep only those worth using in the filter. For example, out of 400 fields in an event, four may be enough for filtering.
Another problem is string normalization. Field values (for example, the path to the same application on different systems) can vary depending on system settings, user folder names, and so on. For a filter to account for all these variations, the strings must be normalized. For file paths, in particular, you can replace the drive letter and user folders with standard environment variables and convert all paths to a single case.
Finally, if a filter completely mirrors the query of a detection rule, it effectively disables that rule. To fix this, remove the event fields used in the detection rule from the filter. For example, if a rule triggers on a file path, there are two ways to filter out unwanted alerts:
In the filter, use fields other than the file path.
Use a part of the file path that the rule doesn’t use. For example, for the rule file_path: ".../something.exe", you can set up a filter that excludes events with the user/unique_files/ directory in the file path.
Filtering security alerts with an algorithm
Given the problems described above, automatically generating filters for security alerts should consist of the following steps:
An analyst receives a security alert that they assess as a false positive and uses the filter generator.
The generator takes the 400-field event from the alert, along with the rule that triggered on it, and determines the context.
The generator selects the fields that are relevant to the filter.
The generator normalizes the strings.
The generator builds different combinations of the selected fields. To do this, we applied the FP-Growth (frequent pattern growth) algorithm to the context determined earlier. FP Growth builds a tree of frequently occurring items (fields) from a dataset (in our case, the context) and discards items that aren’t frequent enough. This reduces the number of combinations to check, which lowers the cost of finding the most relevant ones.
The generator ranks the resulting combinations and offers the analyst the top three to choose from.
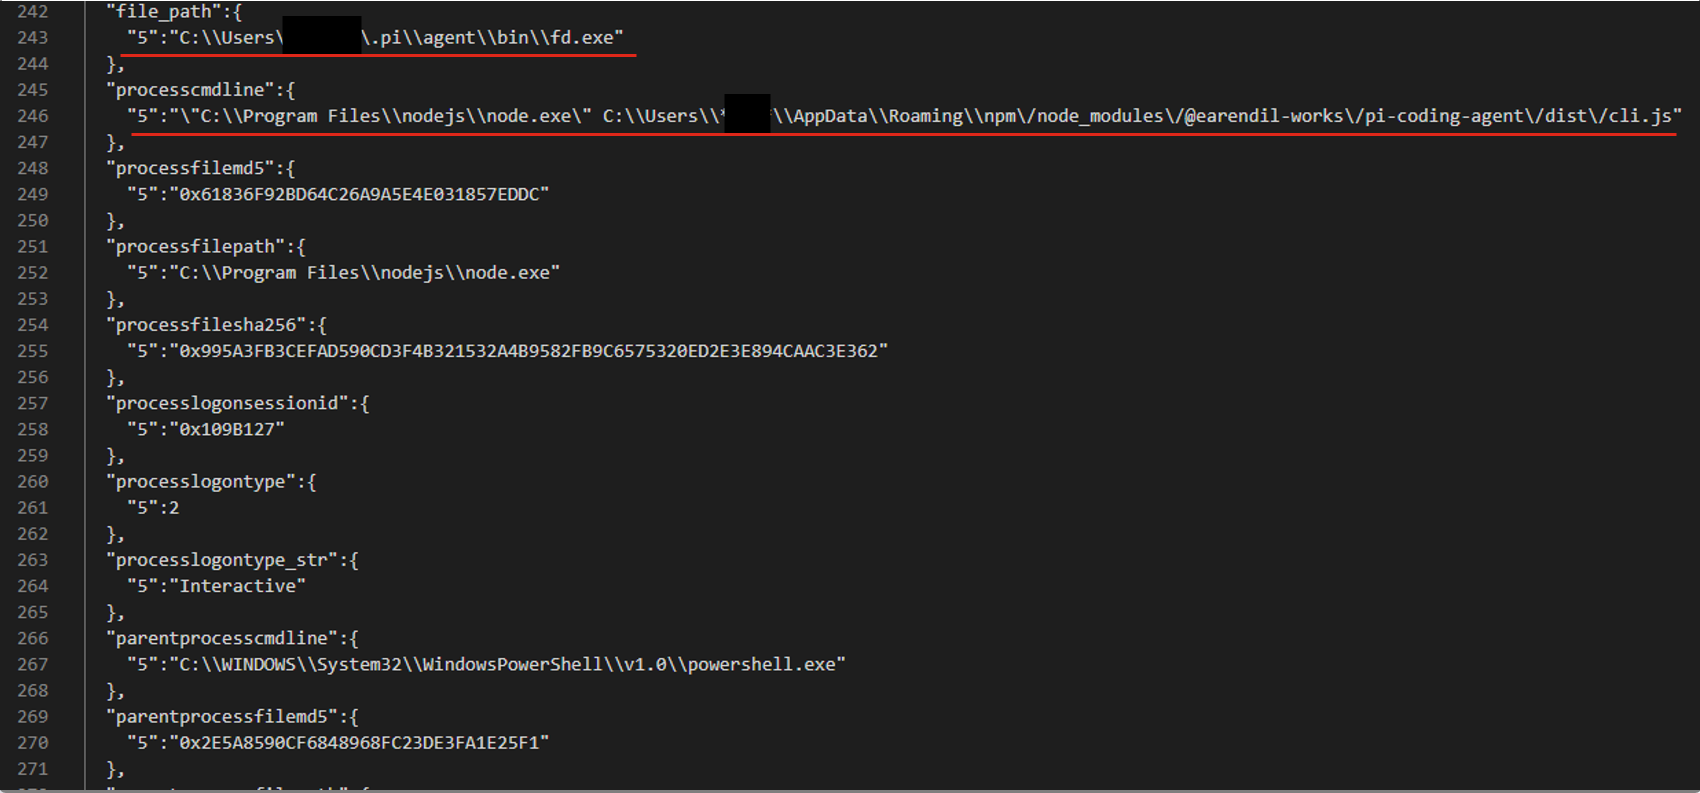
For example, consider an event described by the following JSON:
After generating and ranking the combinations, we got three filters based on file paths:
processcmdline:("nodejs\\node.exe" AND "*****\\appdata\\roaming\\npm\/node_modules\/pi-coding-agent\/dist\/cli.js")
file_path:"*****/.pi\\agent\\bin\\fd.exe"
processcmdline: "programfiles\\nodejs\\node.exe"
The last filter turned out to be too broad, but the analyst marked the other two as valid.
Pros and cons of the algorithmic approach
The algorithmic approach to filter generation has several advantages. First, it’s simple and deterministic: the same alert always produces the same result. Second, it’s interpretable, meaning we can see why a given combination ranked near the top of the list and why a particular field didn’t make it into the list of candidate fields at all. Third, the stages of the process are independent of each other, so individual steps can be improved and tuned without the risk of breaking the algorithm elsewhere. Finally, it has no external dependencies or models, which makes it easy to deploy in any customer environment.
However, it also has drawbacks. The first is its dependence on context. If there’s no context for some reason — for example, the rule’s first-ever trigger — a filter can’t be created. The second problem is string normalization. There’s a high chance of running into atypical cases that the normalization rules don’t cover. Often such cases can’t be described correctly at all, because they contradict each other.
These problems can be solved with large language models (LLMs). When an LLM generates the filters, no context is needed, because the LLM doesn’t iterate over or rank combinations. The LLM also takes a more flexible approach to string normalization, including non-standard cases. That said, an LLM doesn’t have to be involved at every stage of the generation process. We decided to keep the algorithmic solution where it works well. For example, a simple algorithm selects suitable fields without errors, so we didn’t move this stage to the model.
Filter generation with an LLM
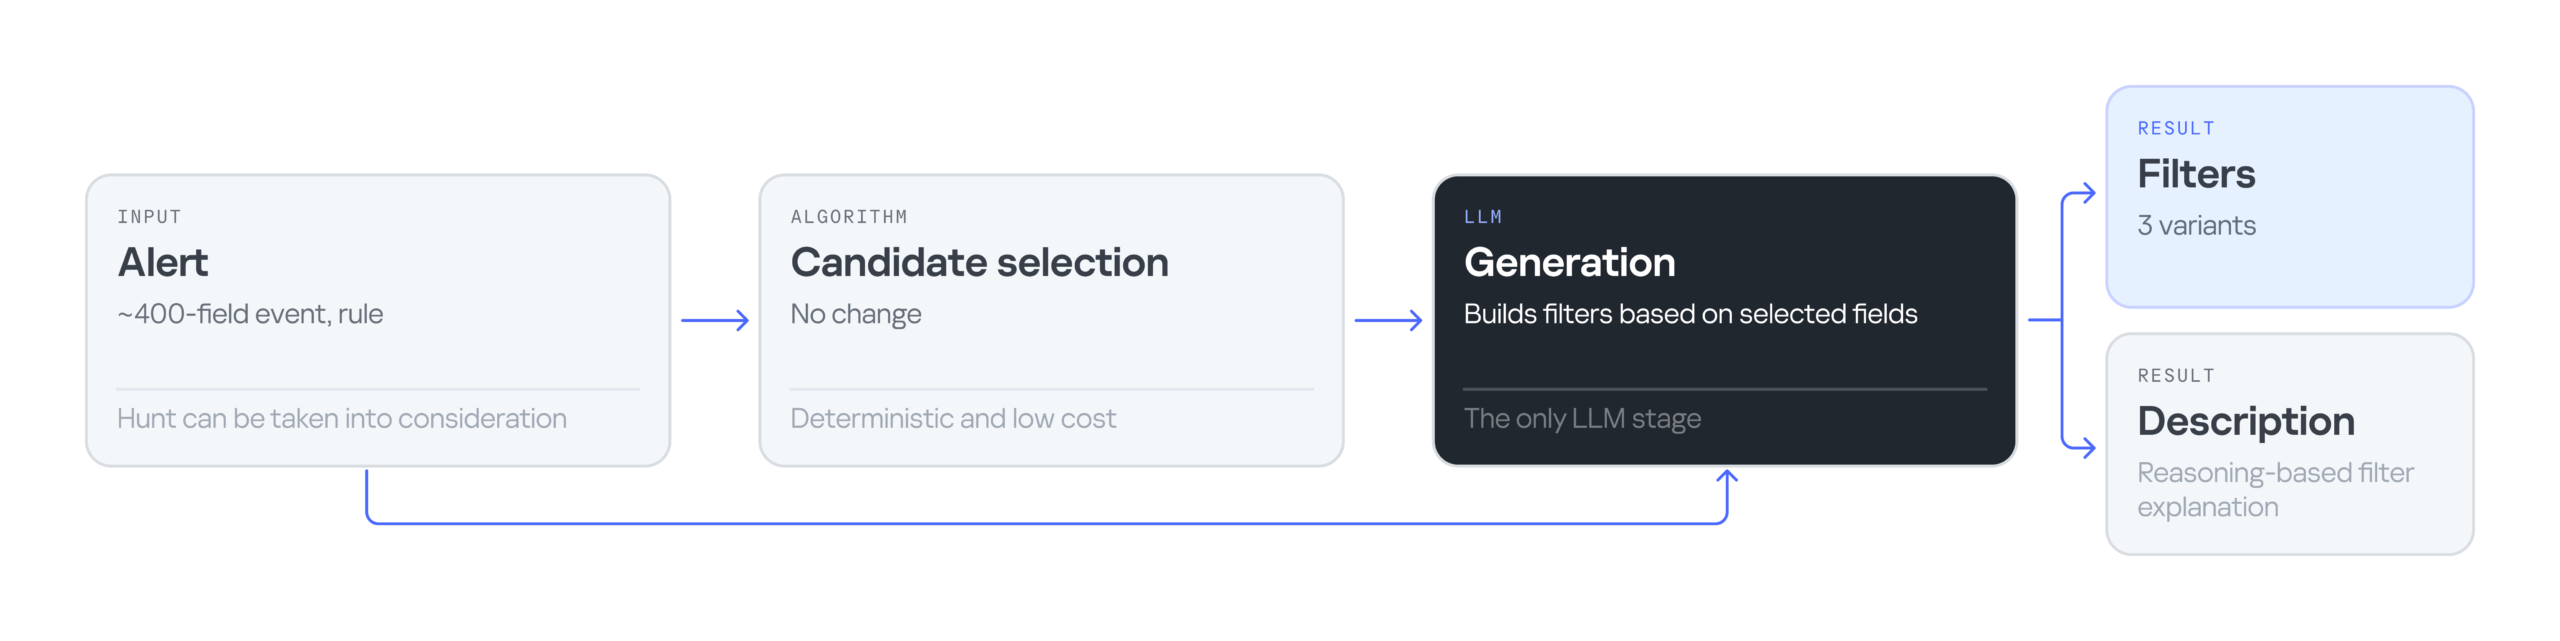
The LLM-based filter generation looks like this:
The input is still an alert containing an event with 400 fields, plus the rule that triggered on that event. Then an algorithm selects the most suitable fields for the filter. Next, the LLM processes the input — the event, the selected fields, and the detection rule — and generates three filter options along with an explanation for them. The explanation helps the analyst understand why these particular filters were suggested and make an informed choice.
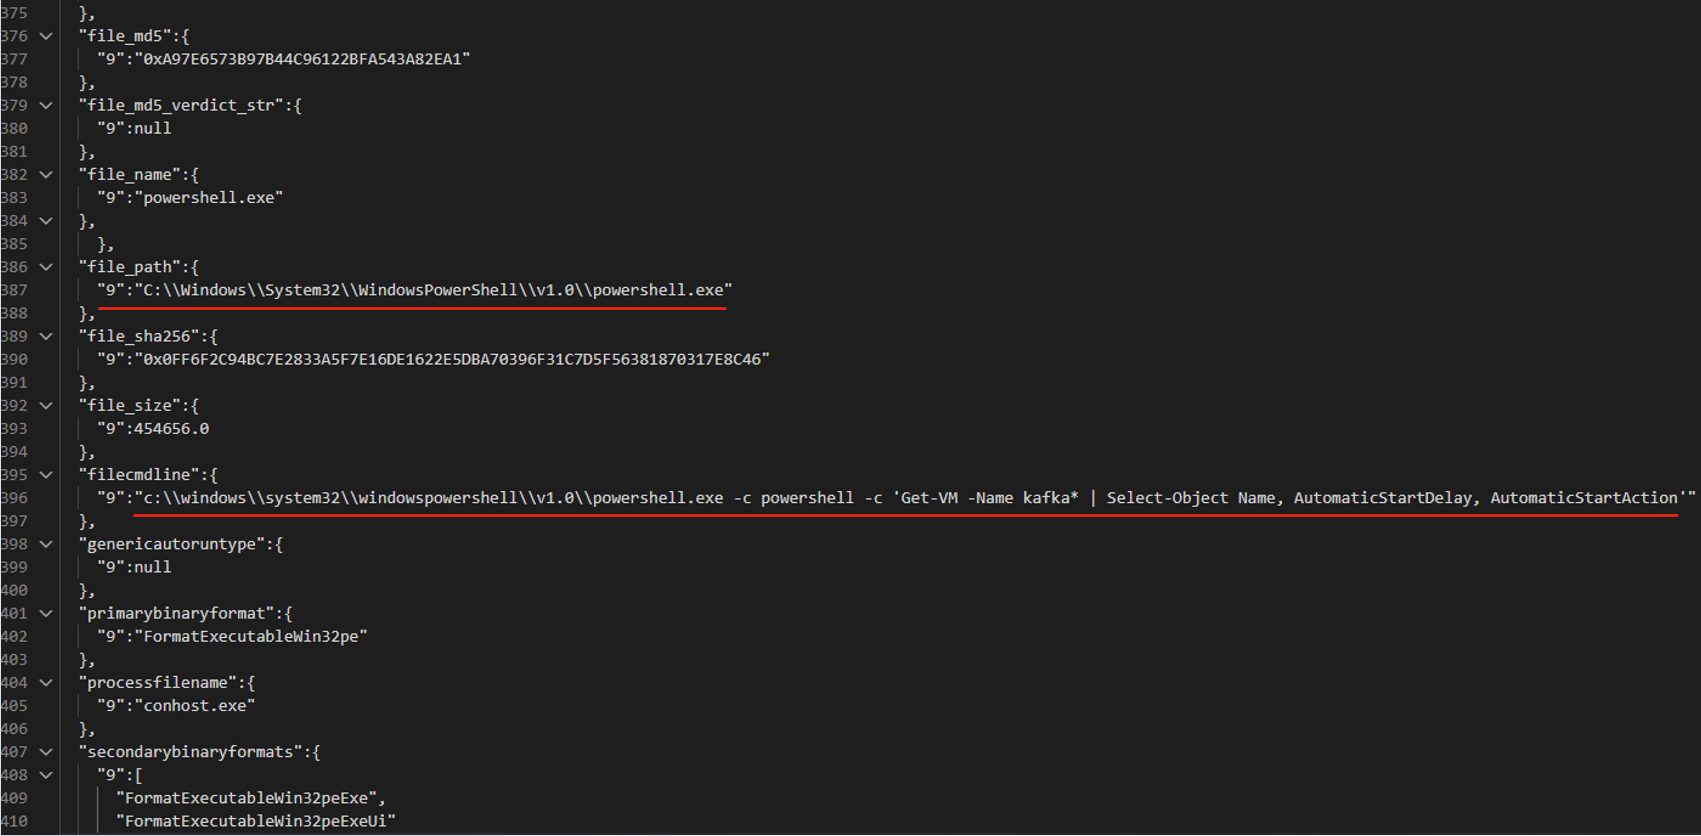
Consider the following event in JSON format:
The LLM suggested three filter options that all contain the same command line fragment:
file_path: "\\WindowsPowerShell\\powershell.exe" AND filecmdline: "Get-VM -Name kafka\*"
filecmdline: "Get-VM -Name kafka\*"
filecmdline: "kafka*"
As in the previous example, two of the three output filters were valid. The last one was too broad to be usable. The analyst chose the first filter with minor edits:
file_path: "powershell.exe" AND filecmdline: "Get-VM -Name kafka\*"
Pros and cons of generating filters with an LLM
Using an LLM solved the problems of purely algorithmic filter generation: dependence on context and errors in string normalization. However, the single-request approach had its own drawbacks. First, it had no output validation. The LLM returned filters as-is, with no syntax check and no way to correct errors. Second, unlike in the algorithmic version, all filter generation tasks were handled by a single system prompt. As a result, a minor fix in one place could break the logic in another.
Using multiple AI agents
To address the problems of generating filters with a single model and a single system prompt, we tried distributing the tasks across different LLM agents. In this version, we brought in agents as early as the stage of selecting relevant fields. The chain includes four agents in total:
Selector: selects the relevant fields.
Generator: generates filters.
Validator: evaluates the generated filters. If the filters are found to be invalid, it returns the task to the generator. If the selected fields are found to be irrelevant, it starts a new field selection cycle. If the filters pass validation, or the limit on regeneration attempts is reached, the valid filters (or the best ones available) are passed to the analyst.
Commentator: analyzes the output filters and explains which field values were used and why.
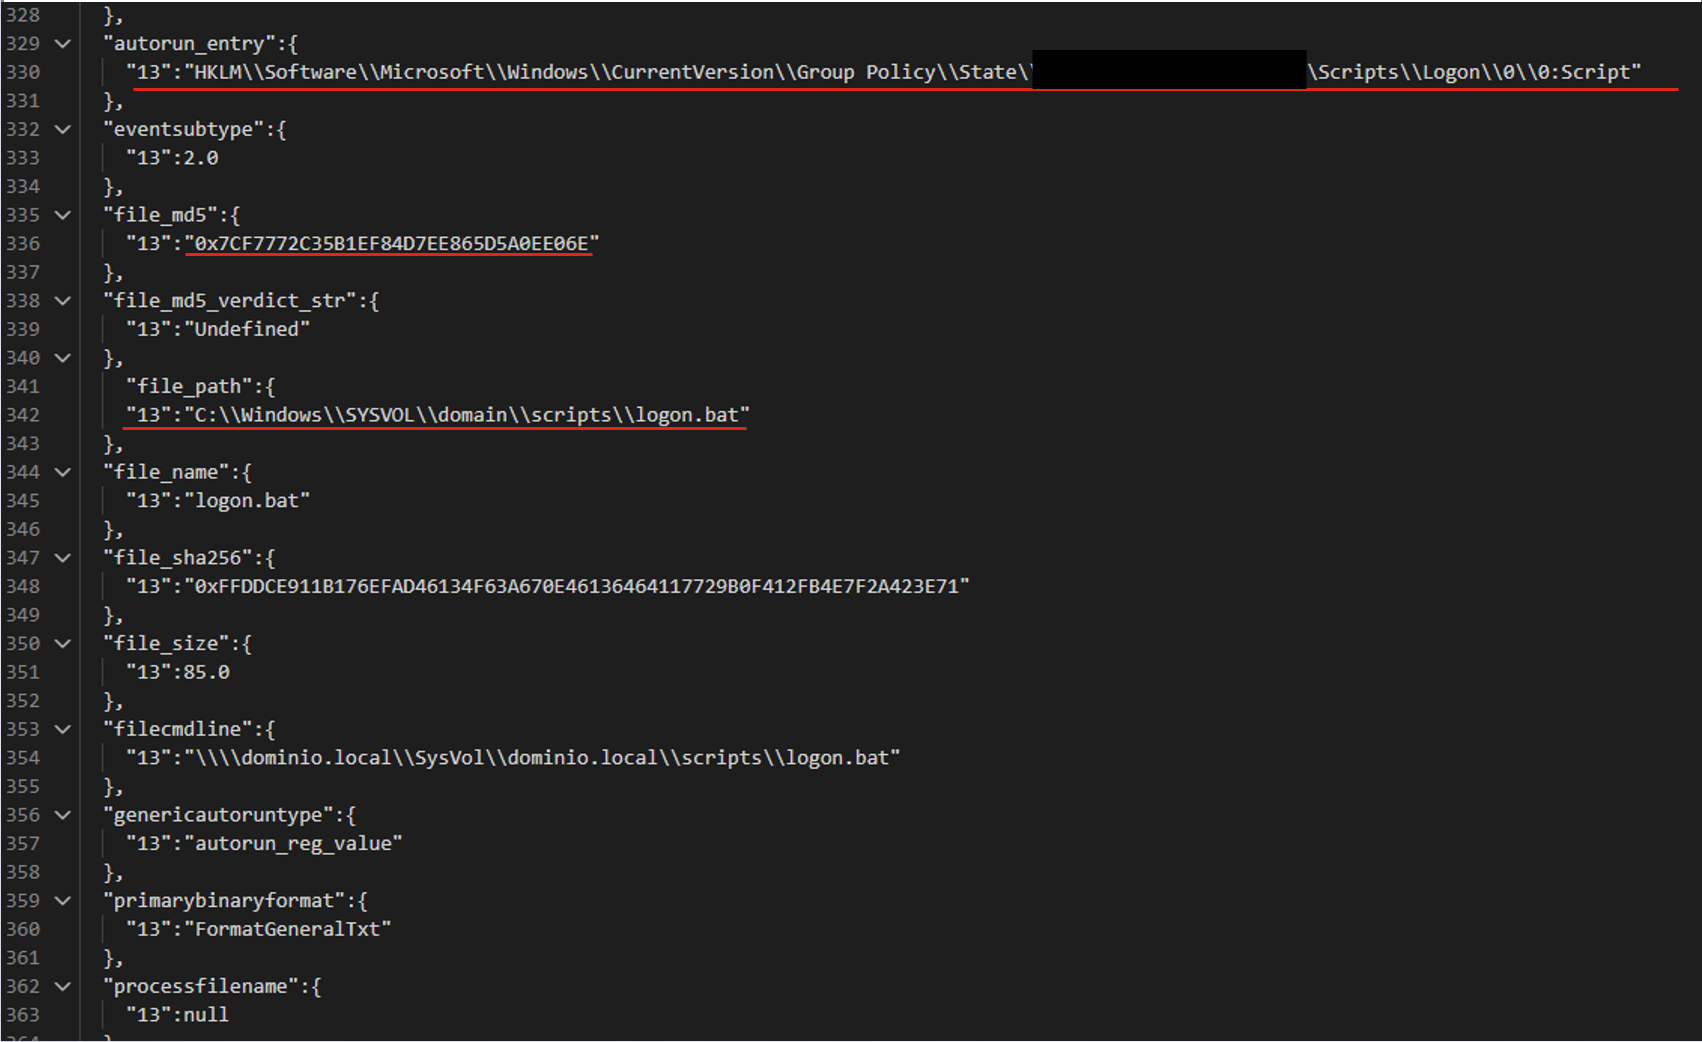
For the following JSON event, the agents produce three valid filters based on the file path.
The filters differ in the additional parameters that support the detection:
file_path:"sysvol\\domain\\scripts\\logon.bat"
file_path:"sysvol\\domain\\scripts\\logon.bat" AND file_md5:"0x7..6E"
autorun_entry: "Group Policy\\State" AND file_path: "SYSVOL\\domain\\scripts\\logon.bat"
Pros and cons of the agent-based approach
LLM agents give us a system that can validate and correct filters. Its modular architecture also lets us tune and improve different stages of generation independently. However, this approach makes more LLM calls than the previous ones, so the system is slower. It also depends on access to a model, which may not be available in the organization’s isolated environment.
Evaluating the filter generation system
To evaluate how well the filter generation system works, we use two main metrics:
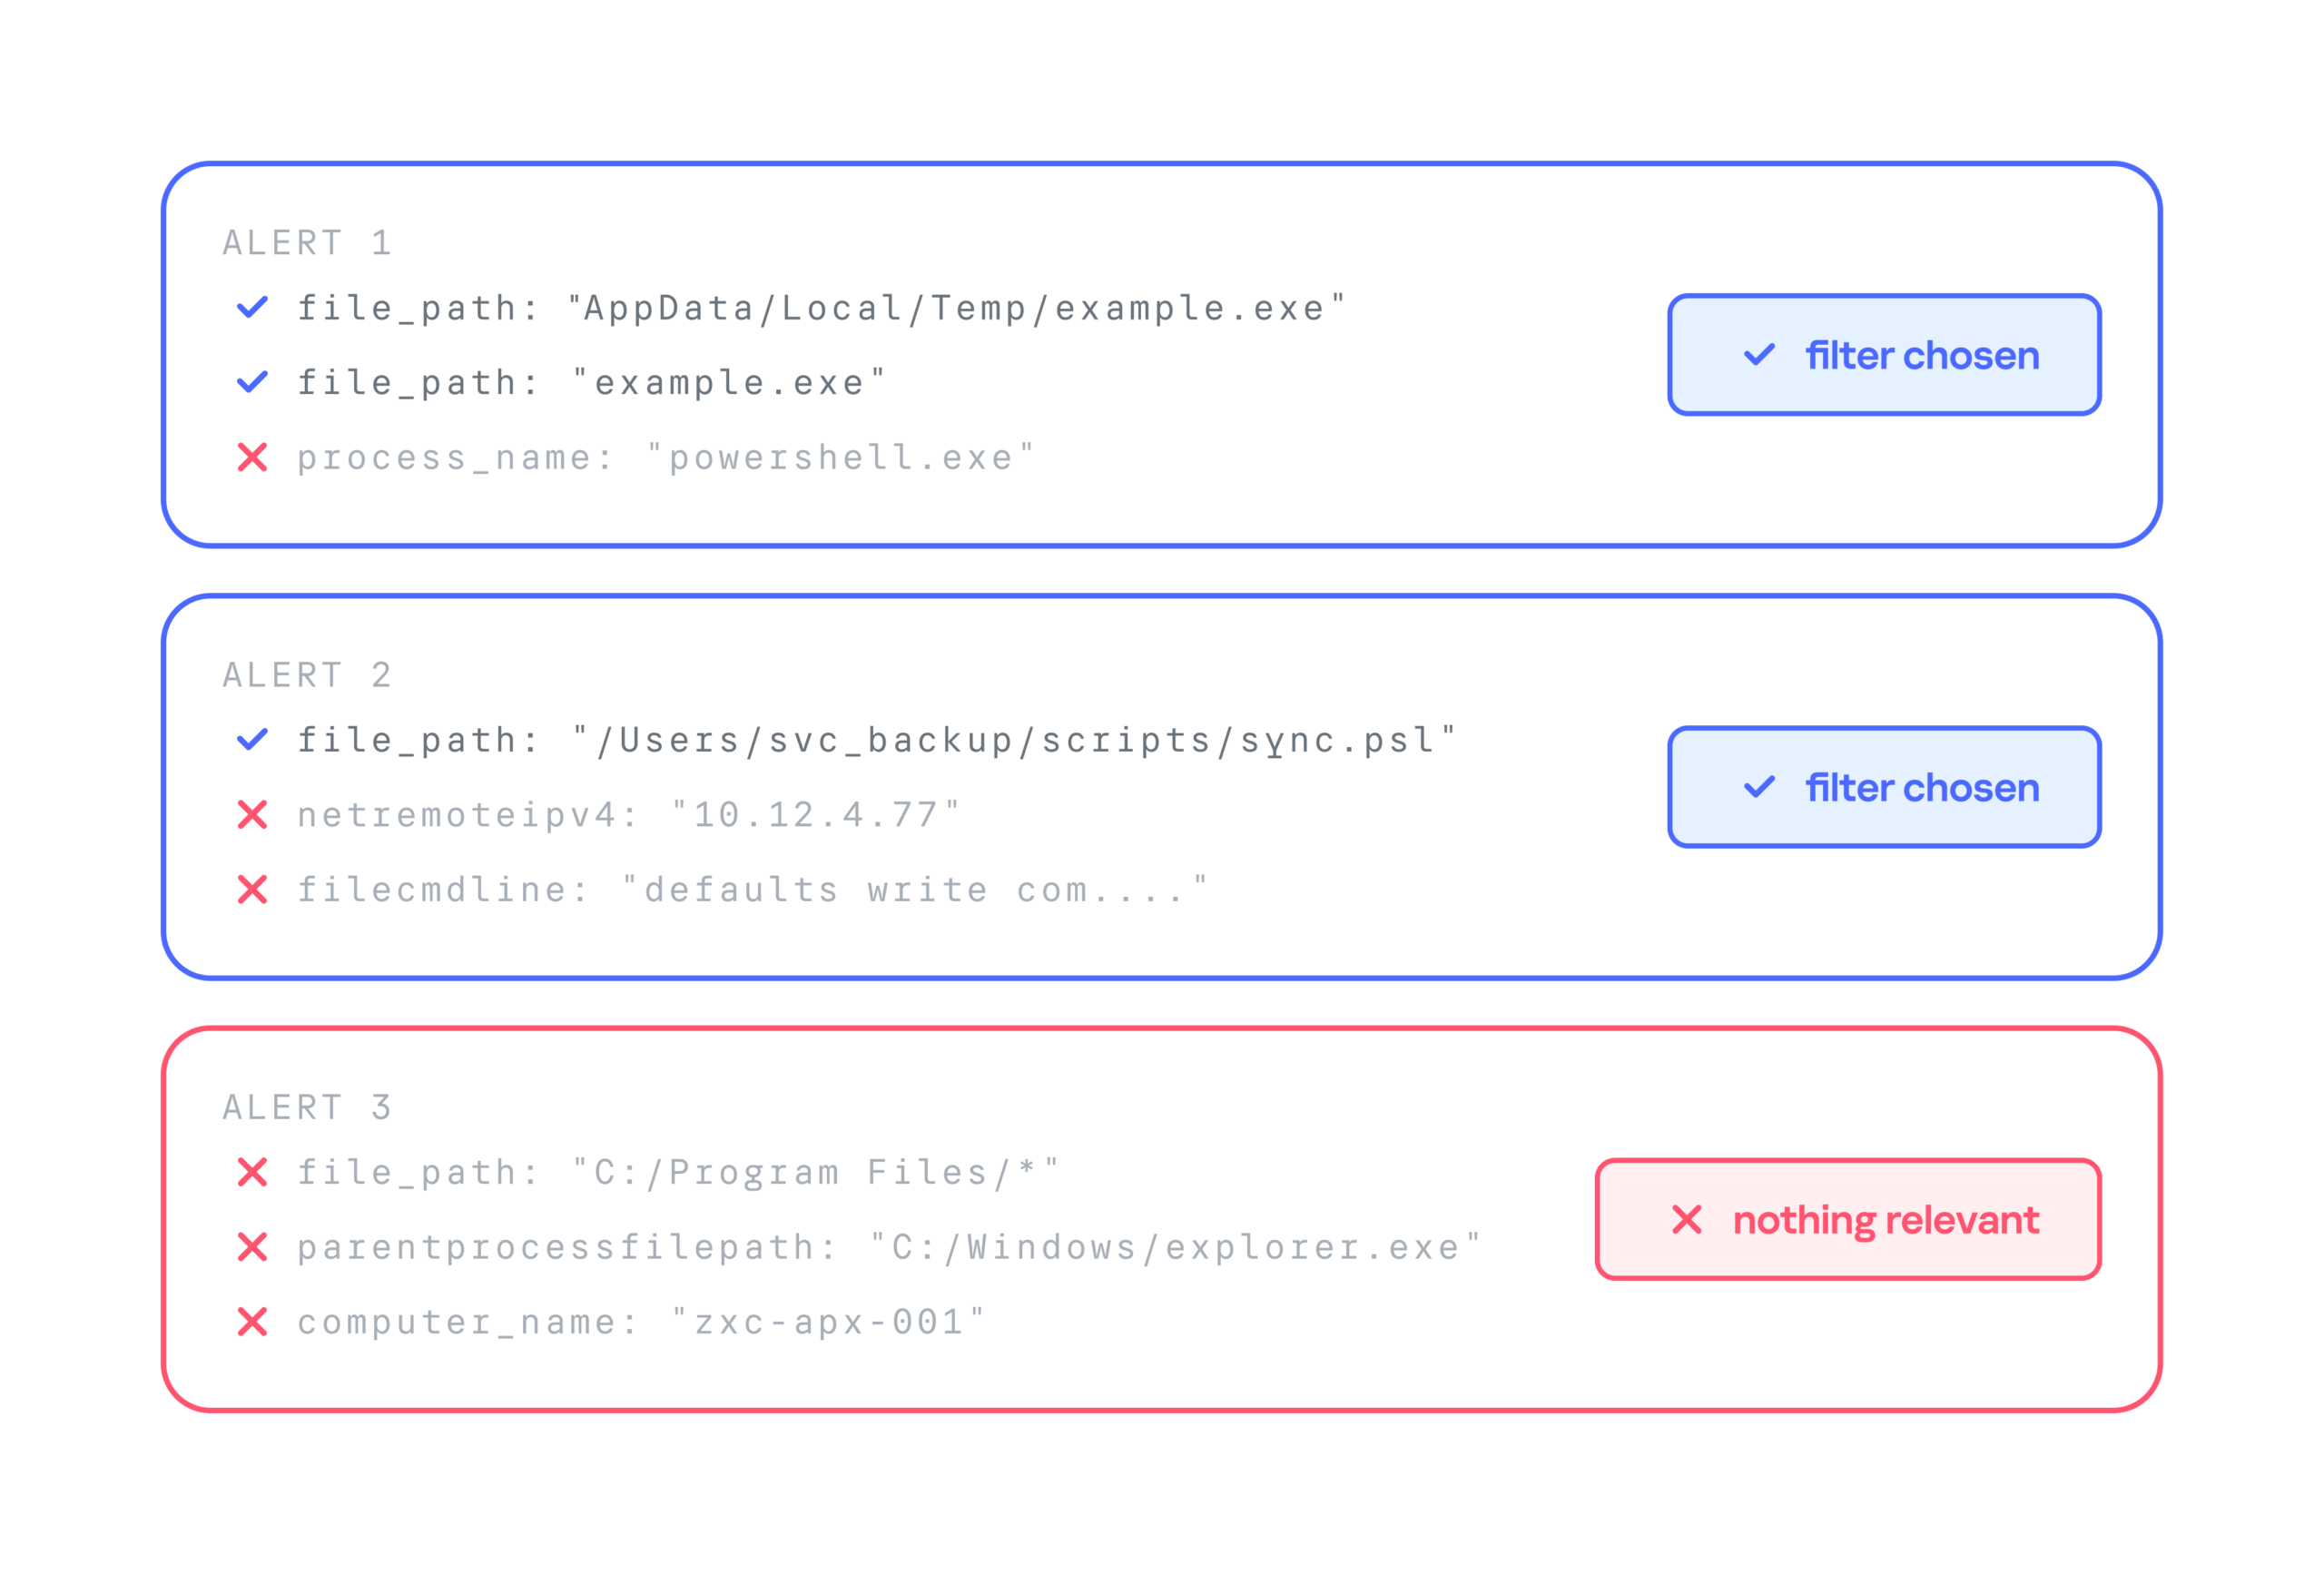
Approval rate. For each security alert, the system suggests three filters. If the analyst selects at least one of them, we count the generation as successful. For example, in the case below, the approval rate is 2/3.
False positive reduction rate (FP drop). This metric shows how much a filter helps reduce the number of false positives. It can only be measured over time, because we need to compare the number of false positive alerts received during a set period before and after the filter is deployed.
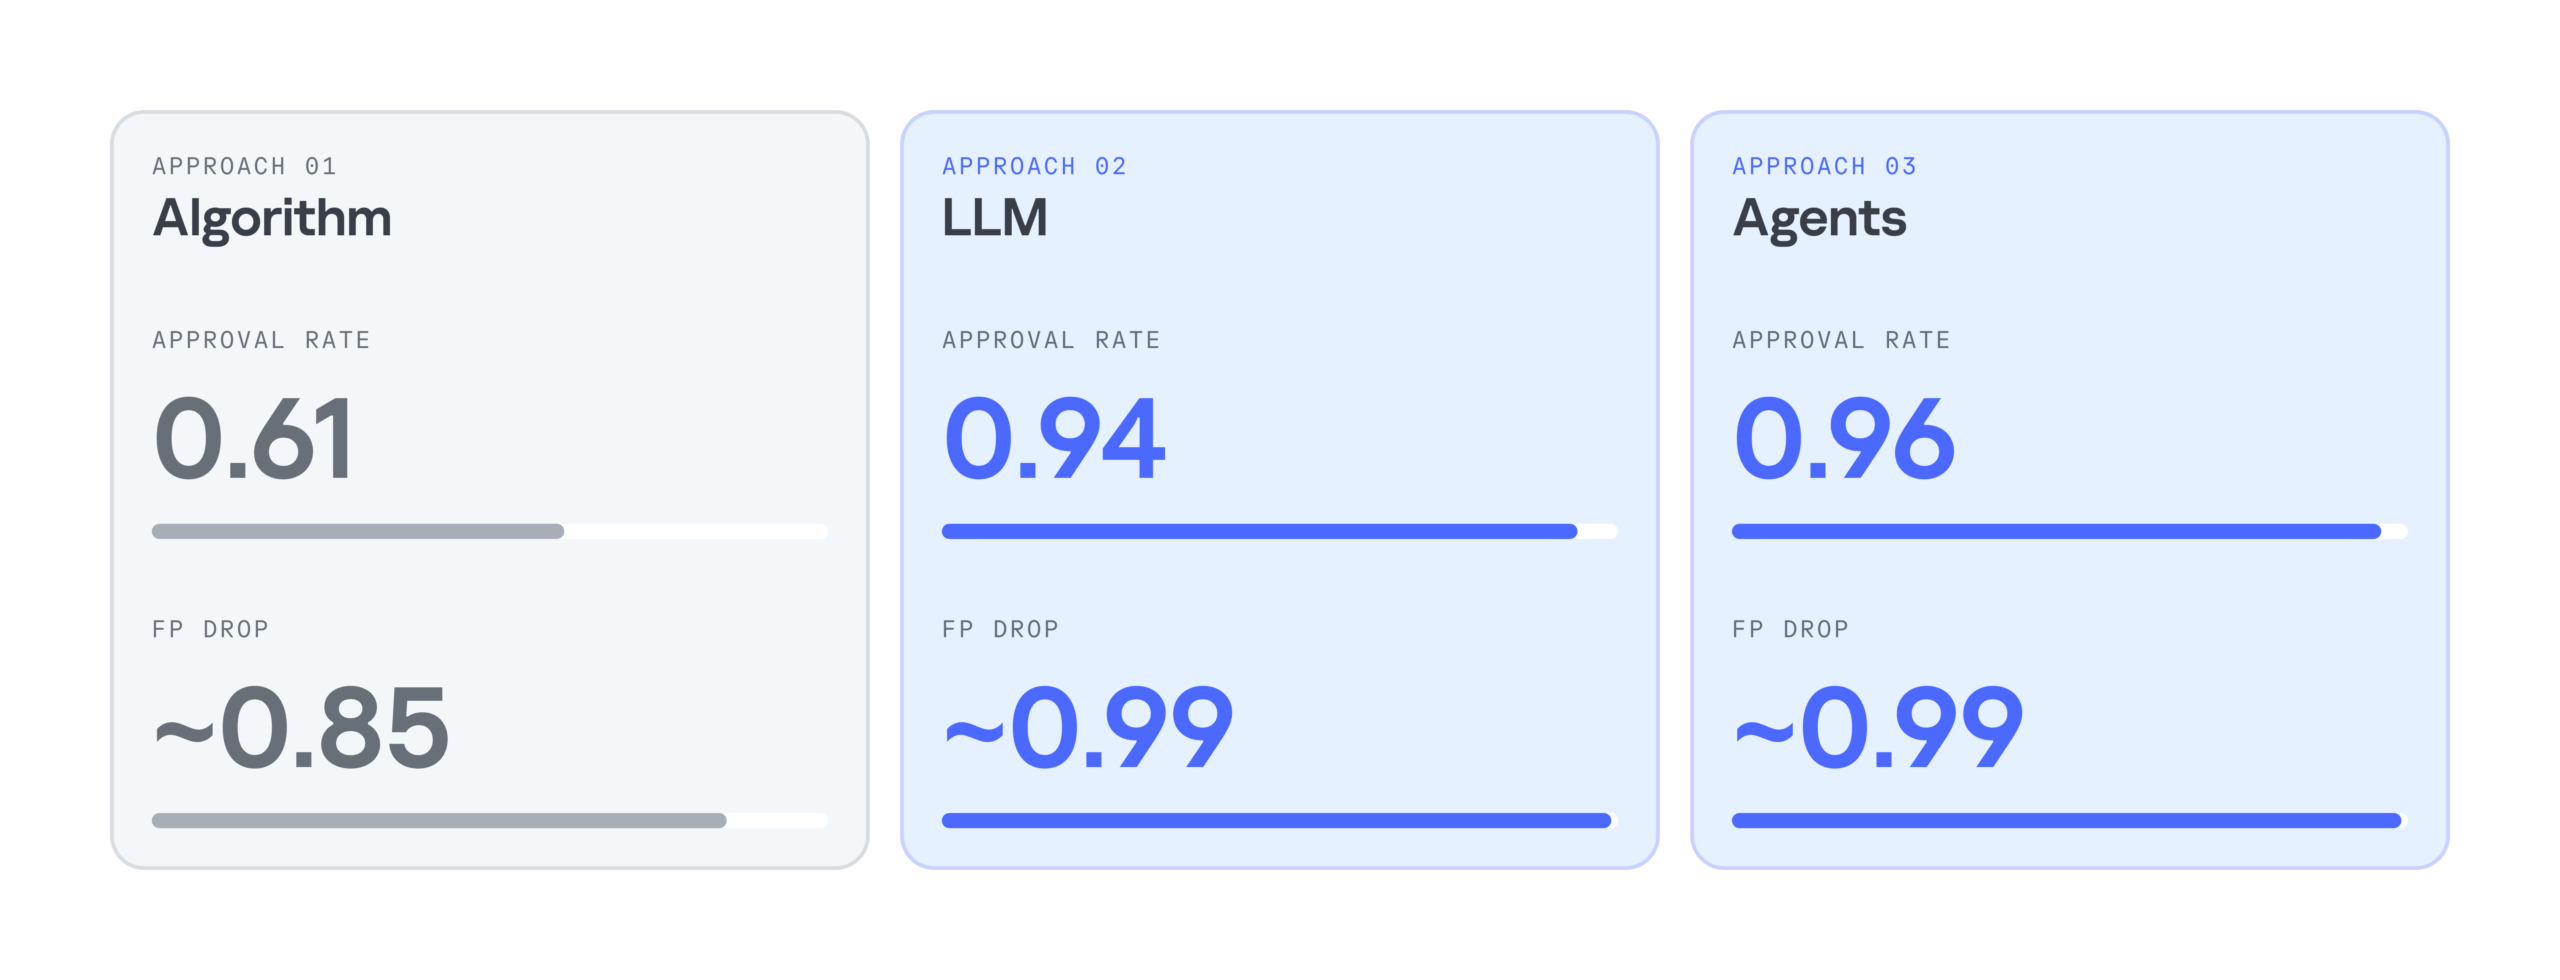
Below is a comparison of the three filter generation approaches by these metrics:
As the results show, LLMs significantly improve the efficiency of filter generation. At the same time, the LLM agentless and agent-based approaches perform almost identically. So we chose the simpler and faster option: an LLM with a single system prompt. As a result, we cut false positives by 99%, increased the number of filters generated per day by 28%, and made analysts’ alert handling 17% more efficient.
Takeaways
Practice has shown that filter generation can be automated effectively. We’ve looked at several options for automatically generating filters for false-positive security alerts: a purely algorithmic approach, an LLM-based approach, and an approach built on a group of LLM agents. All of them can generate valid filters and make the analyst’s work much easier, but each has its own pros and cons.
The algorithmic approach scored lower on the evaluation metrics, but in two-thirds of cases, it still produces filters that satisfy the analyst. It works especially well when there’s already a set of similar events to filter out, meaning enough context has accumulated. The algorithmic generator can also be deployed in any environment. Both standalone LLM and multi-agent LLM approaches show high accuracy, and their results differ only slightly, so the slower agent-based approach looks excessive at this stage. If an LLM is available, the best option appears to be a single model that handles several stages of the generation cycle.
Introduction
Mexico is one of the host countries for the 2026 FIFA World Cup, with matches to be played in three major cities: Mexico City, Monterrey, and Guadalajara. These locations are expected to see a large influx of international visitors, increasing the potential security risks. Many of those risks arise from users connecting to public wireless networks.
To better understand the wireless environments that visitors may encounter, we at Kaspersky GReAT conducted a wardriving assessment in t
Mexico is one of the host countries for the 2026 FIFA World Cup, with matches to be played in three major cities: Mexico City, Monterrey, and Guadalajara. These locations are expected to see a large influx of international visitors, increasing the potential security risks. Many of those risks arise from users connecting to public wireless networks.
To better understand the wireless environments that visitors may encounter, we at Kaspersky GReAT conducted a wardriving assessment in the three host cities. The aim of the study was to analyze characteristics, deployment patterns, security configurations and potential exposure risks of public Wi-Fi infrastructure in urban wireless environments.
The information collected during the assessment was used exclusively for passive observation and infrastructure analysis. No attempts were made to authenticate, intercept communications, exploit systems or interact with the detected wireless networks beyond the publicly broadcast management information.
During processing of the collected data, one step involved filtering out networks belonging to cars or cell phones categorized as mobile hotspots because they do not represent networks that can be considered part of the assessment.
Research scope
The cities included in the study have high population density and extensive wireless infrastructure deployments. We chose areas with the most prominent wireless network activity and highly concentrated public access points. We carried out wardriving research in Monterrey back in 2008, but the city’s hotspot landscape has changed since then.
We chose the following analysis areas for each of the cities:
Mexico City: México City Stadium, Mexico City International Airport, Zócalo, Paseo de la Reforma, Colonia Roma, La Condesa, Polanco, and Coyoacán.
Guadalajara: Guadalajara Stadium, Guadalajara International Airport, the city center, Zapopan, Providencia, Avenida Chapultepec, Colonia Americana, Tlaquepaque, and the area around Andares.
Monterrey: Monterrey Stadium, Monterrey International Airport, Fundidora Park, Cintermex Monterrey, the downtown area, Barrio Antiguo, MacroPlaza, and the San Pedro financial district.
The wireless information was collected using passive wireless reconnaissance techniques. The collected information included:
SSID analysis and information exposure, including BSSID-derived SSIDs
Default router configurations and ISP deployments
Frequency and signal characteristics
Channel congestion and spectrum usage
Wireless security configurations, including:
Open and insecure wireless networks
WPS-enabled networks
Secure networks (WPA2/WPA3) with WPS enabled
We performed a wireless infrastructure analysis in Mexico City, Guadalajara, and Monterrey. We drove through the areas surrounding the World Cup stadiums, tourist zones, and other places where fan concentrations are likely to be largest. Our goal was to evaluate the security status, deployment characteristics and operational exposure of detected wireless networks.
In total, we recorded 84,588 signals with 69,473 unique Service Set Identifiers (SSIDs) in busy locations and World Cup zones across the three cities. Mexico City accounted for 61.4% of the signals, Guadalajara for 23.6%, and Monterrey for 14.8%. Approximately 82% of the signals had a single SSID (81.9%, 81.34%, and 84% respectively). Notably, they all operate under the IEEE 802.11 standard protocol.
Particular attention was given to identifying standard deployment patterns, legacy configurations, default vendor settings and information disclosure through publicly broadcast wireless identifiers.
The following sections present the results that were obtained by analyzing wireless infrastructure across the three locations.
Our findings
SSID analysis and information exposure
SSID analysis was conducted to evaluate naming conventions, deployment standardization and potential information exposure.
Only a few networks (0.0047%) have an invisible SSID, meaning the names of these networks are not broadcast. Some users prefer to hide the SSID for various reasons, such as the network’s purpose, the profile of its users, internal policies, etc. In contrast, the rest of the networks maintained active SSID broadcasting.
SSID structures may unintentionally disclose operational details about internet service providers (ISPs), device manufacturers, deployment practices, organizational ownership or user identity. The repeated presence of default SSID naming patterns across the analyzed locations indicates a significant degree of infrastructure homogeneity and reuse of default wireless configurations. It may also facilitate passive infrastructure profiling by revealing standard characteristics in use.
Approximately 34% of the detected networks retained the default SSID naming conventions provided by the manufacturer or ISP, while 66% used customized identifiers.
Distribution of SSID naming conventions (download)
Several recurring SSID naming conventions associated with ISP-provided deployments were identified in the three cities. The most frequently observed patterns include identifiers such as “Club_Totalplay_WiFi”, “izzi WiFi”, and “Megacable WiFi”, which suggests extensive standardization of wireless infrastructure deployment. Additionally, we observed distinctive location-specific SSIDs in each area of analysis, such as “XXXX-Internet para Todos-CDMX” or “RED JALISCO”.
Sequential SSID naming structures were also identified during the analysis. Patterns such as “INFINITUMXX” and “IZZI-XX” suggest automated ISP deployment and large-scale deployment strategies.
We identified 33 unique sequential naming structures among the 137 sequential SSIDs in total, representing approximately 0.16% of the detected wireless networks.
The following graph shows the top five sequential SSID patterns found in the largest number of networks:
Five most frequently observed sequential patterns (download)
Several customized SSIDs contained personal or organizational identifiers, including family names, professions, addresses or internal department references. Although personalized SSIDs may simplify local network identification for users, they may also expose sensitive information that could be useful for social engineering, physical targeting, or organizational profiling.
BSSID-derived SSID
During the analysis, multiple networks were identified that used the physical MAC address of a Wi-Fi access point (BSSID) as the visible SSID. This practice exposes hardware-level information that could facilitate vendor fingerprinting and targeted reconnaissance activities.
The organizationally unique identifier (OUI) contained in the first bytes of the BSSID identifies the equipment manufacturer. Threat actors can correlate exposed manufacturers with device-specific vulnerabilities.
Notably, we found that more than 30% of networks in all three cities reuse the MAC address as the SSID.
Default router configurations and ISP deployments
We performed wireless infrastructure profiling to identify the most common wireless equipment manufacturers and ISP deployments across the three locations.
Large-scale ISP deployments frequently use standardized wireless configurations and vendor-specific hardware platforms. Identifying dominant manufacturers and ISP naming conventions can provide insight into infrastructure and deployment practices facilitating the mapping of standardized attack surfaces.
The following figure shows the distribution of the most commonly used manufacturers.
Most frequently observed wireless equipment manufacturers (download)
The manufacturer analysis revealed a strong concentration of wireless infrastructure among a limited number of vendors. Across the three locations, Huawei Technologies, MediaTek-based devices, and other manufacturers’ equipment that is distributed through ISP channels represented a significant portion of the detected deployments. Mexico City had the most diverse infrastructure, while Monterrey and Guadalajara had a greater concentration of wireless equipment known as SOHO (small office/home office) or residential-grade hardware. The widespread presence of standard vendor platforms may facilitate infrastructure fingerprinting and large-scale targeting of known device-specific vulnerabilities.
Most frequently observed wireless equipment manufacturers across the three cities (download)
ISP deployments frequently exhibited standardized configuration patterns and recurring manufacturer identifiers. Our ISP deployment analysis revealed a high concentration of access points associated with major residential internet providers. Deployments associated with Infinitum, Totalplay and Izzi represented a substantial portion of the detected wireless infrastructure across all locations. These findings suggest a high degree of deployment standardization across networks associated with major residential internet providers. This observation was supported by the repeated presence of ISP-associated SSIDs such as “Infinitum”, “Totalplay”, and “Izzi”, combined with manufacturer identifiers frequently associated with consumer equipment, including Huawei, ZTE and other residential wireless equipment vendors.
It is important to note that, for this analysis, ISPs were primarily inferred from SSID naming conventions and manufacturer fingerprint data. A significant portion of the detected wireless networks fell into the “UNKNOWN/CUSTOM” category. This classification includes custom hotspots and networks whose naming conventions did not expose identifiable ISP-associated patterns. The findings suggest that many users and organizations (as we saw previously, approximately 66%) use custom network names, limiting direct provider attribution.
The following figure illustrates the distribution of ISP-associated wireless deployments in general.
To better understand this distribution, we took the most frequently observed ISPs by city.
Most frequently observed ISPs across the three cities (download)
Frequency and signal characteristics
We also analyzed wireless signal characteristics to evaluate coverage quality, signal strength, and frequency band utilization in the three cities. In dense urban environments, signal quality and frequency spectrum distribution can affect wireless reliability, client connectivity, roaming performance, and overall network efficiency.
Signal quality analysis revealed that a substantial portion of the detected access points operated under weak or very weak signal conditions. Monterrey had the highest percentage of very weak signals, with approximately 50% of detected deployments. Similar patterns were observed in Guadalajara and Mexico City, suggesting high-density wireless environments with overlapping coverage areas. Only a limited percentage of networks were classified within the very good or excellent signal categories across the three locations.
Signal stability analysis revealed that most detected wireless deployments exhibited stable beacon transmission behavior. More than 96% of the detected access points across all locations were classified as stable, while only a small percentage exhibited unstable or indeterminate signal behavior.
These findings imply that the majority of the wireless infrastructure observed during the assessment corresponded to permanently deployed access points rather than transient or intermittent wireless devices.
Frequency band analysis revealed the strong prevalence of 2.4 GHz wireless deployments across the three locations. More than 95% of the detected wireless networks operated within the 2.4 GHz spectrum, while only a small percentage of deployments were classified under the unknown or non-standard frequency categories. This uneven distribution reflects the continued prevalence of legacy-compatible wireless infrastructure and SOHO deployments.
These findings are consistent with dense urban wireless environments with large numbers of access points in restricted spectrum allocations.
Channel congestion and spectrum usage
Next, we analyzed wireless channel utilization to evaluate frequency spectrum congestion and channel allocation patterns across the three cities. Our analysis focused on the 2.4 GHz spectrum, where channel overlap and high access point density commonly produce interference and degraded wireless performance. In densely populated wireless environments, an excessive concentration of access points on a limited number of channels can lead to co-channel interference, packet collisions, reduced throughput, and degraded network stability.
Spectrum congestion analysis revealed that the 2.4 GHz band consistently experienced elevated congestion levels across the three cities. The detailed results showed a strong concentration of deployments on channels 11, 6 and 1, which are traditionally recommended as non-overlapping channels within the 2.4 GHz spectrum. Channel 11 was the most utilized channel, accounting for 25.2% of the detected access points, followed by channel 6 with 22.5% and channel 1 with 19.5%. This distribution indicates that most wireless deployments adhere to standard channel allocation practices for 2.4 GHz Wi-Fi environments.
The following figure illustrates the overall distribution of the most frequently utilized wireless channels.
To further assess wireless spectrum saturation, the detected access points were grouped according to channel congestion levels: VERY_HIGH, HIGH, UNKNOWN, MEDIUM, LOW and NONE.
Mexico City had the highest proportion of heavily congested wireless channels, with approximately 7% of detected access points operating under HIGH congestion conditions. Guadalajara followed with nearly 5% of deployments categorized as HIGH congestion, while Monterrey had the lowest percentage at approximately 3.29%.
These findings suggest that wireless spectrum saturation increases proportionally with urban infrastructure density and access point concentration. Despite the presence of congested deployments, most detected access points were categorized as LOW or MEDIUM congestion, suggesting severe spectrum saturation was localized rather than uniformly distributed.
A thorough analysis of individual channel utilization revealed that channels 11, 6 and 1 consistently experienced the highest congestion levels across the three cities, which correlates with our previous findings. These channels accounted for the majority of VERY_HIGH congestion classifications, particularly within the 2.4 GHz band.
In Mexico City, channel 11 alone accounted for more than 25% of detected deployments and consistently exhibited VERY_HIGH congestion levels.
This behavior reflects the limited availability of non-overlapping channels within the 2.4 GHz spectrum and the widespread reliance on default wireless configurations.
Overall, the channel utilization analysis showed that wireless deployments are concentrated heavily within the traditional, non-overlapping 2.4 GHz channels. While this strategy reduces adjacent-channel interference, excessive access point density on the same channels can still produce significant co-channel contention and poor wireless performance in high-density urban environments.
Wireless security configurations
The next thing we evaluated was the security posture of the detected wireless networks. We analyzed the wireless security configurations advertised by access points in each of the locations.
Overall security configuration distribution
The analysis revealed that WPA2 was the dominant wireless authentication mechanism across the three cities. Mexico City had the highest WPA2 adoption rate at 81.19%, followed by Monterrey at 79.19% and Guadalajara at 77.59%.
The study found that every 6th open access point (17%) was unsafe, namely 16.5% in Mexico City, 18.5% in Guadalajara, and 17.2% in Monterrey. Open wireless deployments were consistently present across all locations, ranging between 10% and 12% of detected access points. These findings show that despite the widespread deployment of modern wireless security standards, encryption adoption remains incomplete.
Distribution of wireless authentication mechanisms across the three locations (download)
To simplify the interpretation of wireless security posture, we grouped detected networks into four categories:
Secure (WPA2/WPA3)
Insecure (Open/WEP)
Weak (WPA)
Unknown
Across the three locations, secure networks comprised most of detected deployments, accounting for approximately 82% of all access points. However, insecure open networks still account for between 10% and 12% of detected wireless infrastructure, consistent with our previous findings. It is important to mention that networks within the unknown category are not considered secure.
Mexico City had the highest percentage of secure deployments at 83.54%, while Guadalajara had the highest percentage of insecure open networks at 12.46%. Although Monterrey had the lowest percentage of insecure networks, open deployments still accounted for more than 10% of the detected access points.
Wireless security posture grouping across the three locations (download)
Although modern WPA2/WPA3 encryption standards dominate current wireless deployments, the continued presence of open and legacy WPA deployments indicates that insecure wireless configurations remain relevant from an operational standpoint. These networks may expose users to passive traffic interception, unauthorized monitoring, rogue access point attacks, and credential harvesting techniques.
WPS-enabled networks
We also analyzed Wi-Fi Protected Setup (WPS) in all the locations to evaluate additional attack surfaces. WPS is a standard feature on wireless routers that enables devices such as printers, repeaters or mobile phones to connect to a secure Wi-Fi network without manually entering a long password, typically through a PIN-based enrolled mechanism. Although WPA2 and WPA3 provide strong encryption mechanisms, the presence of WPS can introduce security weaknesses due to inherently vulnerable PIN-based enrollment methods.
By combining detections from the three locations, we found that 55% of all detected access points did not advertise WPS capabilities, leaving 45% of deployments vulnerable to WPS-based abuse. These results suggest that, despite the adoption of modern encryption standards, a significant portion of wireless infrastructure continues to expose legacy convenience features.
During the analysis, we found that Mexico City had the highest proportion of WPS-enabled networks, with 46.61% of the detected access points advertising WPS capabilities. Guadalajara was second with 43.45%, while Monterrey had the lowest proportion at 40.93%.
The percentage of detected access points advertising WPS capabilities across the three locations (download)
Almost half of the detected wireless networks in each city continued to advertise WPS, indicating that WPS prevalence is consistently high across the three cities.
Secure networks with WPS enabled
In many cases, networks classified as secure because of WPA2/WPA3 encryption still had WPS functionality enabled, which effectively increased the available attack surface.
To further assess the relationship between encryption strength and WPS exposure, we conducted a secondary analysis of secure networks (WPA2/WPA3) only. The results showed that around half of all secure deployments still exposed WPS, with the following breakdown for each city:
Mexico City: 53.7%
Guadalajara: 50.9%
Monterrey: 47.5%
The proportion of secure networks with WPS enabled across the three locations (download)
These findings indicate that encryption strength alone is not enough to evaluate wireless security posture because additional protocol features, such as WPS, may still expose exploitable attack vectors.
Additional security considerations
Overall, travelers operating within dense public environments are exposed not only to insecure wireless infrastructure but also to various risks associated with digital interactions. These risks include many threats, from public USB charging systems and phishing QR codes to proximity-based protocols and exposure to shared public devices, such as interactive totems or kiosks. One particular point that should be taken into account in light of our research is the issue of rogue wireless deployments.
Rogue access points are not necessarily malicious; they may be set up accidentally by misconfiguring router settings. An entry point for potential compromise might be caused by various misconfigurations, from a weak password to an insecure protocol. However, attackers deploy such unauthorized hotspots with malicious intent to infiltrate a network. Threat actors may deploy rogue access points posing as legitimate public wireless networks in airports, hotels, cafés and tourist areas. These deployments are called “evil twins” and can trick users into connecting to attacker-controlled infrastructure capable of intercepting traffic, harvesting credentials, or performing man-in-the-middle attacks. Further risk lies in the potential compromise of local network devices or even malware distribution. Such threats complement our findings, underscoring the importance of implementing traffic encryption, using a security solution and exercising extreme caution while browsing via public networks.
Conclusion
The wardriving assessment conducted in Mexico City, Guadalajara, and Monterrey revealed that modern wireless infrastructure continues to present multiple forms of operational exposure despite the widespread adoption of WPA2 and WPA3 security standards. The analysis demonstrated that wireless environments are highly standardized in all the locations, with recurring ISP deployments, default SSID naming conventions, homogeneous manufacturer distribution, and predictable channel allocation practices observed in all three cities.
Although most of the detected networks were classified as secure under WPA2/WPA3 authentication mechanisms, a significant proportion were exposing additional attack surfaces through enabled WPS functionality, default configurations, sequential SSID structures, and infrastructure metadata disclosure. This demonstrates that encryption strength alone is insufficient for evaluating the overall security posture of wireless infrastructure. Additionally, the prevalence of open networks and legacy wireless configurations indicates that insecure deployments are still operationally relevant in all the locations.
The results also showed that wireless infrastructure is heavily concentrated within the 2.4 GHz spectrum, particularly around channels 11, 6, and 1. This leads to elevated congestion and increased co-channel interference in densely populated urban environments.
SSID analysis further revealed that publicly broadcast wireless identifiers frequently expose valuable operational information about ISPs, equipment manufacturers, deployment templates, organizational ownership, and user-defined naming practices. The identification of default ISP naming conventions, sequential SSID structures, and BSSID-derived SSIDs demonstrated that many deployments prioritize operational convenience and simplicity over exposure minimization and privacy.
The scope of the threats stemming from vulnerable wireless configurations poses serious digital exposure risks for users. The widespread presence of standard deployments, predictable SSID naming and publicly exposed infrastructure identifiers can facilitate passive reconnaissance, infrastructure fingerprinting and opportunistic targeting.
Recommendations
To minimize the risks of wireless-based exposure and the attack surface related to hotspot infrastructure, we recommend taking the following measures:
Disable WPS functionality on wireless routers whenever possible, particularly within WPA2/WPA3 deployments.
Avoid using default SSID naming conventions that disclose ISP providers, router manufacturers, or deployment templates.
Refrain from using personal, organizational, or location-based identifiers in wireless network names.
Avoid configuring SSID using BSSID or naming conventions derived from MAC addresses, as these may expose hardware fingerprinting information.
Promote migration toward modern WPA3-capable infrastructure while removing legacy wireless protocols when operationally feasible.
Reduce wireless congestion by optimizing channel allocation strategies and minimizing excessive dependence on the 2.4 GHz spectrum.
Encourage adoption of 5 GHz and newer wireless technologies to reduce interference and improve spectrum efficiency.
The findings presented in this assessment emphasize the importance of combining strong wireless encryption standards, secure deployment practices, exposure minimization strategies, and user awareness to enhance the overall security posture of wireless environments.
Introduction
ExifTool is a widely adopted utility for reading and writing metadata in image, PDF, audio, and video files. It is available both as a standalone command-line application and as a library that can be embedded in other software. In this article, we break down CVE-2026-3102, an ExifTool vulnerability discovered by Kaspersky’s Global Research and Analysis Team (GReAT) in February 2026 and patched by the developers within the same month. Affecting macOS systems with ExifTool version 13.
ExifTool is a widely adopted utility for reading and writing metadata in image, PDF, audio, and video files. It is available both as a standalone command-line application and as a library that can be embedded in other software. In this article, we break down CVE-2026-3102, an ExifTool vulnerability discovered by Kaspersky’s Global Research and Analysis Team (GReAT) in February 2026 and patched by the developers within the same month. Affecting macOS systems with ExifTool version 13.49 and earlier, this flaw could let an attacker run arbitrary commands by hiding instructions inside an image file’s metadata.
This investigation originated from revisiting an n-day vulnerability I first examined years ago: CVE-2021-22204. That flaw exploited weak regex-based sanitization before feeding user input into an eval sink. By auditing adjacent input validation routines across ExifTool codebase for similar oversights, I discovered CVE-2026-3102. Successful exploitation of CVE-2026-3102 enables an attacker to execute arbitrary shell commands with the privileges of the user invoking ExifTool, potentially leading to full system compromise.
Technical details
Disclaimer
Exploiting CVE-2026-3102 requires the -n (also known as -printConv) flag and outputs machine-readable data without additional processing.
Tracing the vulnerable sink
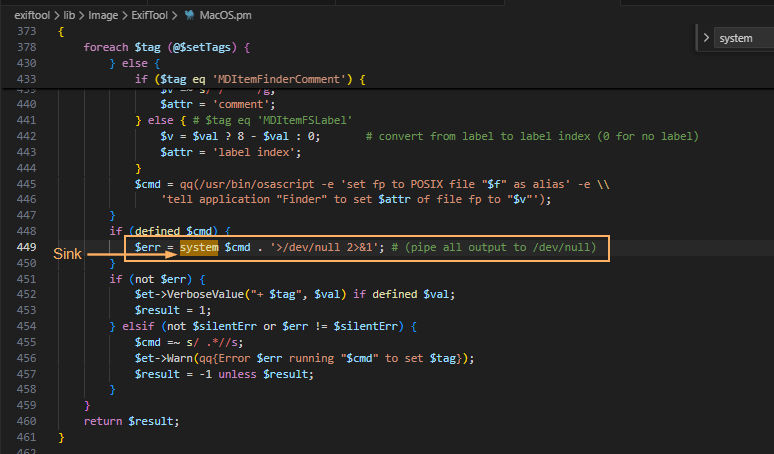
Taint analysis (aka tainted data analysis) allows for the detection of “dirty” data that reaches dangerous locations without validation. In this context, a “sink” is a point or function in a program where data or a parameter marked as “tainted” or originating from an untrusted source (e.g., user input) can affect the program’s behavior. In ExifTool, these functions are eval and system, both of which are capable of executing system commands. While CVE-2021-22204 exploited an eval function as a sink, this vulnerability (CVE-2026-3102) targets the system function. Knowing the vulnerable sink, we needed to trace how user-controlled data reaches it. Below, we break down the details.
Finding an unsanitized date value
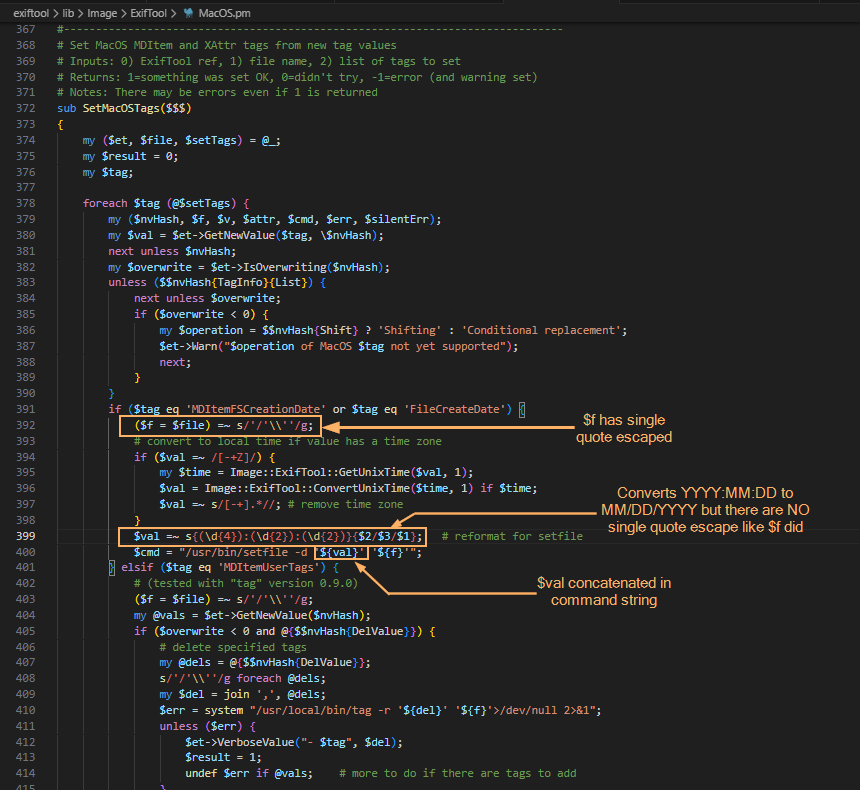
The screenshot above shows where the system() sink resides within the SetMacOSTags function. Tracing backward from system(), we identified the $cmd variable as the source of the executed command. This variable is assembled from three inputs: $file (properly sanitized), $setTags (processed iteratively), and $val (user-controlled and, crucially, left unsanitized in the vulnerable branch).
In ExifTool, a tag is a named metadata field. When parsing an image, the utility extracts date and time values from standard EXIF records or macOS filesystem attributes. To handle file creation dates on macOS, ExifTool relies on the Spotlight system attribute MDItemFSCreationDate. Within the program code, this attribute maps to the internal alias $FileCreateDate. These two identifiers govern how the file creation date is stored and applied.
This creates a critical link to the vulnerability: when parsing an image, ExifTool iterates through the discovered tags. The current tag’s name is assigned to the $tag variable, while its text content (e.g., a date string) is assigned to $val. The vulnerable code path is triggered only when $tag matches MDItemFSCreationDate or $FileCreateDate. At this point, the tag’s content flows into $val and is passed to the SetMacOSTags function. As shown in the screenshot below, the filename parameter is properly escaped, but the date value ($val) is not. Because the date is extracted directly from file metadata, an attacker can inject quotes into this field. This breaks the command structure and allows the payload to execute via the system() sink.
The following screenshots show some of the tags that can be modified. With the vulnerable parameter identified, the next challenge was delivery: how to place our payload into FileCreateDate without triggering early validation? We found the answer in the official documentation.
Planning the payload delivery
Let’s refer to the documentation to understand how ExifTool handles tag operations and identify a legitimate feature that can be repurposed for exploitation. Specifically, we need to find a way to deliver our payload into the vulnerable FileCreateDate parameter. When looking for macOS-related tags as well as FileCreateDate, we can find the following information:
To write or delete metadata, tag values are assigned using –TAG=[VALUE], and/or the -geotag, -csv= or -json=
To copy or move metadata, the -tagsFromFile feature is used.
To trigger the vulnerability, we need to copy a string (date format: MM/DD/YYYY) using the -tagsFromFile feature, as this operation invokes the SetMacOSTags function where the unsanitized $val parameter reaches the system() sink.
Why copy instead of writing directly? Because the vulnerable code path (SetMacOSTags) is only triggered when metadata is copied into FileCreateDate — not when it is written directly. By using -tagsFromFile, we can prepare a “source” tag (e.g., DateTimeOriginal) that accepts arbitrary values and copy that value into FileCreateDate, thereby invoking the vulnerable function with our controlled input.
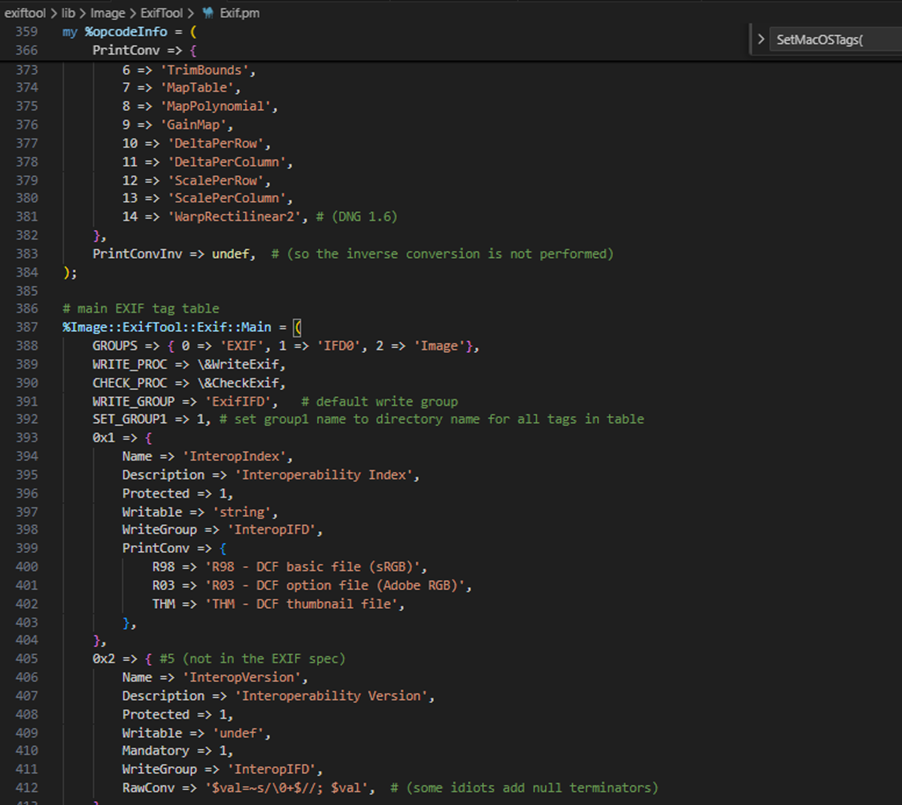
Furthermore, we want to introduce single quotes (since they are not being escaped in $val). For starters, we can look for date-time tag and copy via -tagsFromFile by searching the EXIF tag table. Direct assignment to FileCreateDate is heavily validated, so we looked for a source tag that accepts raw values and can be copied into the target field. The following snippet shows the beginning of said table.
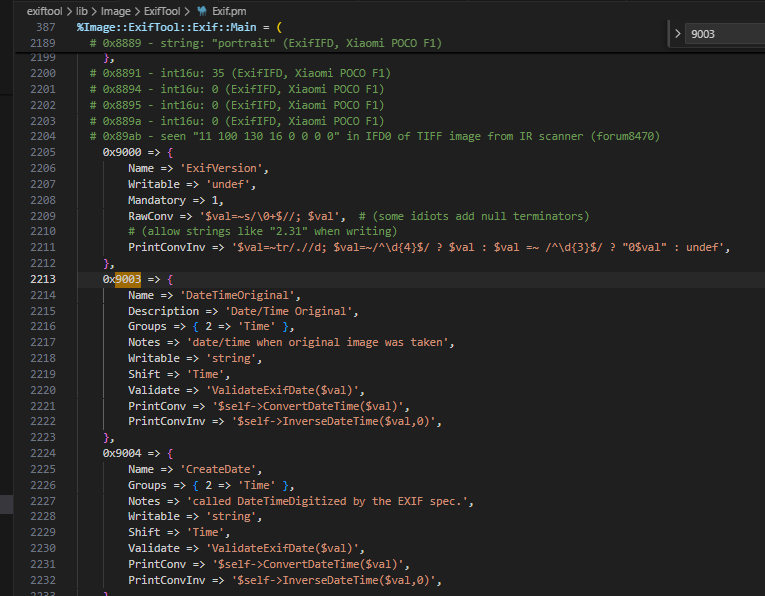
When doing the analysis, I made use of DateTimeOriginal though I believe you can also use CreateDate which is 0x9004 (see the following screenshot). Initial attempts to inject malformed dates failed: ExifTool’s built-in filter rejected the input. To bypass this, we examined how the tool handles raw metadata.
Bypassing the filter
To confirm that the PrintConvInv filter rejects invalid dates when written directly, I ran the following command, where evil_benign.jpg is a normal JPG with an invalid date time format. We are greeted with the error message: Invalid date/time. This requires the time as well. The next screenshot confirms that direct exploitation fails: ExifTool’s date validation detects the malformed input and rejects the change, activating the internal PrintConvInv filter.
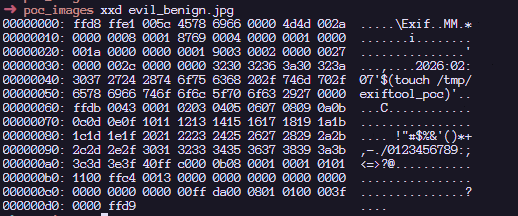
That said, it is possible to ignore the formatting and use the -n flag which accepts raw values instead of human-readable value. The -n flag skips the PrintConvInv conversion step, which is exactly where input sanitization occurs. This confirmed we could park unsanitized data in a source tag. The final step was to trigger the vulnerable code path by copying that data into FileCreateDate. This means we should now be able to modify the DateTimeOriginal tag with the invalid date time format with an -n flag. Examining the EXIF metadata tag, we can confirm that we can store a raw value without a proper human readable format that ExifTool accepts:
Triggering the exploit
To inject commands, we have to revisit the single quote injection into this datetime related tag.
The following screenshot shows that we have successfully set the datetime metadata with the single quote. With the payload safely stored in a source tag, the next step was to copy it into FileCreateDate, triggering the vulnerable system() call.
The next step now is to copy the datetime tag to a file which invokes SetMacOSTags. According to the documentation, this is how we can copy the data from the SRC tag to the FileCreateDate tag as seen in the SetMacOSTags with the -tagsFromFile feature.
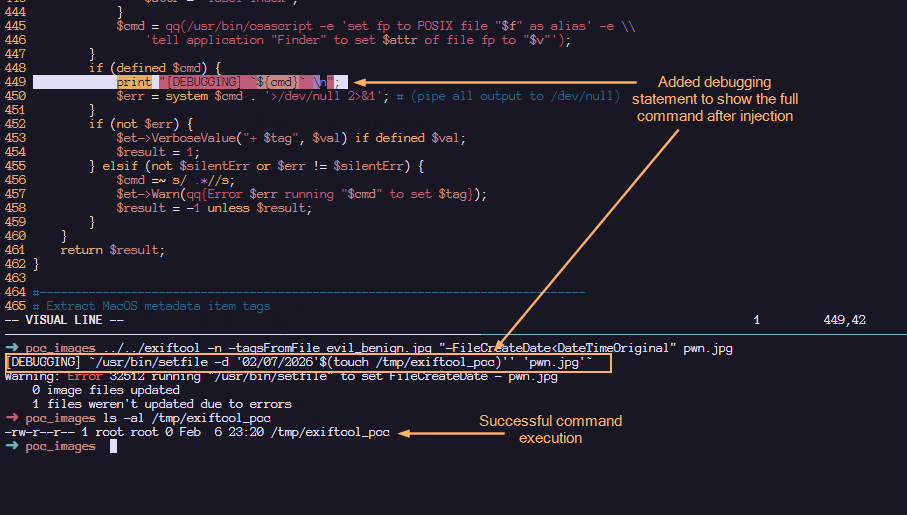
Here, we confirm that the payload has been executed! Note that when copying tags in MacOS (Darwin), the /usr/bin/setfile command is used. To view the full $cmd value before the injection, I have added the debugging statement to displaying the actual command that is executed within the system function.
Upon injection, we can see that our command gets executed via command substitution. The single quotes that we added helped to make the entire command syntactically valid. The following shows a more detailed labelling and their roles in making this command line injection successful:
Such an image can appear completely benign and easily find its way into a newsroom or any organization that processes photos on macOS using ExifTool. Once processed, an attacker could silently deploy a Trojan for covert data exfiltration, drop additional malware, or use the compromised machine as a foothold to expand the attack within the victim’s network.
Patch analysis
After verifying successful exploitation, we examined how the maintainer addressed the flaw in version 13.50. In the vulnerable version of ExifTool, commands were sanitized before being concatenated together. This means that it is possible to concatenate single quotes which led to the exploitation. However, by abstracting the system call into a dedicated wrapper and requiring a list of arguments instead of concatenated string, the fix removes the need for any manual escaping altogether.
1. Replacing string form to argument list form:
#### BEFORE
$cmd = "/usr/bin/setfile -d '${val}' '${f}'";
system $cmd;

#### AFTER
system('/usr/bin/setfile', '-d', $val, $file);
2. Create new System() wrapper. In version 13.49, the output is piped to /dev/null . To maintain that logic, the wrapper would temporarily redirect STDOUT/STDERR to /dev/null and restore them after the call.
# Call system command, redirecting all I/O to /dev/null
# Inputs: system arguments
# Returns: system return code
sub System
{
    open(my $oldout, ">&STDOUT");
    open(my $olderr, ">&STDERR");
    open(STDOUT, '>', '/dev/null');
    open(STDERR, '>', '/dev/null');
    my $result = system(@_);
    open(STDOUT, ">&", $oldout);
    open(STDERR, ">&", $olderr);
    return $result;
}
How to protect against ExifTool vulnerability
It’s critical to ensure that all photo processing workflows are using the updated version. You should verify that all asset management platforms, photo organization apps, and any bulk image processing scripts running on Macs are calling ExifTool version 13.50 or later, and don’t contain an embedded older copy of the ExifTool library.
ExifTool, like any software, may contain additional vulnerabilities of this class. To harden defenses, I recommend using Kaspersky Open Source Software Threats Data Feed for continuous monitoring of open-source components in your software supply chain, and Kaspersky for macOS as comprehensive endpoint protection. Additionally, isolate processing of untrusted files on dedicated machines or virtual environments with strictly limited network and storage access. If you work with freelancers, contractors, or allow BYOD, enforce a policy that only devices with an active macOS security solution can access your corporate network.
Conclusions
CVE-2026-3102 highlights the risks of inconsistent input sanitization in tools that bridge high-level metadata parsing with platform-specific utilities. While exploitation requires explicit flag usage (-n) and is restricted to macOS, the vulnerability underscores the danger of manual escaping routines in evolving codebases. The transition to list-form system execution provides a robust, architecture-level fix that eliminates shell interpretation risks entirely. This case reinforces a core security principle: replacing fragile string concatenation with secure, list-based API calls remains the most reliable mitigation against command injection.

 Entrar