
Visualização normal

Antes de ontemSecurelist
  • ✇Securelist
  • Threat landscape for industrial automation systems. Q2 2026 Kaspersky ICS CERT
    All threats In Q2 2026, the percentage of ICS computers on which malicious objects were blocked continued to decrease, falling to 19.15%, its lowest level since 2022. Percentage of ICS computers on which malicious objects were blocked, Q3 2023–Q2 2026 Regionally, the percentages ranged from 8.1% in Northern Europe to 27.9% in Africa. Regions ranked by percentage of attacked ICS computers The figures increased in five regions over the quarter, most notably in East Asia (by 2.0 pp) and Africa (by
     

Threat landscape for industrial automation systems. Q2 2026

27 de Agosto de 2026, 07:05

All threats

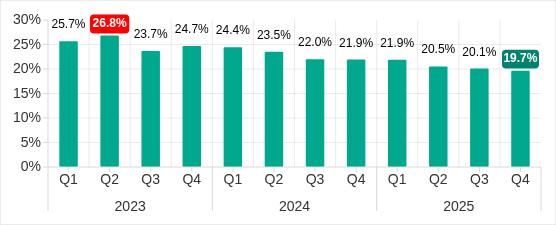
In Q2 2026, the percentage of ICS computers on which malicious objects were blocked continued to decrease, falling to 19.15%, its lowest level since 2022.
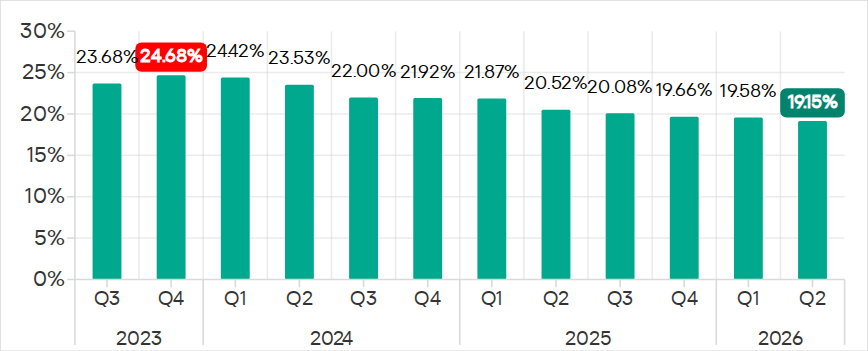
Percentage of ICS computers on which malicious objects were blocked, Q3 2023–Q2 2026

Percentage of ICS computers on which malicious objects were blocked, Q3 2023–Q2 2026

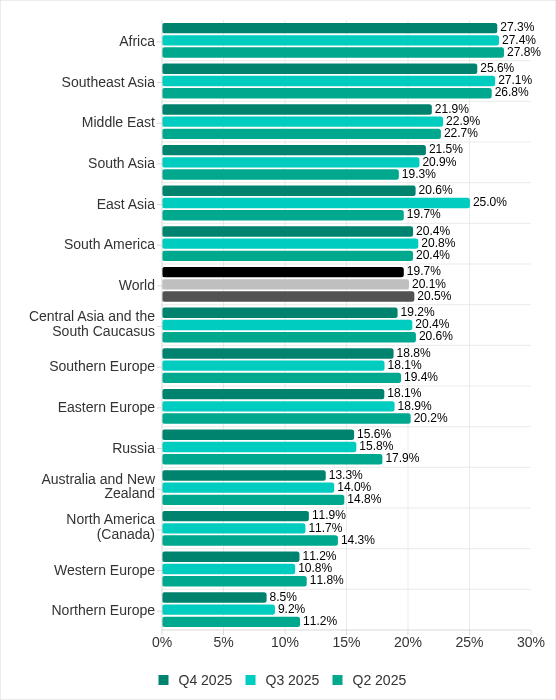
Regionally, the percentages ranged from 8.1% in Northern Europe to 27.9% in Africa.
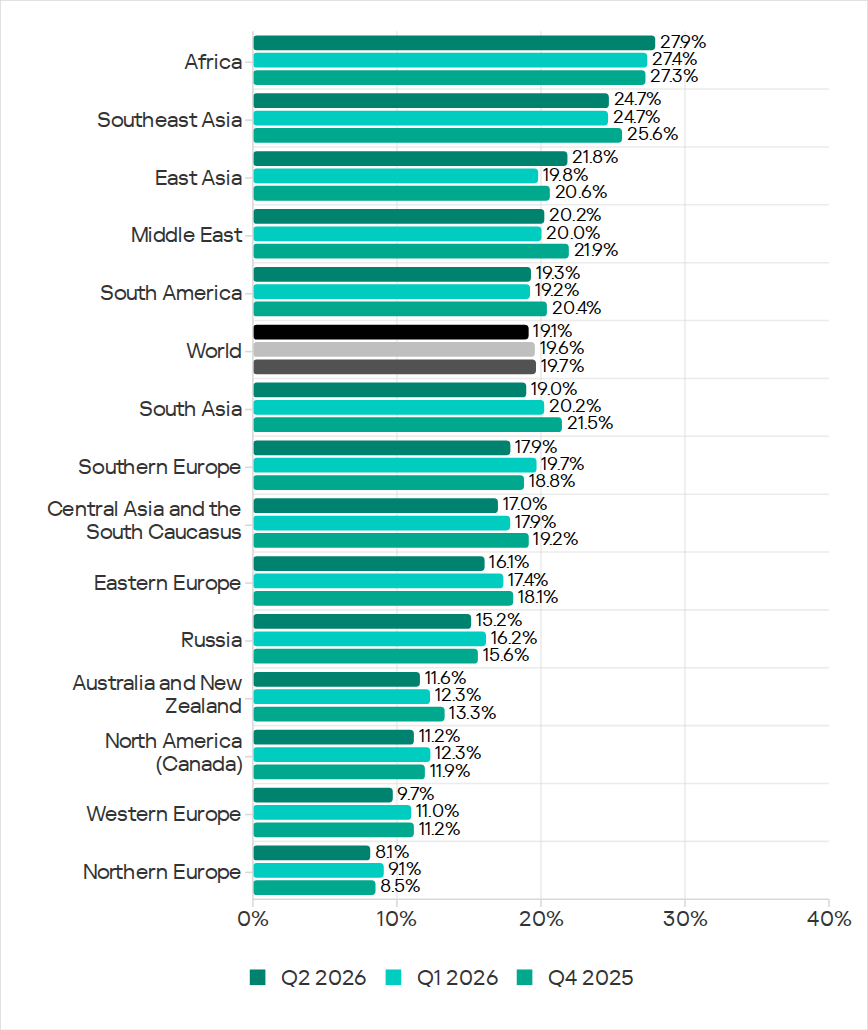
Regions ranked by percentage of attacked ICS computers

Regions ranked by percentage of attacked ICS computers

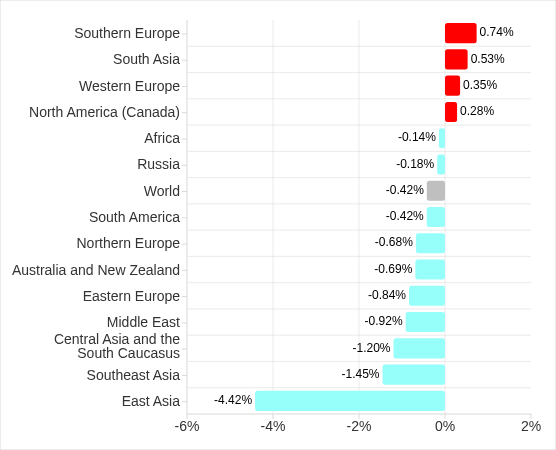
The figures increased in five regions over the quarter, most notably in East Asia (by 2.0 pp) and Africa (by 0.5 pp).

East Asia saw increases in percentages for all threats except miners. The region ranked first in terms of growth for malicious scripts and phishing pages, spyware, and viruses. East Asia also led in terms of growth in threats from the internet. The percentage of ICS computers on which email threats were blocked also increased.

Selected industries

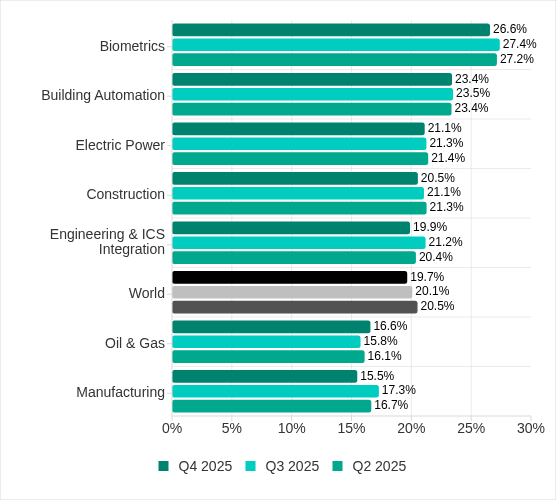
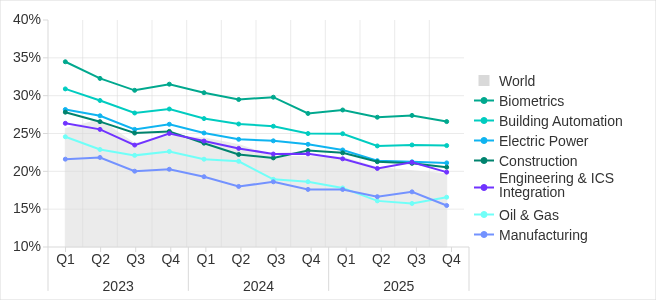
The biometrics sector (26.44%) has traditionally led the rankings of industries and OT infrastructures surveyed in this report in terms of the percentage of ICS computers on which malicious objects were blocked. Biometric systems are characterized by the availability of internet access, extensive email use for data exchange and approvals (e.g. access granting), and, in many cases, minimal cybersecurity controls within the organizations that use them.
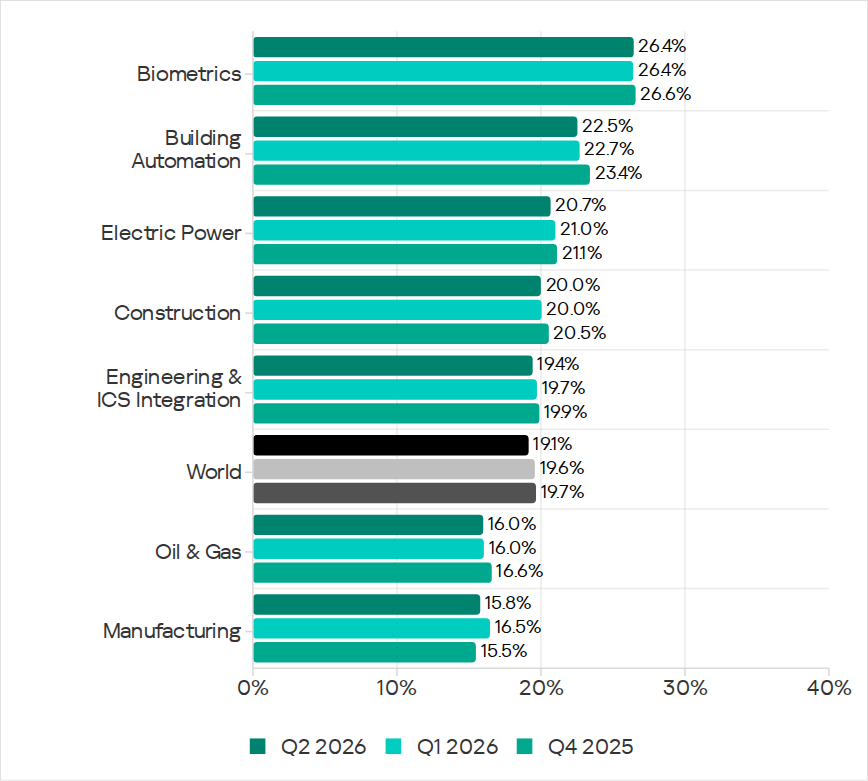
Industries ranked by percentage of ICS computers on which malicious objects were blocked

Industries ranked by percentage of ICS computers on which malicious objects were blocked

The biometrics sector ranked first among industries in terms of the following threat categories: malicious scripts and phishing pages, malicious documents, spyware, ransomware, and worms. The sector is also leading among industries in terms of email threats. At the same time, unlike other industries, the percentage of affected ICS computers for email threats in biometrics exceeds that for internet threats.

In all selected industries, the global average follows a downward trend.

Threat categories

In Q2 2026, Kaspersky security solutions blocked malware from 10,904 different malware families of various categories on industrial automation systems.

Over the quarter, the percentage of ICS computers on which malicious objects of the following categories were blocked increased: denylisted internet resources, malicious documents, worms, ransomware, and malware for AutoCAD.
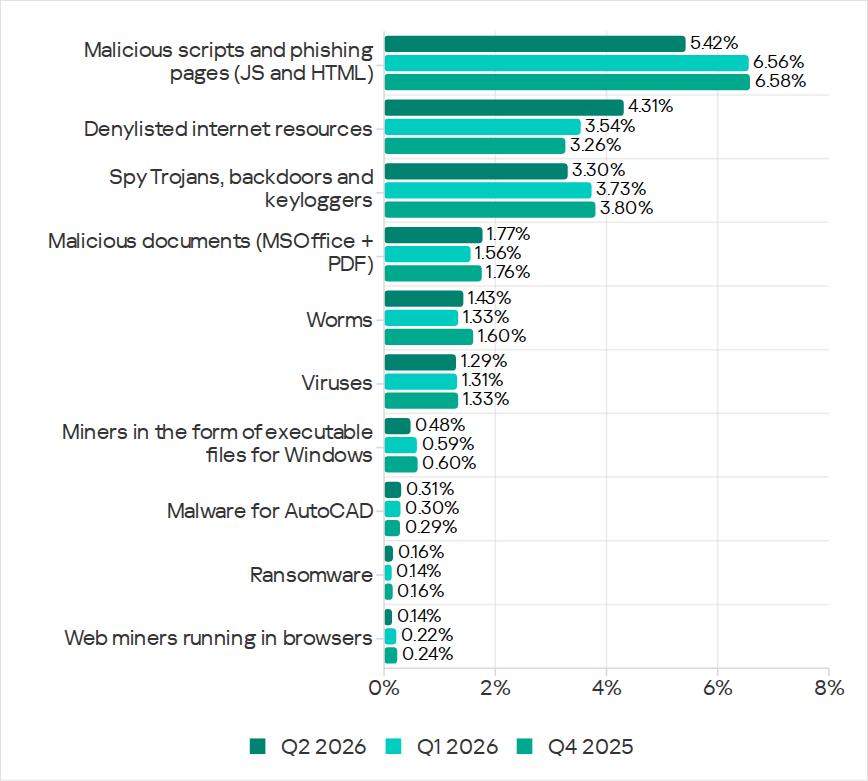
Percentage of ICS computers on which the activity of malicious objects from various categories was blocked

Percentage of ICS computers on which the activity of malicious objects from various categories was blocked

Malicious scripts and phishing pages (JS and HTML)

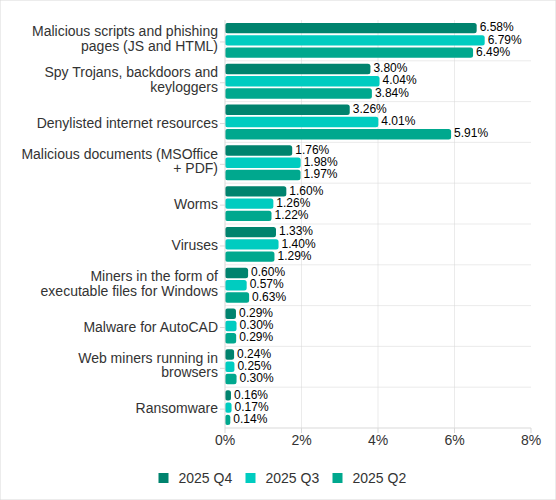
Malicious scripts and phishing pages remained in first place in the threat category rankings based on the percentage of ICS computers on which the respective threats were blocked. In Q2 2026, the global average dropped to 5.42%.

Over the quarter, the figure for this category only increased in East Asia, rising by 0.93 pp to 4.86%. This is the second-highest figure in the region in the last three years.

In East Asia, the percentage of ICS computers affected by malicious scripts and phishing pages increased in all the industries surveyed, except construction. The highest figures were recorded for biometrics (9.01%) and building automation (6.49%).

Denylisted internet resources

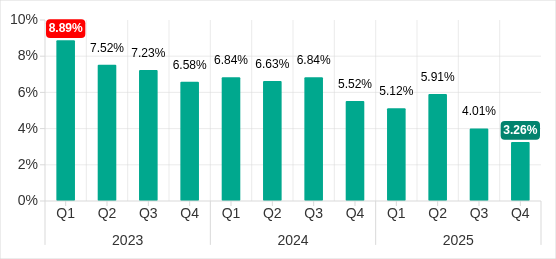
In Q2 2026, denylisted internet resources rose in the threat category rankings from third to second place, displacing spyware. Globally, the percentage of ICS computers on which denylisted internet resources were blocked has been increasing for two quarters in row and reached 4.31%.

The figures increased in all regions over the quarter, most notably in Russia (by 1.33 pp). Moreover, Russia ranked first (5.17%) among the regions in terms of denylisted internet resources. Since 2022, the region has topped these rankings twice before, both times in Q2: in 2022 and 2024.

Among the selected industries in Russia, the highest figures for the denylisted internet resources were in the electric power (6.61%) and engineering and ICS integration (5.62%) industries.

Malicious documents (MSOffice + PDF)

Malicious documents ranked fourth in the threat category rankings by the percentage of ICS computers on which they were blocked. The percentage for this category decreased over the previous three quarters, reaching its lowest level in three years. However, in Q2 2026, it increased to 1.77%.

Over the quarter, the figures for malicious documents increased in seven regions, most notably in South America (by 1.35 pp) and Southern Europe (by 0.48 pp). These two regions are among the top three in terms of malicious documents, malicious scripts and phishing pages, as well as threats from email clients.

South America ranked second in the rankings of regions in terms of malicious documents. In Q2 2026, the percentage of ICS computers in the region on which this threat was blocked was 3.56%, which was the fourth highest in three years.

Among the selected industries in South America, the highest percentage of ICS computers on which malicious documents were blocked was in biometrics (6.67%).

Southern Europe ranked first in the rankings of regions in terms of malicious documents. In the previous quarter, the percentage of ICS computers in the region on which this threat was blocked was the lowest in three years, but in Q2 2026 it increased to 3.63%.

Among the selected industries in Southern Europe, the highest percentage of ICS computers on which malicious documents were blocked was once again in biometrics (11.48%).

Spyware

Spyware ranked third in the threat category rankings based on the percentage of ICS computers on which it was blocked. The percentage for this category (3.30%) is the lowest since 2022.

Over the quarter, the figures increased in three regions, most notably in East Asia (by 0.53 pp) and Southeast Asia (by 0.42 pp).

East Asia ranked third based on the figures for spyware (4.77%), behind Africa and Southeast Asia. This is the region’s highest rate since Q2 2025. Among the countries and territories in the region, the highest percentage of ICS computers on which spyware was blocked was in mainland China (6.61%). Among the selected industries in East Asia, the highest figures for spyware were in the electric power (11.75%) and manufacturing (5.87%) industries. In all the industries surveyed, the figures are higher than the regional average.

Southeast Asia ranked second after Africa in the ranking of regions in terms of spyware, with 5.32%. Among the selected industries in Southeast Asia, the highest figures for spyware were in biometrics (8.93%) and manufacturing (7.32%). The figures increased in all industries over the quarter.

Ransomware

The percentage of ICS computers on which ransomware was blocked decreased in the previous three quarters but increased to 0.16% in Q2 2026.

During the quarter, the percentage increased in all regions, except Western and Southern Europe and North America (Canada). Africa led the ranking in terms of growth for this metric.

In Q2 2026, Africa ranked first among the regions in terms of the percentage of ICS computers on which ransomware was blocked (0.29%). The only time the figure in the region was higher in the past three years was Q2 2025 (0.31%).

Among the selected industries in Africa, the highest figures for ransomware were in the electric power industry (0.72%) and biometrics (0.52%). Over the quarter, the figures increased in all industries, except manufacturing and construction. The biggest increase was recorded in the electric power industry.

In Russia, the percentage of ICS computers on which ransomware was blocked in biometric systems has increased for three consecutive quarters, reaching 1.22%. This is the highest level of ransomware across all industries in all regions.

Miners

In Q2 2026, the percentage of ICS computers on which miners were blocked was the lowest since 2021, for both miners in the form of executable files for Windows (0.48%) and web miners running in browsers (0.14%).

The figures for both categories decreased in all regions, except for Africa where figures for miners in the form of executable files for Windows increased slightly.

On average, the oil and gas industry led the rankings among the selected industries both in terms of miners in the form of executable files for the Windows OS (0.66%) and in terms of web miners (0.34%).

Worms

In Q2 2026, the percentage of ICS computers on which worms were blocked increased to 1.43%.

In Q2 2026, the Middle East (2.11%) was second (after Africa) in the rankings of regions in terms of worms, displacing Central Asia and the South Caucasus.

Among the selected industries in the Middle East, the highest percentage of ICS computers on which worms were blocked was in building automation (2.90%). Over the quarter, the figures increased in all industries.

Australia and New Zealand ranked 12th among the regions in terms of the percentage of ICS computers on which worms were blocked (0.41%). Over the past three years, the figure in this region was only higher in Q2 2024 (0.42%). The figures increased in all the surveyed industries in the region, most notably in manufacturing and electric power. As a result, for these industries they exceeded the regional average by 2.9 and 2.3 times, respectively.

Viruses

In Q2 2026, the percentage of ICS computers on which viruses were blocked decreased to 1.29%.

The top three regions for this metric remain unchanged: Southeast Asia (6.03%), Africa (4.22%), and East Asia (3.14%). These same regions lead the rankings in terms of malware for AutoCAD.

The figures increased in three regions: East Asia, Australia and New Zealand, and Africa, where it has been growing for four consecutive quarters and reached its highest value since 2022.

Among the selected industries in Africa, the highest percentage of ICS computers on which viruses were blocked was in construction (5.47%).

East Asia ranked third among the regions in terms of viruses, reaching the highest level in the region for the past three years. Among the countries and administrative regions of East Asia, mainland China is the clear leader in terms of viruses (5.07%).

Among the selected industries in East Asia, the highest percentage of ICS computers on which viruses were blocked was in construction (5.93%).

In Australia and New Zealand, the increase in the percentage of ICS computers on which viruses were blocked was primarily due to a 4.3-fold increase in the figure for the electric power industry: from 0.29% to 1.24%. For a region where the percentage of attacked ICS computers for all threats is 0.12%, this is a very high value.

Malware for AutoCAD

In Q2 2026, the percentage of ICS computers on which malware for AutoCAD was blocked increased to 0.31%.

The most notable increase over the quarter was observed in Africa. After more than doubling in the previous quarter, the figure for the region continued to rise (although not so dramatically), reaching 1.02%.

Among the selected industries across all regions, the highest percentage of ICS computers on which malware for AutoCAD was blocked was in construction in East Asia (6.38%) and in Southeast Asia (4.05%).

Main threat sources

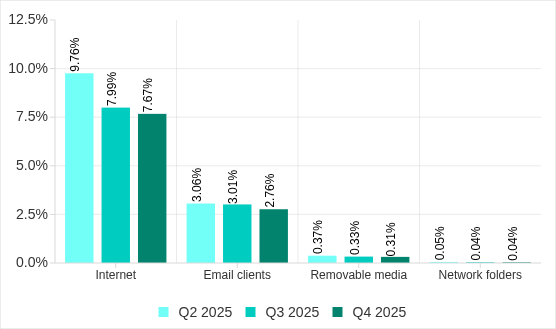
In Q2 2026, of all the threat sources, the percentage increased only for email.
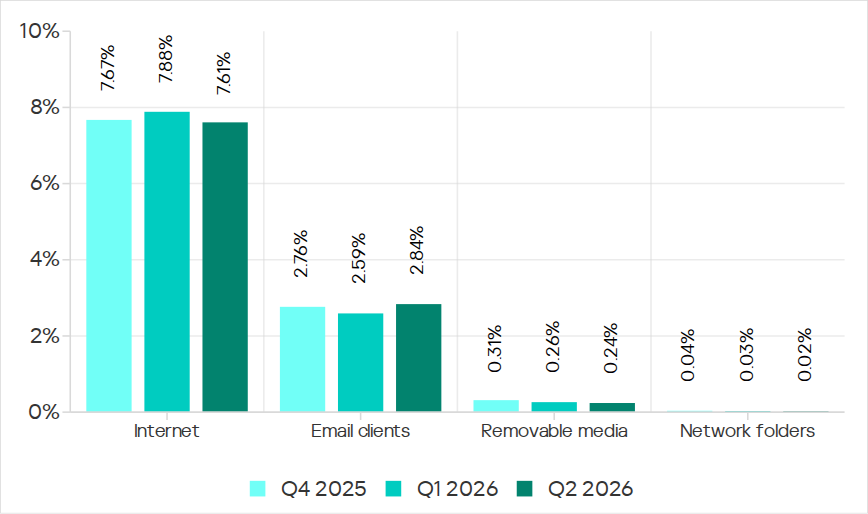
Percentage of ICS computers on which malicious objects from various sources were blocked

Percentage of ICS computers on which malicious objects from various sources were blocked

Internet

The percentage of ICS computers on which threats from the internet were blocked decreased to 7.61%, reaching its lowest level since 2021.

Over the quarter, the percentage increased in three regions: East Asia by 0.8 pp (to 6.3%), South Asia by 0.3 pp (to 10.4%), and Russia by 0.3 pp (to 6.4%).

Among the selected industries across all regions, the highest percentage of ICS computers on which threats from the internet were blocked was in biometrics (13.03%) and engineering and ICS integration (12.16%) in South Asia.

Email

The percentage of ICS computers on which email threats were blocked increased to 2.84%.

In Q2 2026, the percentage of ICS computers on which email threats were blocked increased in South America by 1.0 pp (to 5.2%) and in Africa by 0.7 pp (to 4.3%).

Among the selected industries across all regions, the highest percentage of ICS computers on which email threats were blocked was in biometrics (19.14%) and building automation (12.49%) in Southern Europe.

Removable media

The percentage of ICS computers on which threats from removable media were blocked continued to decrease, reaching 0.24%, the lowest value for the period under review.

Among the selected industries across all regions, the highest percentage of ICS computers on which threats from removable media were blocked was in the electric power industry in East Asia (1.34%) and biometrics in Africa (1.29%).

Network folders

The percentage of ICS computers on which threats from network folders were blocked continued to decrease. In Q2 2026, it was the lowest for the period under review, at 0.023%.

The only region to see an increase in the percentage of ICS computers on which threats from network folders were blocked during the quarter was Africa. This was mainly due to an increase in the building automation figure to 0.05%.

Among the selected industries across all regions, the highest percentage of ICS computers on which threats from network folders were blocked was in biometrics (0.23%), building automation (0.17%), and engineering and ICS integration (0.13%) in East Asia.

For more information on industrial threats see the full version of the report.

  • ✇Securelist
  • Exploits and vulnerabilities in Q2 2026 Alexander Kolesnikov
    The vulnerability landscape shifted significantly in Q2 2026. First, the number of registered CVEs reached an unprecedented level. This is driven primarily by the widespread adoption of AI, both for application development and search for security flaws. This resulted in entire new classes of vulnerabilities emerging, particularly in the Linux networking subsystem. Second, security researchers have been publishing exploits for unpatched vulnerabilities more frequently. Publications like these can
     

Exploits and vulnerabilities in Q2 2026

26 de Agosto de 2026, 07:00

The vulnerability landscape shifted significantly in Q2 2026. First, the number of registered CVEs reached an unprecedented level. This is driven primarily by the widespread adoption of AI, both for application development and search for security flaws. This resulted in entire new classes of vulnerabilities emerging, particularly in the Linux networking subsystem.

Second, security researchers have been publishing exploits for unpatched vulnerabilities more frequently. Publications like these can generate significant fallout, since they potentially open the door for attackers to target unprotected systems.

Statistics on registered vulnerabilities

This section provides statistical data on registered vulnerabilities. The data comes from Kaspersky’s vulnerability knowledge base, which draws on the CVE database as well as the Russian BDU database and GitHub Advisory (GHSA). As a result, the figures for previous reporting periods may differ from those published in earlier reports.

We examine the number of registered vulnerabilities for each month over the last five years. As the chart below shows, this number continues to surge, a trend reflected across all the databases we track. It’s driven primarily by the widespread adoption of AI tools: as we predicted in our previous report, these tools have played a major role in the discovery of vulnerabilities in third-party software. Meanwhile, these tools often contain security issues of their own. For example, OpenClaw, a popular AI project, ranked 12th among those with the highest number of vulnerabilities discovered and published in Q2, with over 200 CVEs registered during the reporting period. Finally, AI development tools are also contributing to the vulnerability landscape, since the quality of the code they produce can vary widely. Therefore, the rate at which new vulnerabilities are discovered will inevitably keep growing.

Total published vulnerabilities per month from 2022 through 2026 (download)

Next, we analyze the number of new critical vulnerabilities (CVSS > 9.0) over the same period.

Total critical vulnerabilities published per month from 2022 through 2026 (download)

As the chart shows, the number of published critical vulnerabilities jumped sharply in Q2. This is because using AI for vulnerability research makes it possible to analyze massive amounts of previously unexamined code, uncover new attack surfaces, and identify entire classes of vulnerabilities that have gone unnoticed for decades. In particular, AI was used to find a series of Dirty Frag vulnerabilities in the Linux kernel.

Exploitation statistics

This section presents statistics on vulnerability exploitation for Q2 2026. The data draws on open sources and our telemetry.

Windows and Linux vulnerability exploitation

Q2 2026 saw a new precedent in the publication of vulnerabilities in Windows components and exploits for these: researchers no longer waiting for CVE registration, let alone patches. A case in point: a researcher who goes by Nightmare Eclipse (also known as Chaotic Eclipse) published a list of new “named” vulnerabilities across various Windows subsystems. At the time the technical details were published, none of the vulnerabilities had been assigned a CVE identifier:

  • BlueHammer: a local privilege escalation vulnerability in Windows Defender. During signature database updates, a time-of-check to time-of-use (TOCTOU) race condition occurs, allowing an attacker to substitute the directory where temporary update files are written. The researcher published a fully functional exploit for the vulnerability.
  • RedSun: another logical vulnerability in Windows Defender with a working exploit. Suspicious and malicious files marked as “cloud” can be overwritten or restored to their original directory with elevated privileges. The exploit incorporates fragments of algorithms that make it possible to leverage various logical vulnerabilities in Windows, effectively combining a large number of popular exploitation techniques.
  • YellowKey: a vulnerability that lets the user bypass BitLocker full-disk encryption and access system data through the Windows Recovery Environment (WinRE). A fully functional exploit was also published.
  • GreenPlasma: a vulnerability that enables system object injection via the CTF loader for the Collaborative Translation Framework (CTFMON) service in Windows. The original publication included an exploit with limited functionality.
  • RoguePlanet: yet another Windows Defender vulnerability that, like BlueHammer, stems from a TOCTOU issue, this time in the engine responsible for real-time system scanning. The published exploit uses the vulnerability to overwrite the system file wermgr.exe with a malicious one.
  • UnDefend: another vulnerability in the Windows Defender service. This time, the exploit causes a denial of service and blocks updates.

Even though such cases remain isolated for now, we believe they’ll grow into a full-fledged trend. Early publication of exploits gives attackers an advantage over software developers, who are left with no time to fix the issues.

Veteran vulnerabilities in Windows software also remain relevant. These are the ones our solutions most frequently detect exploits for:

  • CVE-2018-0802: a remote code execution (RCE) vulnerability in the Equation Editor component
  • CVE-2017-11882: another RCE vulnerability also affecting Equation Editor
  • CVE-2017-0199: a vulnerability in Microsoft Office and WordPad that allows an attacker to gain control over the system
  • CVE-2023-38831: a vulnerability in WinRAR that involves improper handling of objects within an archive
  • CVE-2025-6218 (formerly ZDI-CAN-27198): another WinRAR vulnerability allowing the specification of relative paths to extract files into arbitrary directories, potentially leading to malicious command execution
  • CVE-2025-8088: a vulnerability similar in exploitation method to CVE-2025-6218. The attackers used NTFS Streams to circumvent controls on the directory into which files are being unpacked

The vulnerabilities listed here can be leveraged to gain initial access to a vulnerable system and for privilege escalation. This underscores the critical importance of timely software updates.

That said, the number of Windows users who encountered exploits declined slightly in Q2, hitting an 18-month low.

Dynamics of the number of Windows users encountering exploits, Q1 2025 – Q2 2026. The number of users who encountered exploits in Q1 2025 is taken as 100% (download)

Linux also hit a rough patch in Q2 2026. Specifically, the period saw the disclosure of the Dirty Frag family of vulnerabilities, which lets an attacker reliably escalate privileges within the operating system.

All the vulnerabilities published in Q2 2026 were, in one way or another, related to the Linux caching subsystem. Here are the ones being most actively exploited:

  • CVE-2026-31431 (Copy Fail): a local privilege escalation vulnerability in the Linux kernel that lets an unprivileged user modify the page cache and gain root privileges. Especially dangerous for cloud and containerized environments
  • CVE-2026-43284, CVE-2026-43500 (Dirty Frag): a family of vulnerabilities in the Linux networking subsystem (IPsec ESP and RxRPC) that lets a local user overwrite the page cache and escalate privileges to root
  • CVE-2026-46300 (Fragnesia): a local privilege escalation vulnerability in the Linux kernel related to packet fragment handling and the page cache mechanism. It lets an unprivileged user gain root privileges and is also classified as part of the Dirty Frag family
  • CVE-2026-31635 (DirtyDecrypt): a Linux kernel vulnerability that lets a local attacker escalate privileges due to improper handling of decryption operations and page cache data modification
  • CVE-2026-43494 (PinTheft): a Linux kernel vulnerability that lets a local user gain elevated privileges due to errors in the memory page pinning mechanism
  • CVE-2026-46331 (pedit COW): a vulnerability in the Linux kernel’s traffic control subsystem (tc-pedit) that exploits a flaw in copy-on-write to modify the page cache and subsequently escalate privileges to root

The vulnerabilities described above were quickly embraced by attackers. At the same time, our solutions continue to detect exploitation attempts targeting older vulnerabilities as well:

  • CVE-2022-0847: a vulnerability known as Dirty Pipe, which enables privilege escalation and the hijacking of running applications
  • CVE-2019-13272: a vulnerability caused by improper handling of privilege inheritance, which can be exploited to achieve privilege escalation
  • CVE-2021-22555: a heap out-of-bounds write vulnerability in the Netfilter kernel subsystem
  • CVE-2023-32233: another Netfilter subsystem vulnerability that allows for Use-After-Free conditions and privilege escalation through improper processing of network requests

Dynamics of the number of Linux users encountering exploits, Q1 2025 – Q2 2026. The number of users who encountered exploits in Q1 2025 is taken as 100% (download)

In Q2 2026, the number of Linux users who encountered exploits declined slightly compared to Q1. Given that a significant share of new vulnerabilities are tied to the operating system’s caching subsystem, we recommend installing patches as quickly as possible, or disabling vulnerable kernel modules if patching isn’t an option.

Most common published exploits

The distribution of published exploits by software type in Q2 2026 includes categories that haven’t appeared in the sample for a long time. For instance, we’re once again seeing exploits targeting SharePoint. It’s worth noting that while several vulnerability write-ups for Exchange and SharePoint were published during the quarter, most turned out to be fake, AI-generated research. While the articles and exploit source code themselves look fairly polished, they describe nonexistent problems in the software or its components — often close to genuinely vulnerable mechanisms — in order to mislead researchers. This type of attack is aimed at increasing the time it takes to detect real vulnerabilities. In some cases, the description of a nonexistent vulnerability came bundled with completely unrelated malware.

Distribution of published exploits by platform, Q1 2026 (download)

Distribution of published exploits by platform, Q2 2026 (download)

Vulnerability exploitation in APT attacks

We analyzed which vulnerabilities were exploited in APT attacks during Q2 2026. The rankings provided below include data based on our telemetry, research, and open sources.

TOP 10 vulnerabilities exploited in APT attacks, Q2 2026 (download)

In Q2 2026, a trend emerged in APT attacks toward exploiting new vulnerabilities right from the moment they’re published. As before, we’re also seeing a large number of zero-day vulnerabilities. The Langflow vulnerability deserves particular attention: it’s one of the first cases of an APT group exploiting AI technology, which many organizations are only just beginning to integrate. Because most of this tech is proprietary, it has a considerable number of security blind spots. Therefore, given the growing number of AI-based automation tools, we strongly recommend going beyond the usual patching and developing secure procedures for credential use and sensitive data handling in systems that rely on agents and LLMs.

C2 frameworks

In this section, we examine the most popular C2 frameworks used by APT groups and analyze the vulnerabilities targeted by the exploits that interacted with C2 agents in APT attacks.

The chart below shows the frequency of known C2 framework usage in attacks during Q2 2026, according to open sources.

TOP 10 C2 frameworks used by APTs to compromise user systems, Q2 2026 (download)

Sliver, Havoc, AdaptixC2, and Metasploit remain the most widely used C2 frameworks. After studying open sources and analyzing samples of malicious C2 agents that contained exploits, we determined that the following vulnerabilities were utilized in APT attacks involving the C2 frameworks mentioned above:

  • CVE-2026-35273: a vulnerability in Oracle PeopleSoft PeopleTools that security vendors classify as server-side request forgery (SSRF). The details of the vulnerability have never been disclosed, although some research covers the post-exploitation steps
  • CVE-2023-46604: an insecure deserialization vulnerability in Apache ActiveMQ that allows arbitrary code execution in the context of the service process
  • CVE-2024-12356 and CVE-2026-1731: command injection vulnerabilities in BeyondTrust software that allow an attacker to send malicious commands even without system authentication
  • CVE-2023-36884: a vulnerability in the Windows Search component that allows commands to be run on the system, bypassing the mark-of-the-web (MoTW) mechanism
  • CVE-2025-53770: an insecure deserialization vulnerability in Microsoft SharePoint that allows for unauthenticated command execution on the server
  • CVE-2025-8088 and CVE-2025-6218: similar directory traversal vulnerabilities in WinRAR that allow files to be extracted from an archive to a predetermined path, potentially without the archiving utility displaying any alerts to the user

These vulnerabilities show that attackers used them for initial access and privilege escalation on vulnerable systems, setting the stage for launching a C2 agent. They include both zero-day vulnerabilities and fairly well-known security issues.

LLM/AI tool vulnerabilities

This section analyzes data published in Kaspersky’s vulnerability knowledge base. We reviewed the Q2 2026 version of the knowledge base.

As mentioned above, AI tools, plugins, and technologies have proven fairly effective at automating the search for problematic code and anomalous behavior. The high speed at which new vulnerabilities are being discovered has naturally created a need to fix them just as quickly. AI is often used for this too, which increases the volume of code being generated. However, neither code written without human involvement nor AI-generated advice is always correct.

The chart below covers registered vulnerabilities in AI tools for 2025–2026.

Number of published vulnerabilities in LLMs, AI tools, and plugins with similar functionality, 2025–2026 (download)

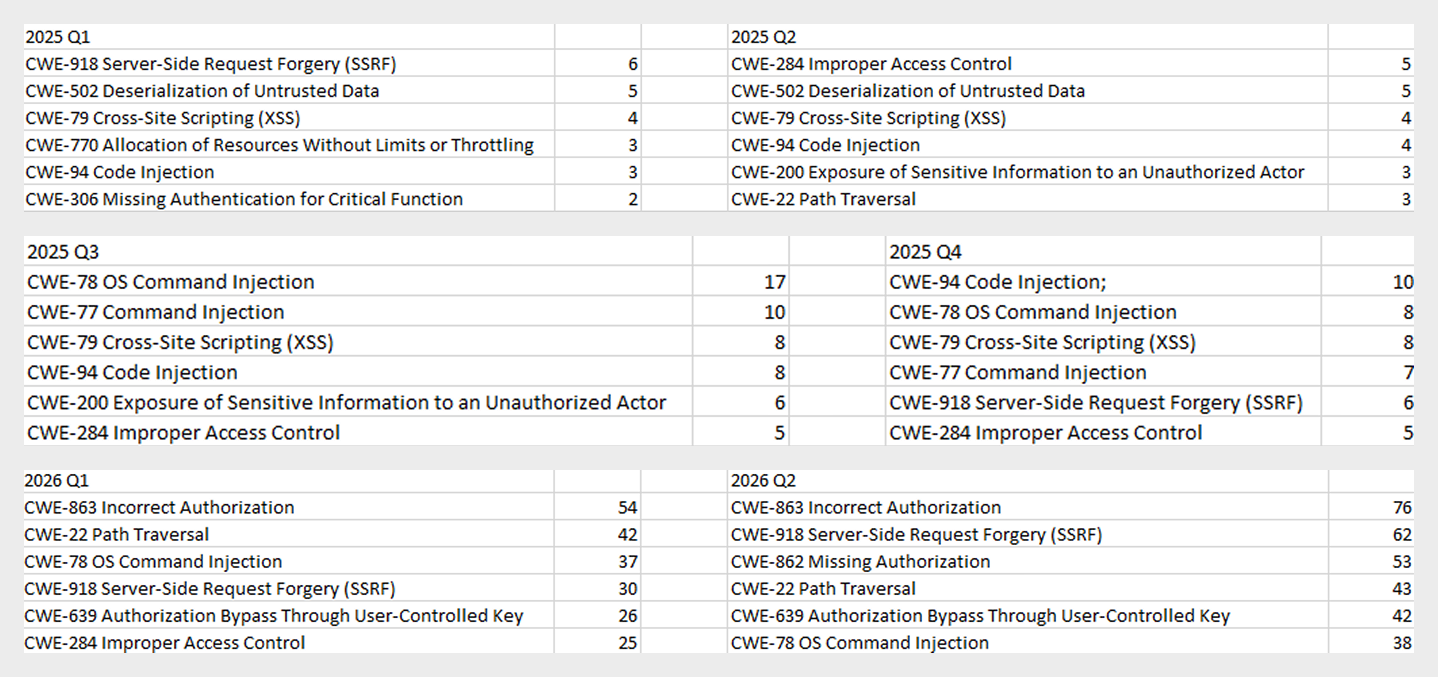
As the charts show, AI tools are racking up a substantial number of registered vulnerabilities, and that number keeps growing quarter over quarter. It’s also worth looking at how AI tool vulnerabilities break down by type, according to the CWE system:

TOP 6 vulnerability types in products that implement or use AI/LLM logic, 2025–2026

TOP 6 vulnerability types in products that implement or use AI/LLM logic, 2025–2026

Interestingly, vulnerabilities of an undetermined type have ranked first in every quarter since the start of 2025. Traditionally-made software has the same issue, and it doesn’t look like the growing number of AI tools will fix it. It’s also notable that the list includes classes CWE developers themselves don’t recommend using for vulnerability classification, since they lump together a whole range of more specific types. CWE-284 is an example of this.

Looking at the most common classes, the key issues found in AI-related software can be summed up as follows:

  • Inadequate access control over critical system objects
  • Improper implementation of authentication and authorization mechanisms
  • Injections

It’s worth noting that injection-related vulnerabilities were relatively rare before AI agents took off (previously, they mostly affected web apps). Recently, though, these security issues have become relevant again.

Looking back at a year and a half of the AI boom, one conclusion stands out regarding registered vulnerabilities: AI tool developers are more focused on expanding functionality than on security. This is worth keeping in mind when using these tools. Let’s look at the projects and applications that either integrated AI tools or offered them as the core product. Below is a list of the those with the highest number of registered vulnerabilities for 2025–2026.

TOP AI/LLM-related projects by number of published vulnerabilities, 2025–2026 (download)

Notable vulnerabilities

This section highlights the most significant vulnerabilities published in Q2 2026 that have publicly available descriptions. Since the above already covers several significant vulnerabilities published during the reporting period, this section consists mainly of LLM/AI tool vulnerabilities.

CVE-2026-25253: a gatewayUrl vulnerability in OpenClaw

The issue stems from the fact that the OpenClaw user interface trusts the value of the gatewayUrl parameter passed in the URL and automatically establishes a WebSocket connection to the specified address. During this connection process, it sends an authentication token without any additional user confirmation.

The attack algorithm exploiting this vulnerability works as follows:

  1. The application obtains a critical connection address from an external source (the gatewayUrl URL parameter), which is controlled by the attacker.
  2. There is no validation before use.
  3. The client automatically initiates a connection to the address specified in the parameter, which belongs to the attacker.
  4. While connected, the application sends credentials (an access token) to the specified address.

If the attacker obtains a valid token, the consequences depend on that token’s level of access within the system. In general, this could lead to:

  • User session compromise
  • Execution of operations on the user’s behalf
  • Modification of the AI agent configuration
  • Unauthorized access to tools and resources connected to the agent
  • Under certain OpenClaw configurations, further compromise of the host running the agent

It’s worth noting that the risk of exploitation arises from a combination of several factors: the automatic connection and token transmission, the lack of address trust verification, and the high privileges granted to the local AI agent.

CVE-2026-41948: a path traversal vulnerability in the Dify AI platform

The vulnerability lets an authenticated user craft a request that enables the application to escape its permitted tenant and gain access to internal REST APIs that weren’t meant for that user. The root cause is insufficient normalization and validation of the URL path before it’s passed to the internal service.

Depending on the Dify configuration, the consequences can include:

  • Unauthorized access to internal service interfaces
  • Breach of isolation between workspaces
  • Exposure of internal service information
  • Conditions favorable to further attacks when combined with other vulnerabilities

The use of Dify in enterprise AI platforms is particularly risky, since internal services there tend to hold elevated privileges.

CVE-2026-45386: an improper access control vulnerability in Open WebUI

In Open WebUI, pin/unpin operations on messages are write operations, since they modify that message’s metadata (is_pinned, pinned_by, pinned_at). In vulnerable versions, however, before performing these actions, the API only checked for read access to the channel (a chat between a user or group and the AI) containing the message, not permission to modify its content. As a result, a user with a role limited to viewing messages could still change a message’s pinned status.

The vulnerability’s mechanism works as follows:

  1. The user initiates an action that changes the state of an object.
  2. The application treats this action as a regular read request.
  3. Only channel view permission is checked.
  4. The application performs a write without verifying the required user authorization.

This violates one of the fundamental principles of access control models — namely, that any operation that changes the state of data must be checked for the appropriate write or moderation permissions, regardless of whether the object itself is readable.

Although the vulnerability doesn’t lead to arbitrary code execution or compromise of sensitive data, it can affect data integrity and collaborative workflows. Potential consequences of exploitation include unauthorized pinning or unpinning of messages, disruption of channel moderators’ and administrators’ activities, changes to the display order of important information, and even the potential spread of false or misleading information by altering the channel containing a pinned message.

Open WebUI is widely used as an interface for interacting with local and enterprise LLMs. In these systems, pinned messages often contain important instructions, announcements, or tips for users. The ability to modify them with minimal privileges can disrupt collaborative workflows, cause confusion, and undermine trust in information published by administrators and moderators.

CVE-2026-45501: a vulnerability in Microsoft Exchange

The vulnerability stems from improper neutralization of user input when generating Exchange web pages. As a result, the browser may interpret specially crafted data as active content instead of plain text.

Although Microsoft categorizes the potential impact of exploiting this vulnerability as spoofing, flaws like this can lead to alteration of displayed content, imitation of trusted interfaces, actions on behalf of the user within an active session, and abuse of user trust.

It’s worth noting that issues like this are still relevant in modern software, given that mechanisms like Content Security Policy and various parsers were specifically created to help developers neutralize dangerous parts of user page content.

Conclusion and advice

Q2 brought the first significant results of AI automation adoption in software development and vulnerability hunting tools. This research shows that beyond traditional patch management, organizations now need real-time monitoring of systems and access controls, since infrastructure and everyday applications now contain far more AI functionality that could lead to compromise.

Accordingly, besides quickly detecting infrastructure vulnerabilities and managing security patches, modern enterprise-grade security solutions need to provide a broad range of preventive measures for tracking the overall health of systems and workstations. Kaspersky Next meets these requirements by combining proactive mechanisms with the ability to respond promptly to emerging threats.

  • ✇Securelist
  • IT threat evolution in Q2 2026. Non-mobile statistics AMR
    IT threat evolution in Q2 2026. Non-mobile statistics IT threat evolution in Q2 2026. Mobile statistics The statistics in this report are based on detection verdicts returned by Kaspersky products unless otherwise stated. The information was provided by Kaspersky users who consented to sharing statistical data. Quarterly figures In Q2 2026: Kaspersky products blocked nearly 400 million attacks that originated with various online resources. Web Anti-Virus responded to 52 million unique links. Fi
     

IT threat evolution in Q2 2026. Non-mobile statistics

Por:AMR
10 de Agosto de 2026, 07:00

IT threat evolution in Q2 2026. Non-mobile statistics
IT threat evolution in Q2 2026. Mobile statistics

The statistics in this report are based on detection verdicts returned by Kaspersky products unless otherwise stated. The information was provided by Kaspersky users who consented to sharing statistical data.

Quarterly figures

In Q2 2026:

  • Kaspersky products blocked nearly 400 million attacks that originated with various online resources.
  • Web Anti-Virus responded to 52 million unique links.
  • File Anti-Virus blocked more than 16 million malicious and potentially unwanted objects.
  • There were 2538 new ransomware variants discovered.
  • More than 71,000 users experienced ransomware attacks.
  • 15% of all ransomware victims whose data was published on threat actors’ data leak sites (DLS) were attacked by Qilin.
  • More than 213,000 users were targeted by miners.

Ransomware

Quarterly trends and highlights

Threat actor disruption

Microsoft has dismantled an illicit malware-signing service used by ransomware operators. Microsoft’s Digital Crimes Unit has shut down a malware-signing-as-a-service (MSaaS) operation run by the threat group Fox Tempest. The illicit service abused the Microsoft Artifact Signing platform to generate digital signature certificates for malicious software. Malware signed by these certificates was observed in campaigns conducted by such ransomware groups as Rhysida, Akira, INC, Qilin, and BlackByte. The service was also leveraged by operators of the Oyster loader as well as the Lumma and Vidar infostealers. To disrupt the operation, Microsoft seized the domain used by the MSaaS platform, revoked all associated certificates, and disabled the related accounts. Additionally, the company filed a lawsuit against Fox Tempest.

Vulnerabilities and attacks

CISA has confirmed that a Windows vulnerability known as BlueHammer is actively being exploited in ransomware attacks. On April 22, the agency updated its Known Exploited Vulnerabilities (KEV) catalog to note the ongoing ransomware exploitation of CVE-2026-33825. The local privilege escalation flaw in Microsoft Defender was originally disclosed earlier in April. Although Microsoft released a fix on April 14, unpatched systems remain vulnerable. CISA did not disclose further details or attribute the attacks to specific threat groups.

Check Point has linked zero-day exploitation of CVE-2026-50751 to the Qilin ransomware group. The critical vulnerability affects Check Point Remote Access VPN and Mobile Access. Attackers began exploiting the flaw as a zero-day on May 7, with activity spiking sharply in early June. While several dozen organizations have been targeted, at least one incident has been definitively tied to Qilin. Check Point also disclosed a related certificate validation flaw (CVE-2026-50752) that affects site-to-site VPN connections relying on the legacy IKEv1 key exchange protocol.

Researchers assess with high confidence that the PayoutsKing group is leveraging the legitimate QEMU emulator to deploy hidden, Alpine Linux-based virtual machines on compromised hosts. Because security solutions often lack visibility inside virtualized environments, the threat actors use this technique to evade detection. Inside the VM image, the operators deploy various tools — such as credential theft software — and configure the virtual machine as a backdoor managed via a reverse SSH tunnel to their command-and-control infrastructure. While the technique is not new, and we’ve detailed it before, it remains relatively rare in ransomware attacks.

The most prolific groups

This section highlights the most prolific ransomware gangs by number of victims added to each group’s DLS. Qilin reclaimed the top spot (accounting for 14.57% of total listings) after placing second last quarter. It is followed by the Akira ransomware (7.80%) and the DragonForce RaaS group (6.88%).

Number of each group’s victims according to its DLS as a percentage of all groups’ victims published on all the DLSs under review during the reporting period (download)

Number of new ransomware variants

In Q2, Kaspersky solutions detected four new ransomware families and 2538 new modifications. This signals a continued stabilization following spikes seen in Q1 and Q4 of last year.

Number of new ransomware modifications, Q2 2025 — Q2 2026 (download)

Number of users attacked by ransomware Trojans

Our solutions protected a total of 71,860 unique users from ransomware during Q2. Ransomware activity peaked in April, with 31,206 targeted users recorded during that month.

Number of unique users attacked by ransomware Trojans, Q2 2026 (download)

TOP 10 countries and territories attacked by ransomware Trojans

Country/territory* %**
1 South Korea 0.87
2 Pakistan 0.76
3 China 0.71
4 Libya 0.49
5 Tajikistan 0.46
6 Turkmenistan 0.38
7 Cameroon 0.38
8 Indonesia 0.36
9 Bangladesh 0.36
10 Mozambique 0.34

* Excluded are countries and territories with relatively few (under 50,000) Kaspersky users.
** Unique users whose computers were attacked by ransomware Trojans as a percentage of all unique users of Kaspersky products in the country/territory.

TOP 10 most common families of ransomware Trojans

Name Verdict %*
1 (generic verdict) Trojan-Ransom.Win32.Gen 28.02
2 WannaCry Trojan-Ransom.Win32.Wanna 7.14
3 (generic verdict) Trojan-Ransom.Win32.Crypren 6.27
4 (generic verdict) Trojan-Ransom.Win32.Agent 4.89
5 (generic verdict) Trojan-Ransom.Win32.Encoder 4.65
6 (generic verdict) Trojan-Ransom.Python.Agent 3.07
7 (generic verdict) Trojan-Ransom.Win32.Crypmod 2.70
8 (generic verdict) Trojan-Ransom.MSIL.Agent 2.45
9 PolyRansom/VirLock Virus.Win32.PolyRansom / Trojan-Ransom.Win32.PolyRansom 2.31
10 (generic verdict) Trojan-Ransom.Win32.Phny 2.12

* Unique Kaspersky users attacked by the specific ransomware Trojan family as a percentage of all unique users attacked by this type of threat.

Miners

Number of new miner variants

In Q2 2026, Kaspersky solutions detected 6067 new miner variants, almost twice the number for the previous reporting period.

Number of new miner modifications, Q2 2026 (download)

Number of users attacked by miners

In Q2, we detected attacks using miner programs on the computers of 213,003 unique Kaspersky users worldwide.

Number of unique users attacked by miners, Q2 2026 (download)

TOP 10 countries and territories attacked by miners

Country/territory* %**
1 Mali 1.56
2 Senegal 1.54
3 Tanzania 1.32
4 Panama 1.04
5 Bangladesh 1.03
6 Ethiopia 0.87
7 Costa Rica 0.67
8 Bolivia 0.67
9 Côte d’Ivoire 0.65
10 Kazakhstan 0.62

* Excluded are countries and territories with relatively few (under 50,000) Kaspersky users.
** Unique users whose computers were attacked by miners as a percentage of all unique users of Kaspersky products in the country/territory.

Attacks on macOS

Quarterly highlights

In April, Aikido researchers reported a new attack by the GlassWorm stealer, which was distributed via malicious IDE extensions on the Open VSX Registry. The payload operated by installing a secondary malicious extension across all installed IDE environments on the host machine. Ultimately, this second-stage implant exfiltrated crypto wallet data, environment variables, and other secrets. It also installed a RAT on the infected device.

In May, Socket researchers uncovered a supply chain compromise involving the popular npm package art-template. As a result of the breach, the weaponized package injected the Coruna exploit kit into web applications it was used to build. Coruna targets iOS devices.

In June, Palo Alto Networks’ Unit 42 discovered FlutterShell, a new backdoor family that targets macOS devices. Developed with the Flutter framework, the malware leverages the WebView engine to load web pages that contain malicious JavaScript. On the client side, the backdoor registers bridge functions invoked by the loaded JavaScript that allow threat actors to execute arbitrary payloads on the victim’s device. Notably, the malicious applications successfully passed Apple notarization. Although the specific samples analyzed functioned primarily as adware, the underlying architecture permits the delivery of far more sophisticated malicious payloads.

TOP 20 threats to macOS

* Unique users who encountered this malware as a percentage of all attacked users of Kaspersky security solutions for macOS (download)

* Data for the previous quarter may differ slightly from previously published data due to some verdicts being retrospectively revised.

Detections of PasivRobber spyware continued their downward trend. Meanwhile, adware and traffic-routing utilities (categorized as NetTool) rose to the top of the rankings. Additionally, Q2 saw a noticeable spike in detections for the DirtyCow exploit frequently leveraged for iPhone jailbreaking.

TOP 10 countries and territories by share of attacked users

Country/territory %* Q1 2026 %* Q2 2026
Brazil 1.13 1.13
China 1.04 1.28
Hong Kong 0.92 0.49
Singapore 0.85 0.19
France 0.62 1.18
Mexico 0.43 0.72
India 0.41 0.42
Thailand 0.40 0.24
Germany 0.33 0.71
The Netherlands 0.31 0.62

* Unique users who encountered threats to macOS as a percentage of all unique Kaspersky users in the country/territory.

IoT threat statistics

This section presents statistics on attacks targeting Kaspersky IoT honeypots. The geographic data on attack sources is based on the IP addresses of attacking devices.

In Q2 2026, the breakdown of attacking devices and sessions that targeted Kaspersky honeypots by protocol was as follows:

Distribution of attacked services by number of unique IP addresses of attacking devices (download)

The share of SSH attacks saw a slight uptick compared to the previous quarter.

Distribution of cybercriminal sessions in Kaspersky honeypots (download)

TOP 10 threats delivered to IoT devices

Share of each threat delivered to an infected device as a result of a successful attack, out of the total number of threats delivered (download)

As is typically the case, Mirai botnet variants continue to dominate the IoT threat landscape. Activity of another prominent botnet, Prometei, also saw an increase.

Attacks on IoT honeypots

the Netherlands, Germany, and The United States accounted for the highest proportions of SSH-based attacks during this period. While the top three countries remained the same as last quarter, their relative rankings shifted.

Country/territory Q1 2026 Q2 2026
The Netherlands 17.57% 21.18%
Germany 10.34% 16.73%
United States 23.74% 6.76%
Bulgaria 1.10% 5.50%
Sweden 2.09% 4.93%
Panama 6.34% 4.67%
Luxembourg 0.16% 4.62%
Romania 5.82% 4.06%
Vietnam 3.50% 3.91%
India 6.05% 2.78%

The percentage of Telnet-based attacks originating from Pakistan continued to climb, knocking China down to second place.

Country/territory Q1 2026 Q2 2026
Pakistan 27.31% 36.60%
China 39.54% 35.62%
Russian Federation 8.25% 8.75%
India 4.66% 4.19%
Brazil 3.30% 3.34%
United States 0.45% 3.03%
Indonesia 6.71% 1.52%
Philippines 0.36% 0.95%
France 0.17% 0.84%
Thailand 0.55% 0.66%

Attacks via web resources

The statistics in this section are based on detection verdicts by Web Anti-Virus, which protects users when suspicious objects are downloaded from malicious or infected web pages. These malicious pages are purposefully created by cybercriminals. Websites that host user-generated content, such as message boards, as well as compromised legitimate sites, can become infected.

TOP 10 countries and territories that served as sources of web-based attacks

The following statistics show the distribution by country/territory of the sources of internet attacks blocked by Kaspersky products on user computers (web pages redirecting to exploits, sites containing exploits and other malware, botnet C&C centers, and so on). One or more web-based attacks could originate from each unique host.

To determine the geographic source of web attacks, we matched the domain name with the real IP address where the domain is hosted, then identified the geographic location of that IP address (GeoIP).

In Q2 2026, Kaspersky solutions blocked 399,312,961 attacks launched from internet resources worldwide. Web Anti-Virus was triggered by 52,850,592 unique URLs.

Web-based attacks by country/territory, Q1 2026 (download)

Countries and territories where users faced the greatest risk of online infection

To assess the risk of malware infection via the internet for users’ computers in different countries and territories, we calculated the share of Kaspersky users in each location on whose computers Web Anti-Virus was triggered during the reporting period. The resulting data provides an indication of the aggressiveness of the environment in which computers operate in different countries and territories.

This ranked list includes only attacks by malicious objects classified as Malware. Our calculations leave out Web Anti-Virus detections of potentially dangerous or unwanted programs, such as RiskTool or adware.

Country/territory* %**
1 Bangladesh 11.71
2 India 7.40
3 Tajikistan 7.13
4 Venezuela 7.05
5 New Zealand 6.58
6 Vietnam 6.34
7 Taiwan 6.28
8 Belgium 6.24
9 France 5.97
10 Hungary 5.92
11 Nepal 5.91
12 Portugal 5.86
13 Italy 5.77
14 Costa Rica 5.72
15 Canada 5.65
16 Qatar 5.61
17 Dominican Republic 5.52
18 Palestine 5.48
19 Greece 5.47
20 UAE 5.43

* Excluded are countries and territories with relatively few (under 10,000) Kaspersky product users.
** Unique users targeted by web-based Malware attacks as a percentage of all unique users of Kaspersky products in the country/territory.

On average during the quarter, 4.54% of users’ computers worldwide were subjected to at least one Malware web attack.

Local threats

Statistics on local infections of user computers are an important indicator. They include objects that penetrated the target computer by infecting files or removable media, or initially made their way onto the computer in non-open form. Examples of the latter are programs in complex installers and encrypted files.

Data in this section is based on analyzing statistics produced by anti-virus scans of files on the hard drive at the moment they were created or accessed, and the results of scanning removable storage media. The statistics are based on detection verdicts from the On-Access Scan (OAS) and On-Demand Scan (ODS) modules of File Anti-Virus and include detections of malicious programs located on user computers or removable media connected to the computers, such as flash drives, camera memory cards, phones, or external hard drives.

In Q2 2026, our File Anti-Virus detected 16,986,351 malicious and potentially unwanted objects.

Countries and territories where users faced the highest risk of local infection

For each country and territory, we calculated the percentage of Kaspersky users whose computers had the File Anti-Virus triggered at least once during the reporting period. These statistics reflect the level of personal computer infection in different countries.

Note that this ranked list includes only attacks by malicious objects classified as Malware. Our calculations leave out File Anti-Virus detections of potentially dangerous or unwanted programs, such as RiskTool or adware.

Country/territory* %**
1 Turkmenistan 46.38
2 Cuba 29.70
3 Tajikistan 28.46
4 Afghanistan 28.19
5 Yemen 27.85
6 Burundi 26.82
7 Mozambique 25.01
8 Republic of the Congo 24.88
9 Syria 23.17
10 Uzbekistan 22.49
11 China 21.92
12 Nicaragua 21.60
13 Cameroon 21.47
14 Bangladesh 20.43
15 Democratic Republic of the Congo 20.25
16 Algeria 19.78
17 Uganda 19.48
18 Ethiopia 18.57
19 Tanzania 18.54
20 Mali 18.53

* Excluded are countries and territories with relatively few (under 10,000) Kaspersky users.
** Unique users on whose computers Malware local threats were blocked, as a percentage of all unique users of Kaspersky products in the country/territory.

On average worldwide, Malware local threats were detected at least once on 10.93% of users’ computers during Q2.

Russia scored 10.78% in these rankings.

  • ✇Securelist
  • IT threat evolution in Q2 2026. Mobile statistics Anton Kivva
    IT threat evolution in Q2 2026. Mobile statistics IT threat evolution in Q2 2026. Non-mobile statistics The mobile section of the quarterly cyberthreat report includes statistics on malware, adware, and potentially unwanted software for Android, as well as descriptions of the most notable threats for Android and iOS discovered during the reporting period. These statistics are based on detection alerts from Kaspersky products, collected from users who consented to provide statistical data to Kasp
     

IT threat evolution in Q2 2026. Mobile statistics

10 de Agosto de 2026, 07:00

IT threat evolution in Q2 2026. Mobile statistics
IT threat evolution in Q2 2026. Non-mobile statistics

The mobile section of the quarterly cyberthreat report includes statistics on malware, adware, and potentially unwanted software for Android, as well as descriptions of the most notable threats for Android and iOS discovered during the reporting period. These statistics are based on detection alerts from Kaspersky products, collected from users who consented to provide statistical data to Kaspersky Security Network.

The quarter in figures

According to Kaspersky Security Network, in Q2 2026:

  • More than 1.99 million attacks on mobile devices utilizing malware, adware, or unwanted mobile software were blocked.
  • The Trojan-Banker category was the most prevalent mobile malware threat with a 30.77% share of total detected applications.
  • More than 304,000 malicious installation packages were discovered, including:
    • 93,574 packages were related to mobile banking Trojans;
    • 570 packages were related to mobile ransomware Trojans.

Quarterly highlights

Attacks on mobile devices involving malware, adware, or unwanted software continued their downward trend, falling to 1,996,823 in Q2 from 2,676,328 the previous quarter.

Attacks on users of Kaspersky mobile solutions, Q4 2024 — Q2 2026 (download)

We noted a downward trend in attacks driven by specific strains of pre-installed Trojans — a shift likely tied to the rollout of patched vendor firmware.

In Q2, our telemetry uncovered multiple malicious loaders hosted directly on Google Play. As highlighted in a prior report (link in Russian), one such instance involved a PDF reader app trojanized to drop the Anatsa banking malware. Upon execution, the app presented users with a fake request to install an update, which served as a front to stage the banking Trojan on the victim’s device.

Another notable case involves a loader we detected in the Cleanova app alongside several others. The malware sent requests to a command-and-control server containing telemetry gathered from various SDKs that track the installation source. A malicious payload was returned only for certain sources. This is a fairly interesting method for bypassing app store review processes while ensuring precise victim targeting. If an analytics SDK indicates that an arbitrary installation originated from a source outside the threat actors’ scope, the malicious logic remains dormant. This effectively hides the malware from app store scanners.

Mobile threat statistics

In Q2, the number of Android malware samples totaled 304,128. It remained steady compared to the previous reporting period.

Detected malicious and potentially unwanted installation packages, Q2 2025 — Q2 2026 (download)

The detected installation packages were distributed by type as follows:

Detected mobile apps by type, Q1 — Q2 2026* (download)

* Data for the previous quarter may differ slightly from previously published data due to certain verdicts being retrospectively revised.

While the number of newly discovered banking Trojan variants fell precipitously, they continued to dominate the threat landscape as they did in Q1. Notably, the share of Creduz malware family among identified banking samples has grown significantly despite low activity in victim telemetry. This discrepancy suggests the threat actors are actively iterating on the malware — likely testing new features or bypasses — by generating a high volume of builds before staging a broader campaign.

Share* of users attacked by the given type of malicious or potentially unwanted apps out of all targeted users of Kaspersky mobile products, Q1 — Q2 2026 (download)

* The total may exceed 100% if the same users experienced multiple attack types.

Within the adware category, the sharpest declines were observed in the HiddenAd and MobiDash families. Meanwhile, the proportion of users targeted by Trojan-Dropper malware increased, primarily driven by surges in banking droppers such as Trojan-Dropper.AndroidOS.Banker and Trojan-Dropper.AndroidOS.Mamont. The corresponding drop in the Trojan-Banker category is partially explained by a shift in tactics: several banking Trojans which are now being packed were subsequently reclassified as droppers.

TOP 20 most frequently detected types of mobile malware

Note that the malware rankings below exclude riskware or potentially unwanted software, such as RiskTool or adware.

Verdict %* Q1 2026 %* Q2 2026 Difference in p.p. Change in ranking
Backdoor.AndroidOS.Triada.ag 7.09 9.35 +2.25 0
DangerousObject.Multi.Generic. 5.84 5.65 -0.19 0
DangerousObject.AndroidOS.GenericML. 5.51 5.25 -0.26 0
Trojan.AndroidOS.Boogr.gsh 2.15 3.33 +1.18 +9
Backdoor.AndroidOS.Triada.z 3.08 3.23 +0.15 +3
Trojan-Banker.AndroidOS.Mamont.hl 1.10 2.48 +1.38 +22
Trojan.AndroidOS.Fakemoney.v 3.44 2.31 -1.13 -2
Trojan-Spy.AndroidOS.Btmob.e 0.00 2.27 +2.27
Trojan.AndroidOS.Triada.fe 2.98 2.18 -0.81 0
Trojan-Dropper.AndroidOS.Banker.dd 0.01 2.16 +2.15
Trojan.AndroidOS.Triada.hf 2.23 1.93 -0.29 +1
Backdoor.AndroidOS.Triada.ad 1.40 1.93 +0.53 +8
Backdoor.AndroidOS.Keenadu.a 2.73 1.88 -0.85 -3
Backdoor.AndroidOS.Triada.ab 1.72 1.79 +0.07 +2
Trojan-Banker.AndroidOS.Mamont.iv 1.03 1.63 +0.60 +16
Trojan.AndroidOS.Generic. 1.32 1.47 +0.15 +7
Backdoor.AndroidOS.Triada.ae 1.76 1.44 -0.31 -2
Trojan.AndroidOS.Fakemoney.ej 0.00 1.43 +1.43
Trojan.AndroidOS.Triada.ii 2.07 1.41 -0.66 -5
Trojan-Spy.AndroidOS.Agent.asa 0.02 1.38 +1.36

* Unique users who encountered this malware as a percentage of all attacked users of Kaspersky mobile solutions.

The distribution of top malware families in Q2 largely mirrors the rankings from the previous reporting period. Newer variants of the Mamont banking Trojan climbed the leaderboards, displacing older iterations. This shift points to ongoing, active development of new variants by the threat actors behind the malware.

Mobile banking Trojans

In Q2, the total volume of Trojan-Banker applications dropped sharply compared to the previous quarter, totaling 93,574 installation packages.

Number of installation packages for mobile banking Trojans detected by Kaspersky, Q2 2025 — Q2 2026 (download)

Against the backdrop of this trend, the distribution shifted heavily toward Creduz Trojans. However, as noted earlier, this shift was not reflected in real-world attack metrics: virtually the entire leaderboard by proportion of targeted users continues to be dominated by diverse Mamont variants.

TOP 10 mobile bankers

Verdict %* Q1 2026 %* Q2 2026 Difference in p.p. Change in ranking
Trojan-Banker.AndroidOS.Mamont.hl 3.27 11.13 +7.86 +6
Trojan-Banker.AndroidOS.Mamont.iv 3.08 7.33 +4.25 +6
Trojan-Banker.AndroidOS.Mamont.mv 0.00 5.12 +5.12
Trojan-Banker.AndroidOS.Agent.ws 3.78 4.99 +1.22 +2
Trojan-Banker.AndroidOS.Mamont.mg 0.35 4.71 +4.36 +62
Trojan-Banker.AndroidOS.Faketoken.pac 2.56 4.10 +1.54 +6
Trojan-Banker.AndroidOS.Mamont.jo 15.75 3.73 -12.02 -6
Trojan-Banker.AndroidOS.Mamont.mc 0.83 3.51 +2.67 +26
Trojan-Banker.AndroidOS.Mamont.lf 0.00 2.79 +2.79
Trojan-Banker.AndroidOS.Agent.eq 0.89 2.58 +1.69 +23

* Unique users who encountered this malware as a percentage of all users of Kaspersky mobile security solutions who encountered banking threats.

  • ✇Securelist
  • Threat landscape for industrial automation systems. Q1 2026 Kaspersky ICS CERT
    All threats The percentage of ICS computers on which malicious objects were blocked continued to decrease, reaching 19.6% in Q1 2026. This is the lowest value in three years, and it is 1.4 times lower than in Q2 2023. Percentage of ICS computers on which malicious objects were blocked, Q2 2023–Q1 2026 Regionally, the percentages ranged from 9.1% in Northern Europe to 27.4% in Africa. Regions ranked by percentage of attacked ICS computers The percentage of ICS computers on which malicious objects
     

Threat landscape for industrial automation systems. Q1 2026

7 de Julho de 2026, 07:00

All threats

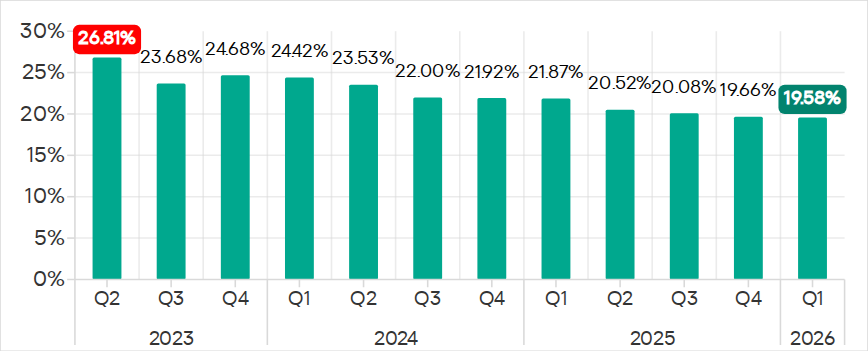
The percentage of ICS computers on which malicious objects were blocked continued to decrease, reaching 19.6% in Q1 2026. This is the lowest value in three years, and it is 1.4 times lower than in Q2 2023.

Percentage of ICS computers on which malicious objects were blocked, Q2 2023–Q1 2026

Percentage of ICS computers on which malicious objects were blocked, Q2 2023–Q1 2026

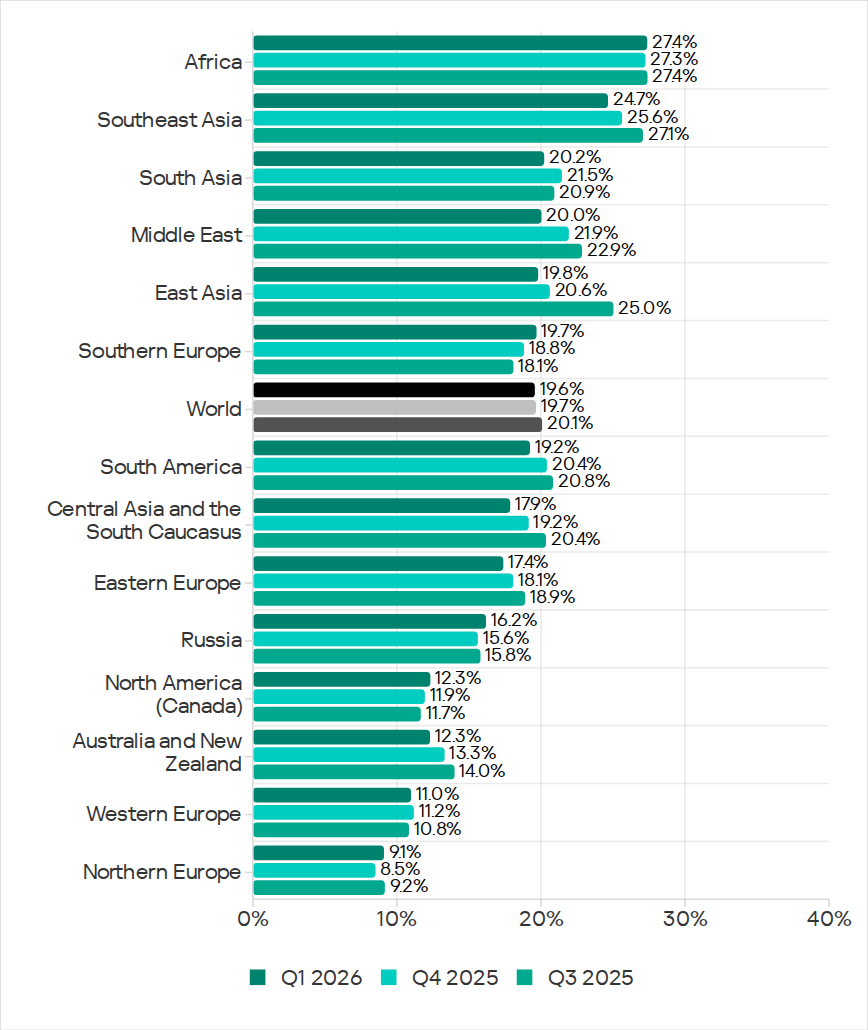
Regionally, the percentages ranged from 9.1% in Northern Europe to 27.4% in Africa.

Regions ranked by percentage of attacked ICS computers

Regions ranked by percentage of attacked ICS computers

The percentage of ICS computers on which malicious objects were blocked increased in five regions over the quarter, most notably in Southern Europe, Northern Europe, and Russia.

In Q1 2026, Southern Europe led the way in growth for internet and email threats. The region also saw the fastest growth in spyware, as well as malicious scripts and phishing pages.

In Russia, the percentage of ICS computers on which malicious objects were blocked exceeded the figures for the previous two quarters. Russia saw an increase in the percentage for threats from the internet, and a slight increase in the figure for threats from email clients (Russia is one of three regions where this figure did not decrease).

Among the threat categories, the greatest increases were observed in the percentages for denylisted internet resources, as well as spyware (distributed in the region via the internet and email clients).

Selected industries

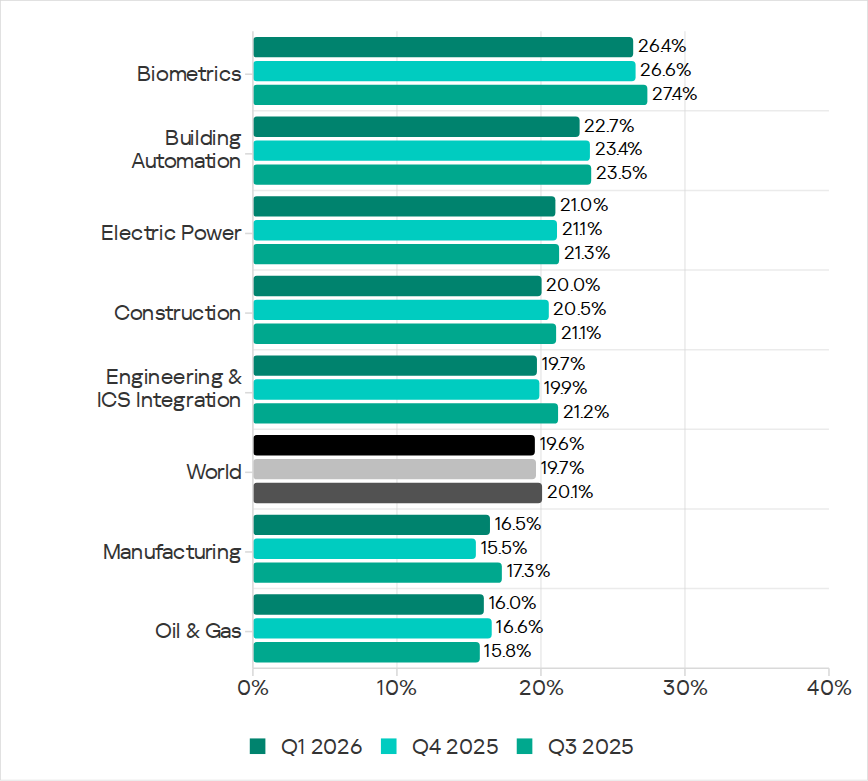
Biometric systems (26.4%) traditionally rank top among the industries and OT infrastructure types covered in this report in terms of the percentage of ICS computers on which malicious objects were blocked. These systems are characterized by internet access, extensive email use for data exchange and approvals (such as access granting), and, in many cases, minimal cybersecurity controls within the organizations that use these systems.

Industries ranked by the percentage of ICS computers on which malicious objects were blocked

Industries ranked by the percentage of ICS computers on which malicious objects were blocked

Biometric systems rank first among industries in terms of email threats. At the same time, unlike other industries, the percentage for email threats in biometric systems exceeds that for internet threats.

In all selected industries, the global average follows a downward trend. In Q1 2026, the percentage of ICS computers on which malicious objects were blocked increased only in the manufacturing sector — by 1.0 pp. The percentages for this industry increased across 10 regions, with the most notable increases in Western Europe, Northern Europe, and Russia.

Threat categories

In Q1 2026, Kaspersky security solutions blocked malware from 10,052 different malware families of various categories on industrial automation systems.

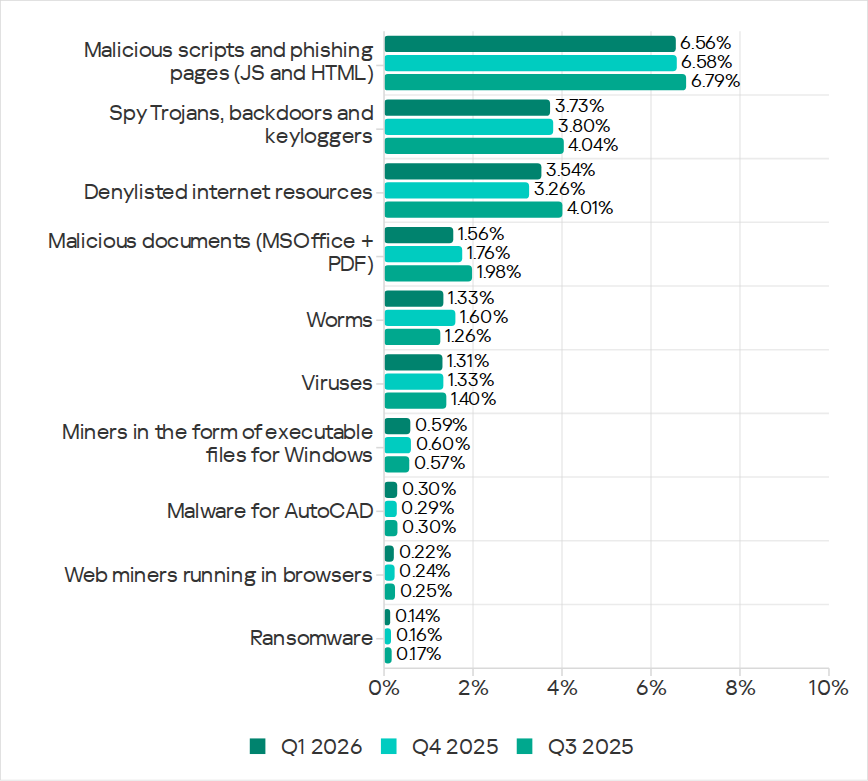
Over the quarter, the percentage of ICS computers on which denylisted internet resources were blocked increased (after decreasing over the previous two quarters), and there was a slight increase in the percentage for AutoCAD malware.

Percentage of ICS computers on which the activity of malicious objects from various categories was prevented

Percentage of ICS computers on which the activity of malicious objects from various categories was prevented

Malicious scripts and phishing pages (JS and HTML)

Malicious scripts and phishing pages retained their to spot among threat categories by the percentage of ICS computers on which these threats were blocked. The global average in Q1 2026 was 6.56%.

Over the quarter, the percentages increased in four regions. The most significant change was observed in Southern Europe (9.85%, +0.94 pp). The figures for malicious scripts in the region increased over three consecutive quarters.

Among the selected industries, across all regions, the highest percentages for the malicious scripts and phishing pages category were recorded for biometric systems (19.59%) and building automation (15.43%) in Southern Europe. These same industries lead in similar rankings for malicious documents and spyware.

Spyware

The percentage of ICS computers on which spyware was blocked decreased over two consecutive quarters, dropping to 3.73%. Despite the decline, spyware has ranked second among threat categories by the percentage of attacked computers for three consecutive quarters.

The percentages increased in five regions over the quarter, most notably in Southern Europe (5.46%, +0.35 pp) and Russia (2.84%, +0.24 pp).

In Southern Europe, the percentage of ICS computers on which spyware was blocked increased in all the selected industries except manufacturing. The greatest increase was observed in biometric systems.

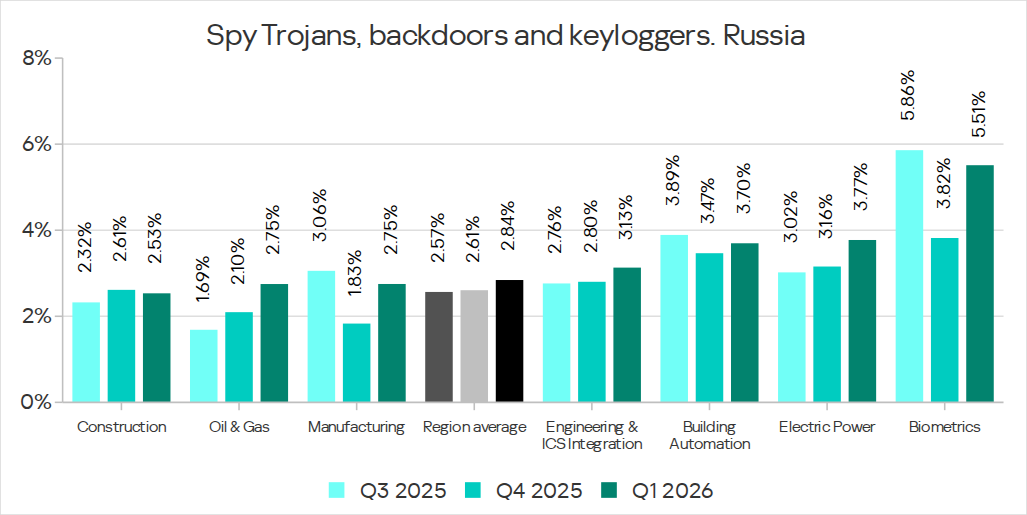
Among the selected industries, the highest percentage of spyware in Russia was recorded in biometric systems. That said, the percentage of ICS computers on which spyware was blocked increased in all industries in the region except construction. The percentage figure has been increasing for two consecutive quarters in the oil and gas industry (by a factor of 1.63 over six months), and for three consecutive quarters in engineering and ICS integration, as well as electric power. In the remaining sectors, the values have been fluctuating.

Percentage of ICS computers on which spyware was blocked in various industries in Russia, Q3 2025–Q1 2026

Percentage of ICS computers on which spyware was blocked in various industries in Russia, Q3 2025–Q1 2026

Denylisted internet resources

The percentage of ICS computers on which denylisted internet resources were blocked increased to 3.54%.

The most notable increase over the quarter occurred in Southeast Asia (4.58%, +0.65 pp). Among the industries in the region, the highest percentage figures for this threat category were recorded in electric power and construction. Over the quarter, the largest increases in percentages figures were observed in the electric power and manufacturing industries.

In North America (Canada), denylisted internet resources (2.14%) showed the greatest increase among all categories — by a factor of 1.22.

Among the selected industries across all regions, the highest percentage figures for the denylisted internet resources category were in the electric power (7.11%) and construction (6.25%) industries in Southeast Asia.

Malicious documents (Microsoft Office + PDF)

The percentage figure for this category decreased over two consecutive quarters, reaching its lowest value (1.56%) for the entire period of observations in Q1 2026. It increased just in two regions: Australia and New Zealand (1.12%, +0.04 pp), and Russia (0.62%, +0.01 pp).

Among the selected industries across all regions, the highest percentages for malicious documents were recorded for biometric systems (9.02%) and building automation (6.97%) in Southern Europe. These same industries also lead in similar rankings for malicious scripts and spyware.

Ransomware

The percentage of ICS computers on which ransomware was blocked has decreased for two consecutive quarters, dropping to 0.14%. This is the lowest value among all categories.

The percentage increased in two regions: North America (Canada) (0.11%, +0.04 pp) and slightly in Northern Europe (0.06%, +0.01 pp).

Among the selected industries across all regions, the highest percentages for ransomware were recorded in the oil and gas and manufacturing industries (0.92% and 0.65%, respectively) in Central Asia and the South Caucasus, and in biometric systems (0.89%) in Russia.

Miners in the form of executable files for Windows

The percentage of ICS computers on which miners in the form of executable files for Windows were blocked decreased to 0.59%.

The percentage increased in seven regions. The largest increase was observed in Africa (0.63%, +0.16 pp). Among the selected industries, the largest increases in the region were in the manufacturing and oil and gas industries.

Among the selected industries across all regions, the highest percentages for miners in the form of executable files were recorded in construction (1.99%), biometric systems (1.98%), and the oil and gas industry (1.97%) in Central Asia and the South Caucasus.

Web miners

The percentage of ICS computers on which web miners were blocked has been declining for a year, and in Q1 2026, it reached the lowest value for the entire period under review (0.22%).

At the same time, the percentage increased in seven regions. The largest increases were observed in South Asia (0.28%, +0.11 pp), the Middle East (0.31%, +0.09 pp), and Africa (0.34%, +0.08 pp). Despite the increases, the percentages in these regions for Q1 2026 did not exceed those observed in 2023–2024 and in Q1 2025.

Among the selected industries across all regions, the highest percentages for web miners were recorded for biometric systems (0.97%) in Russia. Biometric systems in South Asia (0.79%) ranked second, and the electric power sector in Southeast Asia (0.76%) ranked third.

Worms

The percentage of ICS computers on which worms were blocked decreased to 1.33%.

The percentage decreased across all regions following an increase in the previous quarter (due to a wave of phishing attacks that distributed the Backdoor.MSIL.XWorm backdoor worm across all regions of the world).

Among the selected industries across all regions, the highest percentage figure for worms was recorded for biometric systems (4.80%) in Central Asia and the South Caucasus. Two industries in Africa – biometric systems (4.04%) and electric power (3.53%) – took the second and third spots, respectively.

Viruses

The percentage of ICS computers on which viruses were blocked decreased to 1.31%.

The top 3 regions by this figure remained the same: Southeast Asia (6.11%, first by a wide margin), Africa (4.15%), and East Asia (2.97%). These same regions are also among the leaders by the percentage of systems affected by AutoCAD malware. The largest increase in this figure was observed in Africa (+0.41 pp).

Among the selected industries across all regions, the highest percentages for viruses were recorded in the construction industry (6.35%) and building automation (5.50%) in Southeast Asia.

Malware for AutoCAD

The percentage of ICS computers on which malware for AutoCAD was blocked increased to 0.30%.

The most notable increase over the quarter was observed in Africa, with the region’s percentage figure rising by 0.47 pp, a very significant increase for this category, and almost doubling (to 0.91%).

Among the selected industries across all regions, the highest percentages for AutoCAD malware were recorded in the construction industry in East Asia (5.58%) and Southeast Asia (3.87%).

Main threat sources

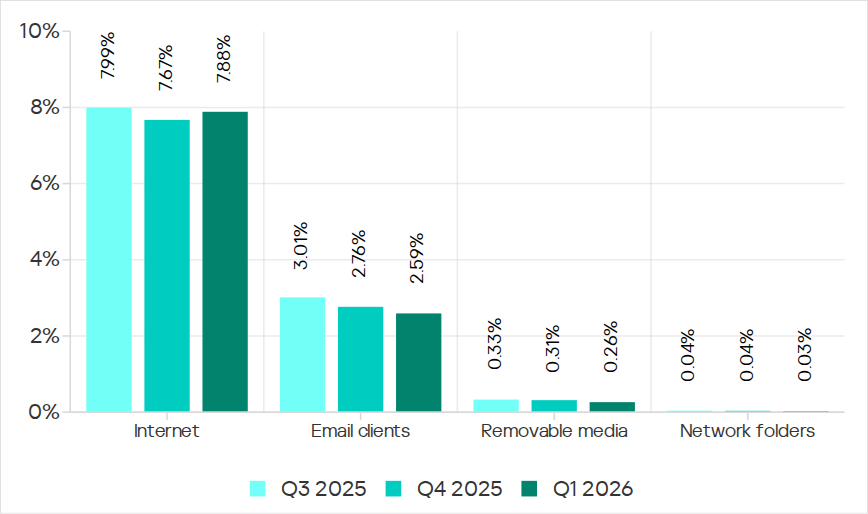
In Q1 2026, the average percentages across all threat sources, except threats from the internet, decreased globally.

Percentage of ICS computers on which malicious objects from various sources were blocked

Percentage of ICS computers on which malicious objects from various sources were blocked

Internet

The percentage of ICS computers on which threats from the internet were blocked increased to 7.88%. However, over the past three years, the percentage figure for internet threats has followed a downward trend.

The largest increases in the percentages were recorded in Southern Europe (8.59%, +0.59 pp), Southeast Asia (10.16%, +0.55 pp), and Northern Europe (4.47%, +0.51 pp).

Among the selected industries across all regions, the highest percentages for threats from the internet were recorded in electric power (13.16%) and construction (12.55%) in Southeast Asia, and in the engineering and ICS integration sector (12.33%) in South Asia.

Email clients

The percentage of ICS computers on which threats delivered via email clients were blocked decreased to 2.59%. This is a three-year low.

The percentage of this threat source increased in three regions: Southern Europe (6.54%, +0.2 pp), East Asia (1.5%, +0.09 pp), and slightly in Russia (0.7%, +0.04 pp).

Among the selected industries across all regions, the highest percentages for email threats were recorded for biometric systems (19.78%) and building automation (12.34%) in Southern Europe. In these two industries, the percentage of ICS computers on which email threats are blocked is higher than the percentage for threats from the internet. A similar situation was observed in two other instances, both in biometric systems (in South America and Southeast Asia).

Removable media

The percentage of ICS computers on which threats were detected when connecting removable media continued to decrease, reaching its lowest value for the period under review (0.26%).

Among the selected industries across all regions, the highest percentages for removable media threats blocked on ICS computers were observed in the electric power sector in Central Asia and the South Caucasus (1.45%), East Asia (1.34%), and Africa (1.16%).

Network folders

The percentage of ICS computers on which threats are blocked in network folders is steadily decreasing. In Q1 2026, it was the lowest for the period under review (0.029%).

East Asia has traditionally led by a wide margin. The percentage for East Asia (0.135%) is 27 times higher than the lowest regional value (recorded in Northern Europe).

The largest increases in the percentages for threats from network folders were observed in Africa (0.037%, +0.006 pp) and South America (0.013%, +0.006 pp).
Among the selected industries across all regions, the construction industry in East Asia, at 0.36%, holds the top positions in the ranking by the percentage of ICS computers on which threats are blocked in network folders.

For more information on industrial threats see the full version of the report.
  • ✇Securelist
  • OpenClaw: risks for the users and how to mitigate them Kaspersky
    OpenClaw, which was previously known as Clawdbot and Moltbot, is today one of the most successful and fast‑growing ecosystems for AI agents, recognized worldwide. The project quickly became popular with users because of its flexibility and ability to solve fairly complex tasks that previously required a lot of time for automation and execution. A dedicated marketplace appeared quickly after the project started gaining traction, where developers and users began publishing tools that integrate wit
     

OpenClaw: risks for the users and how to mitigate them

1 de Julho de 2026, 03:42

OpenClaw, which was previously known as Clawdbot and Moltbot, is today one of the most successful and fast‑growing ecosystems for AI agents, recognized worldwide. The project quickly became popular with users because of its flexibility and ability to solve fairly complex tasks that previously required a lot of time for automation and execution. A dedicated marketplace appeared quickly after the project started gaining traction, where developers and users began publishing tools that integrate with OpenClaw. Currently, employees all over the world use OpenClaw to automate their tasks, often unaware of risks this practice introduces to them and their employers.

In this article we will examine several security aspects of OpenClaw, look at how attackers can target this system, which vulnerabilities are already known, and how to protect your organization against these issues.

OpenClaw skills

The project’s success was ensured by the fact that the agent accepts natural language instructions, does not require knowledge of programming languages, and allows the use of skills, which expand its capabilities. The overall architecture of OpenClaw can be seen below:

The OpenClaw overall architecture

The OpenClaw overall architecture

As shown in the diagram, the system is designed to be used with agent skills. These skills can reside locally on the system where the agent is installed or they can be obtained from external sources. At the time of writing this article, a dedicated hub named “ClawHub” is used for sharing skills with other users.

One of the key features of OpenClaw skills is that they are easy to create and do not require coding. A skill is in essence a set of commands written in natural language, although it can contain code. Currently, there is a general description of the skill format: it is usually a text file named SKILL.md, although more complex variants may exist. The primary requirement for these files is that they use a plaintext format. To illustrate what this looks like, here is a fragment of a skill:

Openclaw skill example

Openclaw skill example

The applications for OpenClaw skills are quite broad and can include everyday tasks like checking email, performing routine operations and calculations on a computer, as well as more complex pipelines that handle testing, research, or software development. For most actions, the agent requires access to the operating system’s file system, as well as to the tokens and keys of the systems it will interact with. All necessary data are usually provided by users either through environment variables or in plaintext files located alongside the agent.

Since many skills enable automation of work processes, employees worldwide actively use them. This fact, combined with the widespread adoption of the system and the overall popularity of artificial‑intelligence technologies, has attracted attackers to the project.

OpenClaw vulnerabilities

In less than two years, around 530 vulnerabilities have been discovered both in OpenClaw itself and in the underlying technologies. That said, the publication of OpenClaw vulnerabilities in the CVE database began only in February 2026. Below is a breakdown of these vulnerabilities by severity.

Registered vulnerabilities (download)

As shown in the chart, the number of high-severity vulnerabilities is quite large. Most of these vulnerabilities fundamentally involve issues with storing sensitive data and operating with excessively high privileges. Each of them can be exploited to hijack the agent or inject commands that it will execute.

Malicious skills

Besides exploiting vulnerabilities and deceiving users, there are more specific attack vectors against OpenClaw, namely, skills.

Research logically draws a parallel between supply‑chain attacks and the distribution of malicious skills. However, unlike usual supply-chain attacks, creating malicious skills is trivial because there is no longer a need to develop custom malware. Despite this, until February 7, 2026, no skills had undergone even a basic security check, which allowed malicious skills to appear immediately. Our scan of the skill hub in April identified 24 accounts that were distributing more than 600 malicious skills. Overall, open‑source intelligence indicates that over 1100 malicious accounts have been created since January.

Following the investigations and a lengthy effort to clean the skill repository of malicious entries, it was announced that files would undergo preliminary scanning with VirusTotal (VT) and NVIDIA’s SkillSpector. On the one hand, this is a more responsible approach to publishing skills; on the other, because OpenClaw is primarily an agent that executes a set of instructions, detecting malicious activity moves to a different level. Now it is necessary not only to analyze a file for dangerous commands that should be blocked, but also to examine all possible malicious behaviors that could be triggered by a harmful instruction within a skill. An example of a malicious command in natural language:

Example of a malicious command within a skill action

Example of a malicious command within a skill action

An example of a malicious command using a part of a bash command:

Malicious command inside a skill

Malicious command inside a skill

The example in the image and similar malicious skills are detected by Kaspersky products as HEUR:Trojan.ANSI.MalClaw.gen.

In addition, Kaspersky products monitor malicious OpenClaw skill activity on the system. Below are detection statistics from our systems that have identified malicious OpenClaw client behavior. The data for June cover the first half of the month.

Statistics on Kaspersky product detections of OpenClaw malware (download)

As shown in the chart, even despite the measures taken to counter the publication of malicious skills, attacks continue. Therefore, it is important to employ layered protection that isolates the OpenClaw agent from critical data and infrastructure systems. We also recommend checking all skills that enter the organization’s perimeter. For this purpose, Kaspersky Scan Engine is suitable. This solution is designed to protect web applications, proxy servers, network attached storage, and mail gateways. It can be integrated into almost any application, and it is easy to deploy and manage.

Malicious skill detected by Scan Engine

Malicious skill detected by Scan Engine

Additionally, monitor network accesses used by the agent. For this purpose, the project already provides a sandboxing subsystem and various wrappers for working with APIs and services. Last but not least, develop a comprehensive AI policy and make sure your employees never use third-party tools that they are not explicitly allowed to use.

  • ✇Securelist
  • IT threat evolution in Q1 2026. Mobile statistics Anton Kivva
    IT threat evolution in Q1 2026. Mobile statistics IT threat evolution in Q1 2026. Non-mobile statistics In the third quarter of 2025, we updated the methodology for calculating statistical indicators based on the Kaspersky Security Network. These changes affected all sections of the report except for the statistics on installation packages, which remained unchanged. To illustrate the differences between the reporting periods, we have also recalculated data for the previous quarters. Consequently
     

IT threat evolution in Q1 2026. Mobile statistics

18 de Maio de 2026, 09:00

IT threat evolution in Q1 2026. Mobile statistics
IT threat evolution in Q1 2026. Non-mobile statistics

In the third quarter of 2025, we updated the methodology for calculating statistical indicators based on the Kaspersky Security Network. These changes affected all sections of the report except for the statistics on installation packages, which remained unchanged.

To illustrate the differences between the reporting periods, we have also recalculated data for the previous quarters. Consequently, these figures may significantly differ from the previously published ones. However, subsequent reports will employ this new methodology, enabling precise comparisons with the data presented in this post.

The Kaspersky Security Network (KSN) is a global network for analyzing anonymized threat information, voluntarily shared by users of Kaspersky solutions. The statistics in this report are based on KSN data unless explicitly stated otherwise.

The quarter in numbers

According to Kaspersky Security Network, in Q1 2026:

  • More than 2.67 million attacks utilizing malware, adware, or unwanted mobile software were prevented.
  • The Trojan-Banker category was the prevalent mobile malware threat with a 52.96% share of total detected applications.
  • More than 306,000 malicious installation packages were discovered, including:
    • 162,275 packages related to mobile banking Trojans;
    • 439 packages related to mobile ransomware Trojans.

Quarterly highlights

The number of malware, adware, or unwanted software attacks on mobile devices decreased to 2,676,328 in Q1, down from 3,239,244 in the previous quarter.

Attacks on users of Kaspersky mobile solutions, Q3 2024 — Q1 2026 (download)

The overall drop in attack volume stems primarily from a reduction in adware and RiskTool detections. Nonetheless, this trend does not equate to a lower risk for mobile users. As shown later in this report, the number of unique users targeted by these threats remained relatively stable.

In Q1, Synthient researchers identified a link between the notorious Kimwolf botnet and the IPIDEA proxy network. This network was later taken down in cooperation with GTIG.

In early 2026, we discovered several apps on Google Play and the App Store that contained a new version of the SparkCat crypto stealer.

The Trojan code, meticulously concealed, was embedded into the infected Android apps. The obfuscated malicious Rust library was decrypted using a Dalvik-like virtual machine custom-built by the attackers. The iOS version of the malware also underwent several changes; specifically, the attackers began leveraging Apple’s proprietary Vision framework for optical character recognition (OCR).

Mobile threat statistics

The number of Android malware samples saw a slight increase compared to Q4 2025, reaching a total of 306,070.

Detected malicious and potentially unwanted installation packages, Q1 2025 — Q1 2026 (download)

The detected installation packages were distributed by type as follows:

Detected mobile apps by type, Q4 2025* — Q1 2026 (download)

* Data for the previous quarter may differ slightly from previously published figures due to certain verdicts being retrospectively revised.

Threat actors once again ramped up the production of new banking Trojans; as a result, this category overtook all others in volume, accounting for more than half of all installation packages.

Share* of users attacked by the given type of malicious or potentially unwanted app out of all targeted users of Kaspersky mobile products, Q4 2025 — Q1 2026 (download)

* The total percentage may exceed 100% if the same users encountered multiple attack types.

Following the surge in banking Trojan installation packages, the number of associated attacks also rose, causing Trojan-Banker apps to climb one spot in terms of their share of targeted users. Mamont variants emerged as the most prevalent banking Trojans, accounting for 73.5% of detections, with the rest of the users encountering Faketoken, Rewardsteal, Creduz, and other families.

Yet banking Trojans were still outpaced by adware and RiskTool-type unwanted apps when measured by the total number of affected users. Despite a decrease in their share of installation packages, these two app types retained their positions as the top two threats by attack volume. The most common adware detections involved HiddenAd (44.9%) and MobiDash (38.1%), while most frequently seen RiskTool apps were Revpn (67%) and SpyLoan (20.5%).

TOP 20 most frequently detected types of mobile malware

Note that the malware rankings below exclude riskware or potentially unwanted software, such as RiskTool or adware.

Verdict %* Q4 2025 %* Q1 2026 Difference in p.p. Change in ranking
Backdoor.AndroidOS.Triada.ag 2.62 7.09 +4.48 +10
DangerousObject.Multi.Generic. 6.75 5.84 -0.92 -1
DangerousObject.AndroidOS.GenericML. 3.52 5.51 +1.99 +6
Trojan-Banker.AndroidOS.Mamont.jo 0.00 5.28 +5.28
Trojan.AndroidOS.Fakemoney.v 5.40 3.44 -1.96 -1
Trojan-Downloader.AndroidOS.Keenadu.l 0.00 3.35 +3.35
Trojan-Banker.AndroidOS.Mamont.jx 0.00 3.09 +3.09
Backdoor.AndroidOS.Triada.z 4.87 3.08 -1.79 -2
Trojan.AndroidOS.Triada.fe 5.01 2.98 -2.02 -4
Backdoor.AndroidOS.Keenadu.a 2.07 2.73 +0.66 +6
Trojan-Banker.AndroidOS.Mamont.jg 0.34 2.37 +2.03
Trojan.AndroidOS.Triada.hf 2.15 2.23 +0.07 +3
Trojan.AndroidOS.Boogr.gsh 2.35 2.15 -0.20 0
Trojan.AndroidOS.Triada.ii 5.68 2.07 -3.60 -11
Backdoor.AndroidOS.Triada.ae 1.91 1.76 -0.16 +3
Backdoor.AndroidOS.Triada.ab 1.79 1.72 -0.08 +3
Trojan.AndroidOS.Triada.gn 2.38 1.58 -0.80 -5
Trojan-Banker.AndroidOS.Mamont.gg 1.56 1.50 -0.06 +2
Trojan.AndroidOS.Triada.ga 1.48 1.50 +0.01 +4
Backdoor.AndroidOS.Triada.ad 0.53 1.40 +0.87 +44

* Unique users who encountered this malware as a percentage of all attacked users of Kaspersky mobile solutions.

The pre-installed Triada.ag backdoor rose to the top spot; it is similar to the older Triada.z version we documented previously. Because the same variant was pre-installed across a wide range of devices, the total number of affected users is aggregated. Consequently, Triada outpaced even Mamont, as users encountered a variety of Mamont variants, causing the share of that banking Trojan to spread across multiple rows. Other pre-installed Triada variants (Triada.z, Triada.ae, Triada.ab, and Triada.ad) also made the rankings. Furthermore, we observed increasing activity from the Keenadu.a backdoor, while diverse variants of the embedded Triada Trojan remained in the rankings.

Mobile banking Trojans

Q1 2026 saw a characteristic rise in mobile banking Trojan activity, with the number of packages totaling 162,275, a 50% increase compared to the prior quarter.

Number of installation packages for mobile banking Trojans detected by Kaspersky, Q1 2025 — Q1 2026 (download)

We saw a similar growth in the previous quarter, with banking Trojan volumes rising by 50% during that period as well. Various Mamont variants accounted for the absolute majority of packages and represented nearly every entry in the rankings of most frequent banking Trojans by affected user count.

TOP 10 mobile bankers

Verdict %* Q4 2025 %* Q1 2026 Difference in p.p. Change in ranking
Trojan-Banker.AndroidOS.Mamont.jo 0.00 15.75 +15.75
Trojan-Banker.AndroidOS.Mamont.jx 0.00 9.22 +9.22
Trojan-Banker.AndroidOS.Mamont.jg 1.47 7.08 +5.61 +24
Trojan-Banker.AndroidOS.Mamont.gg 6.79 4.48 -2.32 -3
Trojan-Banker.AndroidOS.Mamont.ks 0.00 3.98 +3.98
Trojan-Banker.AndroidOS.Agent.ws 6.03 3.78 -2.25 -2
Trojan-Banker.AndroidOS.Mamont.hl 4.30 3.27 -1.03 +1
Trojan-Banker.AndroidOS.Mamont.iv 6.00 3.08 -2.92 -3
Trojan-Banker.AndroidOS.Mamont.jb 3.93 3.07 -0.86 +1
Trojan-Banker.AndroidOS.Mamont.jv 0.00 2.79 +2.79

* Unique users who encountered this malware as a percentage of all users of Kaspersky mobile security solutions who encountered banking threats.

  • ✇Securelist
  • IT threat evolution in Q1 2026. Non-mobile statistics AMR
    IT threat evolution in Q1 2026. Non-mobile statistics IT threat evolution in Q1 2026. Mobile statistics The statistics in this report are based on detection verdicts returned by Kaspersky products unless otherwise stated. The information was provided by Kaspersky users who consented to sharing statistical data. Quarterly figures In Q1 2026: Kaspersky products blocked more than 343 million attacks that originated with various online resources. Web Anti-Virus responded to 50 million unique links.
     

IT threat evolution in Q1 2026. Non-mobile statistics

Por:AMR
18 de Maio de 2026, 09:00

IT threat evolution in Q1 2026. Non-mobile statistics
IT threat evolution in Q1 2026. Mobile statistics

The statistics in this report are based on detection verdicts returned by Kaspersky products unless otherwise stated. The information was provided by Kaspersky users who consented to sharing statistical data.

Quarterly figures

In Q1 2026:

  • Kaspersky products blocked more than 343 million attacks that originated with various online resources.
  • Web Anti-Virus responded to 50 million unique links.
  • File Anti-Virus blocked nearly 15 million malicious and potentially unwanted objects.
  • 2938 new ransomware variants were detected.
  • More than 77,000 users experienced ransomware attacks.
  • 14% of all ransomware victims whose data was published on threat actors’ data leak sites (DLS) were victims of Clop.
  • More than 260,000 users were targeted by miners.

Ransomware

Quarterly trends and highlights

Law enforcement success

In January 2026, it was reported that the FBI had seized the domains of the RAMP cybercrime forum, a major platform used extensively by ransomware developers to advertise their RaaS programs and to recruit affiliates. There has been no official statement from the FBI, nor is it clear if RAMP servers were seized. In a post on an external website, a RAMP moderator mentioned law enforcement agencies gaining control over the forum. The takedown disrupted a key element of the RaaS ecosystem, creating ripple effects for ransomware operators, affiliates, and initial access brokers.

A man suspected of links to the Phobos group was apprehended in Poland. He was charged with the creation, acquisition, and distribution of software designed for unlawfully obtaining information, including data that facilitates unauthorized access to information stored within a computer system.

In March, a Phobos ransomware administrator pleaded guilty to the creation and distribution of the Trojan, which had been used in international attacks dating back to at least November 2020.

In March, the U.S. Department of Justice charged a man who had acted as a negotiator for ransomware groups. The company he worked for specializes in cyberincident investigations. The prosecution alleges the suspect colluded with the BlackCat threat actor to share privileged insights into the ongoing progress of negotiations. Additionally, the suspect is alleged to have had a prior direct role in BlackCat attacks, serving as an affiliate for the RaaS operation.

In a separate development this March, a U.S. court sentenced an initial access broker associated with the Yanluowang ransomware group to 81 months of imprisonment. According to the U.S. Department of Justice, the convict facilitated dozens of ransomware attacks across the United States, resulting in over $9 million in actual loss and more than $24 million in intended loss.

Vulnerabilities and attacks

The Interlock group has been heavily exploiting the CVE-2026-20131 zero-day vulnerability in Cisco Secure FMC firewall management software since at least January 26, 2026. The vulnerability enabled arbitrary Java code execution with root privileges on the affected device. This campaign demonstrates the ongoing reliance on zero-day vulnerabilities for initial access, a focus on network appliances as high-value entry points, and the rapid weaponization of new vulnerabilities within the ransomware ecosystem.

The most prolific groups

This section highlights the most prolific ransomware gangs by number of victims added to each group’s DLS. This quarter, the Clop ransomware (14.42%) returned to the top of the rankings, displacing Qilin (12.34%), which had held the leading position in the previous reporting period. Following closely is a new threat actor, The Gentlemen (9.25%). Emerging no later than July 2025, the group had already surpassed the activity levels of mainstays such as Akira (7.25%) and INC Ransom (6.13%).

Number of each group’s victims according to its DLS as a percentage of all groups’ victims published on all the DLSs under review during the reporting period (download)

Number of new variants

In Q1 2026, Kaspersky solutions detected six new ransomware families and 2938 new modifications. Volumes have returned to Q3 2025 levels following a surge in Q4 2025.

Number of new ransomware modifications, Q1 2025 — Q1 2026 (download)

Number of users attacked by ransomware Trojans

Throughout Q1, our solutions protected 77,319 unique users from ransomware. Ransomware activity was highest in March, with 35,056 unique users encountering such attacks during the month.

Number of unique users attacked by ransomware Trojans, Q1 2026 (download)

Attack geography

TOP 10 countries and territories attacked by ransomware Trojans

Country/territory* %**
1 Pakistan 0.79
2 South Korea 0.64
3 China 0.52
4 Tajikistan 0.40
5 Libya 0.38
6 Turkmenistan 0.36
7 Iraq 0.35
8 Bangladesh 0.33
9 Rwanda 0.30
10 Cameroon 0.28

* Excluded are countries and territories with relatively few (under 50,000) Kaspersky users.
** Unique users whose computers were attacked by ransomware Trojans as a percentage of all unique users of Kaspersky products in the country/territory.

TOP 10 most common families of ransomware Trojans

Name Verdict %*
1 (generic verdict) Trojan-Ransom.Win32.Gen 33.90
2 (generic verdict) Trojan-Ransom.Win32.Crypren 6.38
3 WannaCry Trojan-Ransom.Win32.Wanna 5.87
4 (generic verdict) Trojan-Ransom.Win32.Encoder 4.68
5 (generic verdict) Trojan-Ransom.Win32.Agent 3.80
6 LockBit Trojan-Ransom.Win32.Lockbit 2.80
7 (generic verdict) Trojan-Ransom.Win32.Phny 1.99
8 (generic verdict) Trojan-Ransom.MSIL.Agent 1.96
9 (generic verdict) Trojan-Ransom.Python.Agent 1.93
10 (generic verdict) Trojan-Ransom.Win32.Crypmod 1.89

* Unique Kaspersky users attacked by the specific ransomware Trojan family as a percentage of all unique users attacked by this type of threat.

Miners

Number of new variants

In Q1 2026, Kaspersky solutions detected 3485 new modifications of miners.

Number of new miner modifications, Q1 2026 (download)

Number of users attacked by miners

In Q1, we detected attacks using miner programs on the computers of 260,588 unique Kaspersky users worldwide.

Number of unique users attacked by miners, Q1 2026 (download)

Attack geography

TOP 10 countries and territories attacked by miners

Country/territory* %**
1 Senegal 3.19
2 Turkmenistan 3.06
3 Mali 2.63
4 Tanzania 1.62
5 Bangladesh 1.06
6 Ethiopia 0.95
7 Panama 0.88
8 Afghanistan 0.79
9 Kazakhstan 0.77
10 Bolivia 0.75

* Excluded are countries and territories with relatively few (under 50,000) Kaspersky users.
** Unique users whose computers were attacked by miners as a percentage of all unique users of Kaspersky products in the country/territory.

Attacks on macOS

In Q1 2026, Google uncovered a new cryptocurrency theft campaign. The scammers directed victims to a fraudulent video call, prompting them to execute malicious scripts under the guise of technical support fixes for connection problems.

In March, researchers with GTIG and iVerify reported the discovery of an in-the-wild exploit chain targeting both iOS and macOS devices. The exploit kit was apparently marketed on the dark web, providing threat actors with a suite of spyware capabilities alongside specialized cryptocurrency exfiltration modules. The exploit was delivered via drive-by downloads when victims visited various compromised websites. Our analysis confirmed that the toolkit included an updated version of a component previously identified in the Operation Triangulation attack chain.

Devices running macOS were similarly impacted by the high-profile supply chain attack targeting the Axios npm package, a widely used HTTP client for JavaScript. The installation of the infected package led to the deployment of a backdoor on macOS devices.

TOP 20 threats to macOS

Unique users* who encountered this malware as a percentage of all attacked users of Kaspersky security solutions for macOS (download)

* Data for the previous quarter may differ slightly from previously published data due to some verdicts being retrospectively revised.

The share of PasivRobber spyware attacks is beginning to decline, giving way to more traditional adware and Monitor-class software capable of tracking user activity. The popular Amos stealer also maintains its presence within the TOP 20.

Geography of threats to macOS

TOP 10 countries and territories by share of attacked users

Country/territory %* Q4 2025 %* Q1 2026
China 1.28 1.97
France 1.18 1.07
Brazil 1.13 0.98
Mexico 0.72 0.52
Germany 0.71 0.45
The Netherlands 0.62 0.75
Hong Kong 0.49 0.53
India 0.42 0.48
Russian Federation 0.34 0.37
Thailand 0.24 0.27

* Unique users who encountered threats to macOS as a percentage of all unique Kaspersky users in the country/territory.

IoT threat statistics

This section presents statistics on attacks targeting Kaspersky IoT honeypots. The geographic data on attack sources is based on the IP addresses of attacking devices.

In Q1 2026, the share of devices attacking Kaspersky honeypots via the SSH protocol saw a significant increase compared to the previous reporting period.

Distribution of attacked services by number of unique IP addresses of attacking devices (download)

The distribution of attacks between Telnet and SSH maintained the ratio observed in Q4 2025.

Distribution of attackers’ sessions in Kaspersky honeypots (download)

TOP 10 threats delivered to IoT devices

Share of each threat delivered to an infected device as a result of a successful attack, out of the total number of threats delivered (download)

The primary shifts in the IoT threat distribution are linked to the activity of various Mirai botnet variants, although members of this family continue to account for the majority of the list. Furthermore, a new variant, Mirai.kl, surfaced in the rankings. We also observed a significant decline in NyaDrop botnet activity during Q1.

Attacks on IoT honeypots

The United States, the Netherlands, and Germany accounted for the highest proportions of SSH-based attacks during this period.

Country/territory Q4 2025 Q1 2026
United States 16.10% 23.74%
The Netherlands 15.78% 17.57%
Germany 12.07% 10.34%
Panama 7.72% 6.34%
India 5.32% 6.05%
Romania 4.05% 5.82%
Australia 1.62% 4.61%
Vietnam 4.21% 3.50%
Russian Federation 3.79% 2.35%
Sweden 2.25% 2.09%

China continues to account for the largest proportion of Telnet attacks, though there was a marked increase in activity originating from Pakistan.

Country/territory Q4 2025 Q1 2026
China 53.64% 39.54%
Pakistan 14.27% 27.31%
Russian Federation 8.20% 8.25%
Indonesia 8.58% 6.71%
India 4.85% 4.66%
Brazil 0.06% 3.30%
Argentina 0.02% 2.51%
Nigeria 1.22% 1.38%
Thailand 0.01% 0.55%
Sweden 0.54% 0.55%

Attacks via web resources

The statistics in this section are based on detection verdicts by Web Anti-Virus, which protects users when suspicious objects are downloaded from malicious or infected web pages. These malicious pages are purposefully created by cybercriminals. Websites that host user-generated content, such as message boards, as well as compromised legitimate sites, can become infected.

TOP 10 countries and territories that served as sources of web-based attacks

The following statistics show the distribution by country/territory of the sources of internet attacks blocked by Kaspersky products on user computers (web pages redirecting to exploits, sites containing exploits and other malicious programs, botnet C&C centers, and so on). One or more web-based attacks could originate from each unique host.

To determine the geographic source of web attacks, we matched the domain name with the real IP address where the domain is hosted, then identified the geographic location of that IP address (GeoIP).

In Q1 2026, Kaspersky solutions blocked 343,823,407 attacks launched from internet resources worldwide. Web Anti-Virus was triggered by 49,983,611 unique URLs.

Web-based attacks by country/territory, Q1 2026 (download)

Countries and territories where users faced the greatest risk of online infection

To assess the risk of malware infection via the internet for users’ computers in different countries and territories, we calculated the share of Kaspersky users in each location on whose computers Web Anti-Virus was triggered during the reporting period. The resulting data provides an indication of the aggressiveness of the environment in which computers operate in different countries and territories.

This ranked list includes only attacks by malicious objects classified as Malware. Our calculations leave out Web Anti-Virus detections of potentially dangerous or unwanted programs, such as RiskTool or adware.

Country/territory* %**
1 Venezuela 9.33
2 Hungary 8.16
3 Italy 7.58
4 Tajikistan 7.48
5 India 7.21
6 Greece 7.13
7 Portugal 7.10
8 France 7.05
9 Belgium 6.83
10 Slovakia 6.80
11 Vietnam 6.62
12 Bosnia and Herzegovina 6.57
13 Canada 6.56
14 Serbia 6.50
15 Tunisia 6.36
16 Qatar 6.01
17 Spain 5.95
18 Germany 5.95
19 Sri Lanka 5.89
20 Brazil 5.88

* Excluded are countries and territories with relatively few (under 10,000) Kaspersky users.
** Unique users targeted by web-based Malware attacks as a percentage of all unique users of Kaspersky products in the country/territory.

On average during the quarter, 4.73% of users’ computers worldwide were subjected to at least one Malware web attack.

Local threats

Statistics on local infections of user computers are an important indicator. They include objects that penetrated the target computer by infecting files or removable media, or initially made their way onto the computer in non-open form. Examples of the latter are programs in complex installers and encrypted files.

Data in this section is based on analyzing statistics produced by anti-virus scans of files on the hard drive at the moment they were created or accessed, and the results of scanning removable storage media. The statistics are based on detection verdicts from the On-Access Scan (OAS) and On-Demand Scan (ODS) modules of File Anti-Virus and include detections of malicious programs located on user computers or removable media connected to the computers, such as flash drives, camera memory cards, phones, or external hard drives.

In Q1 2026, our File Anti-Virus detected 15,831,319 malicious and potentially unwanted objects.

Countries and territories where users faced the highest risk of local infection

For each country and territory, we calculated the percentage of Kaspersky users whose computers had the File Anti-Virus triggered at least once during the reporting period. This statistic reflects the level of personal computer infection in different countries and territories around the world.

Note that this ranked list includes only attacks by malicious objects classified as Malware. Our calculations leave out File Anti-Virus detections of potentially dangerous or unwanted programs, such as RiskTool or adware.

Country/territory* %**
1 Turkmenistan 47.96
2 Tajikistan 31.48
3 Cuba 31.03
4 Yemen 29.59
5 Afghanistan 28.47
6 Burundi 26.93
7 Uzbekistan 24.81
8 Syria 23.08
9 Nicaragua 21.97
10 Cameroon 21.60
11 China 21.09
12 Mozambique 21.02
13 Algeria 20.64
14 Democratic Republic of the Congo 20.63
15 Bangladesh 20.44
16 Mali 20.35
17 Republic of the Congo 20.23
18 Madagascar 20.00
19 Belarus 19.78
20 Tanzania 19.52

* Excluded are countries and territories with relatively few (under 10,000) Kaspersky users.
** Unique users on whose computers local Malware threats were blocked, as a percentage of all unique users of Kaspersky products in the country/territory.

On average worldwide, Malware local threats were detected at least once on 11.55% of users’ computers during Q1.

Russia scored 11.92% in these rankings.

  • ✇Securelist
  • Exploits and vulnerabilities in Q1 2026 Alexander Kolesnikov
    During Q1 2026, the exploit kits leveraged by threat actors to target user systems expanded once again, incorporating new exploits for the Microsoft Office platform, as well as Windows and Linux operating systems. In this report, we dive into the statistics on published vulnerabilities and exploits, as well as the known vulnerabilities leveraged by popular C2 frameworks throughout Q1 2026. Statistics on registered vulnerabilities This section provides statistical data on registered vulnerabiliti
     

Exploits and vulnerabilities in Q1 2026

7 de Maio de 2026, 07:00

During Q1 2026, the exploit kits leveraged by threat actors to target user systems expanded once again, incorporating new exploits for the Microsoft Office platform, as well as Windows and Linux operating systems.

In this report, we dive into the statistics on published vulnerabilities and exploits, as well as the known vulnerabilities leveraged by popular C2 frameworks throughout Q1 2026.

Statistics on registered vulnerabilities

This section provides statistical data on registered vulnerabilities. The data is sourced from cve.org.

We examine the number of registered CVEs for each month starting from January 2022. The total volume of vulnerabilities continues rising and, according to current reports, the use of AI agents for discovering security issues is expected to further reinforce this upward trend.

Total published vulnerabilities per month from 2022 through 2026 (download)

Next, we analyze the number of new critical vulnerabilities (CVSS > 8.9) over the same period.

Total critical vulnerabilities published per month from 2022 through 2026 (download)

The graph indicates that while the volume of critical vulnerabilities slightly decreased compared to previous years, an upward trend remained clearly visible. At present, we attribute this to the fact that the end of last year was marked by the disclosure of several severe vulnerabilities in web frameworks. The current growth is driven by high-profile issues like React2Shell, the release of exploit frameworks for mobile platforms, and the uncovering of secondary vulnerabilities during the remediation of previously discovered ones. We will be able to test this hypothesis in the next quarter; if correct, the second quarter will show a significant decline, similar to the pattern observed in the previous year.

Exploitation statistics

This section presents statistics on vulnerability exploitation for Q1 2026. The data draws on open sources and our telemetry.

Windows and Linux vulnerability exploitation

In Q1 2026, threat actor toolsets were updated with exploits for new, recently registered vulnerabilities. However, we first examine the list of veteran vulnerabilities that consistently account for the largest share of detections:

  • CVE-2018-0802: a remote code execution (RCE) vulnerability in the Equation Editor component
  • CVE-2017-11882: another RCE vulnerability also affecting Equation Editor
  • CVE-2017-0199: a vulnerability in Microsoft Office and WordPad that allows an attacker to gain control over the system
  • CVE-2023-38831: a vulnerability resulting from the improper handling of objects contained within an archive
  • CVE-2025-6218: a vulnerability allowing the specification of relative paths to extract files into arbitrary directories, potentially leading to malicious command execution
  • CVE-2025-8088: a directory traversal bypass vulnerability during file extraction utilizing NTFS Streams

Among the newcomers, we have observed exploits targeting the Microsoft Office platform and Windows OS components. Notably, these new vulnerabilities exploit logic flaws arising from the interaction between multiple systems, making them technically difficult to isolate within a specific file or library. A list of these vulnerabilities is provided below:

  • CVE-2026-21509 and CVE-2026-21514: security feature bypass vulnerabilities: despite Protected View being enabled, a specially crafted file can still execute malicious code without the user’s knowledge. Malicious commands are executed on the victim’s system with the privileges of the user who opened the file.
  • CVE-2026-21513: a vulnerability in the Internet Explorer MSHTML engine, which is used to open websites and render HTML markup. The vulnerability involves bypassing rules that restrict the execution of files from untrusted network sources. Interestingly, the data provider for this vulnerability was an LNK file.

These three vulnerabilities were utilized together in a single chain during attacks on Windows-based user systems. While this combination is noteworthy, we believe the widespread use of the entire chain as a unified exploit will likely decline due to its instability. We anticipate that these vulnerabilities will eventually be applied individually as initial entry vectors in phishing campaigns.

Below is the trend of exploit detections on user Windows systems starting from Q1 2025.

Dynamics of the number of Windows users encountering exploits, Q1 2025 – Q1 2026. The number of users who encountered exploits in Q1 2025 is taken as 100% (download)

The vulnerabilities listed here can be leveraged to gain initial access to a vulnerable system and for privilege escalation. This underscores the critical importance of timely software updates.

On Linux devices, exploits for the following vulnerabilities were detected most frequently:

  • CVE-2022-0847: a vulnerability known as Dirty Pipe, which enables privilege escalation and the hijacking of running applications
  • CVE-2019-13272: a vulnerability caused by improper handling of privilege inheritance, which can be exploited to achieve privilege escalation
  • CVE-2021-22555: a heap out-of-bounds write vulnerability in the Netfilter kernel subsystem
  • CVE-2023-32233: a vulnerability in the Netfilter subsystem that allows for Use-After-Free conditions and privilege escalation through the improper processing of network requests

Dynamics of the number of Linux users encountering exploits, Q1 2025 – Q1 2026. The number of users who encountered exploits in Q1 2025 is taken as 100% (download)

In the first quarter of 2026, we observed a decrease in the number of detected exploits; however, the detection rates are on the rise relative to the same period last year. For the Linux operating system, the installation of security patches remains critical.

Most common published exploits

The distribution of published exploits by software type in Q1 2026 features an updated set of categories; once again, we see exploits targeting operating systems and Microsoft Office suites.

Distribution of published exploits by platform, Q1 2026 (download)

Vulnerability exploitation in APT attacks

We analyzed which vulnerabilities were utilized in APT attacks during Q1 2026. The ranking provided below includes data based on our telemetry, research, and open sources.

TOP 10 vulnerabilities exploited in APT attacks, Q1 2026 (download)

In Q1 2026, threat actors continued to utilize high-profile vulnerabilities registered in the previous year for APT attacks. The hypothesis we previously proposed has been confirmed: security flaws affecting web applications remain heavily exploited in real-world attacks. However, we are also observing a partial refresh of attacker toolsets. Specifically, during the first quarter of the year, APT campaigns leveraged recently discovered vulnerabilities in Microsoft Office products, edge networking device software, and remote access management systems. Although the most recent vulnerabilities are being exploited most heavily, their general characteristics continue to reinforce established trends regarding the categories of vulnerable software. Consequently, we strongly recommend applying the security patches provided by vendors.

C2 frameworks

In this section, we examine the most popular C2 frameworks used by threat actors and analyze the vulnerabilities targeted by the exploits that interacted with C2 agents in APT attacks.

The chart below shows the frequency of known C2 framework usage in attacks against users during Q1 2026, according to open sources.

TOP 10 C2 frameworks used by APTs to compromise user systems, Q1 2026 (download)

Metasploit has returned to the top of the list of the most common C2 frameworks, displacing Sliver, which now shares the second position with Havoc. These are followed by Covenant and Mythic, the latter of which previously saw greater popularity. After studying open sources and analyzing samples of malicious C2 agents that contained exploits, we determined that the following vulnerabilities were utilized in APT attacks involving the C2 frameworks mentioned above:

  • CVE-2023-46604: an insecure deserialization vulnerability allowing for arbitrary code execution within the server process context if the Apache ActiveMQ service is running
  • CVE-2024-12356 and CVE-2026-1731: command injection vulnerabilities in BeyondTrust software that allow an attacker to send malicious commands even without system authentication
  • CVE-2023-36884: a vulnerability in the Windows Search component that enables command execution on the system, bypassing security mechanisms built into Microsoft Office applications
  • CVE-2025-53770: an insecure deserialization vulnerability in Microsoft SharePoint that allows for unauthenticated command execution on the server
  • CVE-2025-8088 and CVE-2025-6218: similar directory traversal vulnerabilities that allow files to be extracted from an archive to a predefined path, potentially without the archiving utility displaying any alerts to the user

The nature of the described vulnerabilities indicates that they were exploited to gain initial access to the system. Notably, the majority of these security issues are targeted to bypass authentication mechanisms. This is likely due to the fact that C2 agents are being detected effectively, prompting threat actors to reduce the probability of discovery by utilizing bypass exploits.

Notable vulnerabilities

This section highlights the most significant vulnerabilities published in Q1 2026 that have publicly available descriptions.

CVE-2026-21519: Desktop Window Manager vulnerability

At the core of this vulnerability is a Type Confusion flaw. By attempting to access a resource within the Desktop Window Manager subsystem, an attacker can achieve privilege escalation. A necessary condition for exploiting this issue is existing authorization on the system.

It is worth noting that the DWM subsystem has been under close scrutiny by threat actors for quite some time. Historically, the primary attack vector involves interacting with the NtDComposition* function set.

RegPwn (CVE-2026-21533): a system settings access control vulnerability

CVE-2026-21533 is essentially a logic vulnerability that enables privilege escalation. It stems from the improper handling of privileges within Remote Desktop Services (RDS) components. By modifying service parameters in the registry and replacing the configuration with a custom key, an attacker can elevate privileges to the SYSTEM level. This vulnerability is likely to remain a fixture in threat actor toolsets as a method for establishing persistence and gaining high-level privileges.

CVE-2026-21514: a Microsoft Office vulnerability

This vulnerability was discovered in the wild during attacks on user systems. Notably, an LNK file is used to initiate the exploitation process. CVE-2026-21514 is also a logic issue that allows for bypassing OLE technology restrictions on malicious code execution and the transmission of NetNTLM authentication requests when processing untrusted input.

Clawdbot (CVE-2026-25253): an OpenClaw vulnerability

This vulnerability in the AI agent leaks credentials (authentication tokens) when queried via the WebSocket protocol. It can lead to the compromise of the infrastructure where the agent is installed: researchers have confirmed the ability to access local system data and execute commands with elevated privileges. The danger of CVE-2026-25253 is further compounded by the fact that its exploitation has generated numerous attack scenarios, including the use of prompt injections and ClickFix techniques to install stealers on vulnerable systems.

CVE-2026-34070: LangChain framework vulnerability

LangChain is an open-source framework designed for building applications powered by large language models (LLMs). A directory traversal vulnerability allowed attackers to access arbitrary files within the infrastructure where the framework was deployed. The core of CVE-2026-34070 lies in the fact that certain functions within langchain_core/prompts/loading.py handled configuration files insecurely. This could potentially lead to the processing of files containing malicious data, which could be leveraged to execute commands and expose critical system information or other sensitive files.

CVE-2026-22812: an OpenCode vulnerability

CVE-2026-22812 is another vulnerability identified in AI-assisted coding software. By default, the OpenCode agent provided local access for launching authorized applications via an HTTP server that did not require authentication. Consequently, attackers could execute malicious commands on a vulnerable device with the privileges of the current user.

Conclusion and advice

We observe that the registration of vulnerabilities is steadily gaining momentum in Q1 2026, a trend driven by the widespread development of AI tools designed to identify security flaws across various software types. This trajectory is likely to result not only in a higher volume of registered vulnerabilities but also in an increase in exploit-driven attacks, further reinforcing the critical necessity of timely security patch deployment. Additionally, organizations must prioritize vulnerability management and implement effective defensive technologies to mitigate the risks associated with potential exploitation.

To ensure the rapid detection of threats involving exploit utilization and to prevent their escalation, it is essential to deploy a reliable security solution. Key features of such a tool include continuous infrastructure monitoring, proactive protection, and vulnerability prioritization based on real-world relevance. These mechanisms are integrated into Kaspersky Next, which also provides endpoint security and protection against cyberattacks of any complexity.

  • ✇Securelist
  • Threat landscape for industrial automation systems in Q4 2025 Kaspersky ICS CERT
    Statistics across all threats The percentage of ICS computers on which malicious objects were blocked has been decreasing since the beginning of 2024. In Q4 2025, it was 19.7%. Over the past three years, the percentage has decreased by 1.36 times, and by 1.25 times since Q4 2023. Percentage of ICS computers on which malicious objects were blocked, Q1 2023–Q4 2025 Regionally, in Q4 2025, the percentage of ICS computers on which malicious objects were blocked ranged from 8.5% in Northern Europe to
     

Threat landscape for industrial automation systems in Q4 2025

15 de Abril de 2026, 09:30

Statistics across all threats

The percentage of ICS computers on which malicious objects were blocked has been decreasing since the beginning of 2024. In Q4 2025, it was 19.7%. Over the past three years, the percentage has decreased by 1.36 times, and by 1.25 times since Q4 2023.

Percentage of ICS computers on which malicious objects were blocked, Q1 2023–Q4 2025

Percentage of ICS computers on which malicious objects were blocked, Q1 2023–Q4 2025

Regionally, in Q4 2025, the percentage of ICS computers on which malicious objects were blocked ranged from 8.5% in Northern Europe to 27.3% in Africa.

Regions ranked by percentage of ICS computers on which malicious objects were blocked

Regions ranked by percentage of ICS computers on which malicious objects were blocked

Four regions saw an increase in the percentage of ICS computers on which malicious objects were blocked. The most notable increases occurred in Southern Europe and South Asia. In Q3 2025, East Asia experienced a sharp increase triggered by the local spread of malicious scripts, but the figure has since returned to normal.

Changes in percentage of ICS computers on which malicious objects were blocked, Q4 2025

Changes in percentage of ICS computers on which malicious objects were blocked, Q4 2025

Feature of the quarter: worms in email

In Q4 2025, the percentage of ICS computers on which wormsinemailattachments were blocked increasedinallregions of the world.

Many of the blocked threats were related to the worm Backdoor.MSIL.XWorm. This malware is designed to persist on the system and then remotely control it.

Interestingly, this threat was not detected on ICS computers in the previous quarter, yet it appeared in all regions in Q4 2025.

A study found that the active spread of Backdoor.MSIL.XWorm via phishing emails was likely linked to the use by hackers of another malware obfuscation technique that was actively used during massive phishing campaigns in Q4 2025. These campaigns have been known since 2024 as “Curriculum-vitae-catalina”.

The attackers distributed phishing emails to HR managers, recruiters, and employees responsible for hiring. The messages were disguised as responses from job applicants with subjects such as “Resume” or “Attached Resume” and contained a malicious executable file under the guise of a curriculum vitae. Typically, the file was named Curriculum Vitae-Catalina.exe. When executed, it infected the system.

In Q4 2025, the threat spread across regions in two waves — one in October and another in November. Russia, Western Europe, South America, and North America (Canada) were attacked in October. A spike in Backdoor.MSIL.XWorm blocking was observed in other regions in November. The attack subsided in all regions in December.

The highest percentage of ICS computers on which Backdoor.MSIL.XWorm was blocked was observed in regions where threats from email clients had been historically blocked at high rates on ICS computers: Southern Europe, South America, and the Middle East.

At the same time, in Africa, where USB storage media are still actively used, the threat was also detected when removable devices were connected to ICS computers.

Selected industries

The biometrics sector has historically led the rankings of industries and OT infrastructures surveyed in this report in terms of the percentage of ICS computers on which malicious objects were blocked.

These systems are characterized by accessibility to and from the internet, as well as minimal cybersecurity controls by the consumer organization.

Rankings of industries and OT infrastructure by percentage of ICS computers on which malicious objects were blocked

Rankings of industries and OT infrastructure by percentage of ICS computers on which malicious objects were blocked

In Q4 2025, the percentage of ICS computers on which malicious objects were blocked increased only in one sector: oil and gas. The corresponding figures increased in two regions: Russia, and Central Asia and the South Caucasus.

However, if we look at a broader time span, there is a downward trend in all the surveyed industries.

Percentage of ICS computers on which malicious objects were blocked in selected industries

Percentage of ICS computers on which malicious objects were blocked in selected industries

Diversity of detected malicious objects

In Q4 2025, Kaspersky protection solutions blocked malware from 10,142 different malware families of various categories on industrial automation systems.

Percentage of ICS computers on which the activity of malicious objects from various categories was blocked

Percentage of ICS computers on which the activity of malicious objects from various categories was blocked

In Q4 2025, there was an increase in the percentage of ICS computers on which worms, and miners in the form of executable files for Windows were blocked. These were the only categories that exhibited an increase.

Main threat sources

Depending on the threat detection and blocking scenario, it is not always possible to reliably identify the source. The circumstantial evidence for a specific source can be the blocked threat’s type (category).

The internet (visiting malicious or compromised internet resources; malicious content distributed via messengers; cloud data storage and processing services and CDNs), email clients (phishing emails), and removable storage devices remain the primary sources of threats to computers in an organization’s technology infrastructure.

In Q4 2025, the percentage of ICS computers on which malicious objects from various sources were blocked decreased. All sources except email clients saw their lowest levels in three years.

Percentage of ICS computers on which malicious objects from various sources were blocked

Percentage of ICS computers on which malicious objects from various sources were blocked

The same computer can be attacked by several categories of malware from the same source during a quarter. That computer is counted when calculating the percentage of attacked computers for each threat category, but is only counted once for the threat source (we count unique attacked computers). In addition, it is not always possible to accurately determine the initial infection attempt. Therefore, the total percentage of ICS computers on which various categories of threats from a certain source were blocked can exceed the percentage of computers affected by the source itself.

  • In Q4 2025, the percentage of ICS computers on which threats from the internet were blocked decreased to 7.67% and reached its lowest level since the beginning of 2023. The main categories of internet threats are malicious scripts and phishing pages, and denylisted internet resources. The percentage ranged from 3.96% in Northern Europe to 11.33% in South Asia.
  • The main categories of threats from email clients blocked on ICS computers were malicious scripts and phishing pages, spyware, and malicious documents. Most of the spyware detected in phishing emails was delivered as a password archive or a multi-layered script embedded in office document files. The percentage of ICS computers on which threats from email clients were blocked ranged from 0.64% in Northern Europe to 6.34% in Southern Europe.
  • The main categories of threats that were blocked when removable media was connected to ICS computers were worms, viruses, and spyware. The percentage of ICS computers on which threats from removable media were blocked ranged from 0.05% in Australia and New Zealand to 1.41% in Africa.
  • The main categories of threats that spread through network folders in Q4 2025 were viruses, AutoCAD malware, worms, and spyware. The percentage of ICS computers on which threats from network folders were blocked ranged from 0.01% in Northern Europe to 0.18% in East Asia.

Threat categories

Typical attacks blocked within an OT network are multi-step sequences of malicious activities, where each subsequent step of the attackers is aimed at increasing privileges and/or gaining access to other systems by exploiting the security problems of industrial enterprises, including OT infrastructures.

Malicious objects used for initial infection

In Q4 2025, the percentage of ICS computers on which denylisted internet resources were blocked decreased to 3.26%. This is the lowest quarterly figure since the beginning of 2022, and it has decreased by 1.8 times since Q2 2025.

Percentage of ICS computers on which denylisted internet resources were blocked, Q1 2023–Q4 2025

Percentage of ICS computers on which denylisted internet resources were blocked, Q1 2023–Q4 2025

Regionally, the percentage of ICS computers on which denylisted internet resources were blocked ranged from 1.74% in Northern Europe to 3.93% in Southeast Asia, which displaced Africa from first place. Russia rounded out the top three regions for this indicator.

The percentage of ICS computers on which malicious documents were blocked increased for three consecutive quarters. However, in Q4 2025 it decreased by 0.22 pp to 1.76%.

Percentage of ICS computers on which malicious documents were blocked, Q1 2023–Q4 2025

Percentage of ICS computers on which malicious documents were blocked, Q1 2023–Q4 2025

Regionally, the percentage ranged from 0.46% in Northern Europe to 3.82% in Southern Europe. In Q4 2025, the indicator increased in Eastern Europe, Russia, and Western Europe.

The percentage of ICS computers on which malicious scripts and phishing pages were blocked decreased to 6.58%. Despite the decline, this category led the rankings of threat categories in terms of the percentage of ICS computers on which they were blocked.

Percentage of ICS computers on which malicious scripts and phishing pages were blocked, Q1 2023–Q4 2025

Percentage of ICS computers on which malicious scripts and phishing pages were blocked, Q1 2023–Q4 2025

Regionally, the percentage ranged from 2.52% in Northern Europe to 10.50% in South Asia. The indicator increased in South Asia, South America, Southern Europe, and Africa. South Asia saw the most notable increase, at 3.47 pp.

Next-stage malware

Malicious objects used to initially infect computers deliver next-stage malware — spyware, ransomware, and miners — to victims’ computers. As a rule, the higher the percentage of ICS computers on which the initial infection malware is blocked, the higher the percentage for next-stage malware.

In Q4 2025, the percentage of ICS computers on which spyware, ransomware and web miners were blocked decreased. The rates were:

  • Spyware: 3.80% (down 0.24 pp). For the second quarter in a row, spyware took second place in the rankings of threat categories in terms of the percentage of ICS computers on which it was blocked.
  • Ransomware: 0.16% (down 0.01 pp).
  • Web miners: 0.24% (down 0.01 pp), this is the lowest level observed thus far in the period under review.

The percentage of ICS computers on which miners in the form of executable files for Windows were blocked increased to 0.60% (up 0.03 pp).

Self-propagating malware

Self-propagating malware (worms and viruses) is a category unto itself. Worms and virus-infected files were originally used for initial infection, but as botnet functionality evolved, they took on next-stage characteristics.

To spread across ICS networks, viruses and worms rely on removable media and network folders and are distributed in the form of infected files, such as archives with backups, office documents, pirated games and hacked applications. In rarer and more dangerous cases, web pages with network equipment settings, as well as files stored in internal document management systems, product lifecycle management (PLM) systems, resource management (ERP) systems and other web services are infected.

In Q4 2025, the percentage of ICS computers on which worms were blocked increased by 1.6 times to 1.60%. As mentioned above, this increase is related to a global phishing attack that spread the Backdoor.MSIL.XWorm backdoor worm across all regions of the world. The percentage increased in all regions. The biggest increase (up by 2.16 times) was in Southern Europe. The malware was primary distributed through email clients, and Southern Europe led the way in terms of the percentage of ICS computers on which threats from email clients were blocked.

The percentage of ICS computers on which viruses were blocked decreased to 1.33%.

AutoCAD malware

This category of malware can spread in a variety of ways, so it does not belong to a specific group.

After an increase in the previous quarter, the percentage of ICS computers on which AutoCAD malware was blocked decreased to 0.29% in Q4 2025.

For more information on industrial threats see the full version of the report.

  • ✇Securelist
  • Financial cyberthreats in 2025 and the outlook for 2026 Olga Altukhova · Oleg Kupreev · Polina Tretyak
    In 2025, the financial cyberthreat landscape continued to evolve. While traditional PC banking malware declined in relative prevalence, this shift was offset by the rapid growth of credential theft by infostealers. Attackers increasingly relied on aggregation and reuse of stolen data, rather than developing entirely new malware capabilities. To describe the financial threat landscape in 2025, we analyzed anonymized data on malicious activities detected on the devices of Kaspersky security produc
     

Financial cyberthreats in 2025 and the outlook for 2026

8 de Abril de 2026, 06:00

In 2025, the financial cyberthreat landscape continued to evolve. While traditional PC banking malware declined in relative prevalence, this shift was offset by the rapid growth of credential theft by infostealers. Attackers increasingly relied on aggregation and reuse of stolen data, rather than developing entirely new malware capabilities.

To describe the financial threat landscape in 2025, we analyzed anonymized data on malicious activities detected on the devices of Kaspersky security product users and consensually provided to us through the Kaspersky Security Network (KSN), along with publicly available data and data on the dark web.

We analyzed the data for

  • financial phishing,
  • banking malware,
  • infostealers and the dark web.

Key findings

Phishing

Phishing activity in 2025 shifted toward e-commerce (14.17%) and digital services (16.15%), with attackers increasingly tailoring campaigns to regional trends and user behavior, making social engineering more targeted despite reduced focus on traditional banking lures.

Banking malware

Financial PC malware declined in prevalence but remained a persistent threat, with established families continuing to operate, while attackers increasingly prioritize credential access and indirect fraud over deploying complex banking Trojans. To the contrary, mobile banking malware continues growing, as we wrote in detail in our mobile malware report.
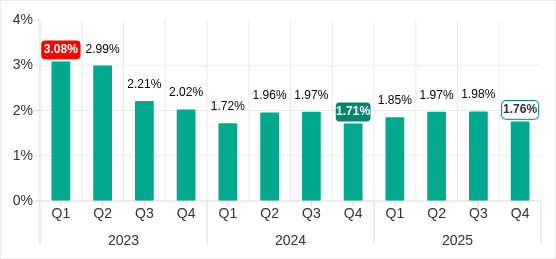
Infostealers and the dark web

Infostealers became a central driver of financial cybercrime, fueling a growing dark web economy where stolen credentials, payment data, and full identity profiles are traded at scale, enabling widespread and destructive fraud operations.

Financial phishing

In 2025, online fraudsters continued to lure users to phishing and scam pages that mimicked the websites of popular brands and financial organizations. Attackers leveraged increasingly convincing social engineering techniques and brand impersonation to exploit user trust. Rather than relying solely on volume, campaigns showed greater targeting and contextual adaptation, reflecting a maturation of phishing operations.

The distribution of top phishing categories in 2025 shows a clear shift toward digital platforms that aggregate multiple user activities, with web services (16.15%), online games (14.58%), and online stores (14.17%) leading globally. Compared to 2024, the rise of online games and the decline of social networks and banks indicate that attackers are increasingly targeting environments where users are more likely to take a risk or engage impulsively. Categories such as instant messaging apps and global internet portals remain significant phishing targets, reflecting their role as communication and access hubs that can be exploited for credential harvesting.

TOP 10 categories of organizations mimicked by phishing and scam pages that were blocked on home users’ devices, 2025 (download)

Regional patterns further reinforce the adaptive nature of phishing campaigns, showing that attackers closely align category targeting with local digital habits. For example, online stores dominate heavily in the Middle East.

TOP 10 categories of organizations mimicked by phishing and scam pages that were blocked on home users’ devices in the Middle East, 2025 (download)

Online games and instant messaging platforms feature more prominently in the CIS, suggesting a focus on younger or highly connected user bases.

TOP 10 categories of organizations mimicked by phishing and scam pages that were blocked on home users’ devices in the CIS, 2025 (download)

APAC demonstrates almost equal shares of online games and banks which signifies a combined approach targeting different users.

TOP 10 categories of organizations mimicked by phishing and scam pages that were blocked on home users’ devices in APAC, 2025 (download)

In Africa, a stronger emphasis on banks reflects the continued importance of traditional financial services. Most likely, this is due to the lower security level of the financial institutions in the region.

TOP 10 categories of organizations mimicked by phishing and scam pages that were blocked on home users’ devices in Africa, 2025 (download)

Whereas in LATAM, delivery companies appearing in the top categories indicate attackers exploiting the growth of e-commerce logistics.

TOP 10 categories of organizations mimicked by phishing and scam pages that were blocked on home users’ devices in Latin America, 2025 (download)

Europe presents a more balanced distribution across categories, pointing to diversified attack strategies.

TOP 10 categories of organizations mimicked by phishing and scam pages that were blocked on home users’ devices in Europe, 2025 (download)

Attackers actively localize their tactics to maximize relevance and effectiveness.

The distribution of financial phishing pages by category in 2025 reveals strong regional asymmetries that reflect both user behavior and attacker prioritization.

Globally, online stores dominated (48.45%), followed by banks (26.05%) and payment systems (25.50%). The decline in bank phishing may suggest that these services are becoming increasingly difficult to successfully impersonate, so fraudsters are turning to easier ways to access users’ finances.

However, this balance shifts significantly at the regional level.

In the Middle East, phishing is overwhelmingly concentrated on e-commerce (85.8%), indicating a heavy reliance on online retail lures, whereas in Africa, bank-related phishing leads (53.75%), which may indicate that user account security there is still insufficient. LATAM shows a more balanced distribution but with a higher share of online store targeting (46.30%), while APAC and Europe display a more even spread across all three categories, pointing to diversified attack strategies. These variations suggest that attackers are not operating uniformly but are instead adapting campaigns to regional digital habits, payment ecosystems, and trust patterns – maximizing effectiveness by aligning phishing content with the most commonly used financial services in each market.

Distribution of financial phishing pages by category and region, 2025 (download)

Online shopping scams

The distribution of organizations mimicked by phishing and scam pages in 2025 highlights a clear shift toward globally recognized digital service and e-commerce brands, with attackers prioritizing platforms that have large, active user bases and frequent payment interactions.

Netflix (28.42%) solidified its ranking as the most impersonated brand, followed by Apple (20.55%), Spotify (18.09%), and Amazon (17.85%). This reflects a move away from traditional retail-only targets toward subscription-based and ecosystem-driven services.

TOP 10 online shopping brands mimicked by phishing and scam pages, 2025 (download)

Regionally, this trend varies: Netflix dominates heavily in the Middle East, Apple leads in APAC, while Spotify ranks first across Europe, LATAM, and Africa. Although most of the top platforms are highly popular across different regions, we may suggest that the attackers tailor brand impersonation to regional popularity and user engagement.

Payment system phishing

Phishing campaigns are impersonating multiple payment ecosystems to maximize coverage. While PayPal was the most mimicked in 2024 with 37.53%, its share dropped to 14.10% in 2025. Mastercard, on the contrary, attracted cybercriminals’ attention, its share increasing from 30.54% to 33.45%, while Visa accounted for a significant 20.06% (last year, it wasn’t in the TOP 5), reinforcing the growing focus on widely used banking card networks. The continued presence of American Express (3.87%) and the increasing number of pages mimicking PayPay (11.72%) further highlight attacker experimentation and regional adaptation.

TOP 5 payment systems mimicked by phishing and scam pages, 2025 (download)

Financial malware

In 2025, the decline in users affected by financial PC malware continued. On the one hand, people continue to rely on mobile devices to manage their finances. On the other hand, some of the most prominent malware families that were initially designed as bankers had not used this functionality for years, so we excluded them from these statistics.

Changes in the number of unique users attacked by banking malware, by month, 2023–2025 (download)

Windows systems remained the primary platform targeted by attackers with financial malware. According to Kaspersky Security Bulletin, overall detections included 1,338,357 banking Trojan attacks globally from November 2024 to October 2025, though this number is also declining due to increasing focus on mobile vectors. Desktop threats continued to be distributed via traditional delivery methods like malicious emails, compromised websites, and droppers.

In 2025, Brazilian-origin families such as Grandoreiro (part of the Tetrade group) stood out for their constant activity and global reach. Despite a major law enforcement disruption in early 2024, Grandoreiro remained active in 2025, re-emerging with updated variants and continuing to operate. Other notable actors included Coyote and emerging families like Maverick, which abused WhatsApp for distribution while maintaining fileless techniques and overlaps with established Brazilian banking malware to steal credentials and enable fraudulent transactions on desktop banking platforms. Besides traditional bankers, other Brazilian malware families are worth mentioning, which specifically target relatively new and highly popular regional payment systems. One of the most prominent threats among these is GoPix Trojan focusing on the users of Brazilian Pix payment system. It is also capable of targeting local Boleto payment method, as well as stealing cryptocurrency.

There was also a surge in incidents in 2025 in which fraudsters targeted organizations through electronic document management (EDM) systems, for example, by substituting invoice details to trick victims into transferring funds. The Pure Trojan was most frequently encountered in such attacks. Attackers typically distribute it through targeted emails, using abbreviations of document names, software titles, or other accounting-related keywords in the headers of attached files. Globally in the corporate segment, Pure was detected 896 633 times over 2025, with over 64 thousand users attacked.

Contrary to PC banking malware, mobile banker attacks grew by 1.5 times in 2025 compared to the previous reporting period, which is consistent with their growth in 2024. They also saw a sharp surge in the number of unique installation packages. More statistics and trends on mobile banking malware can be found in our yearly mobile threat report.
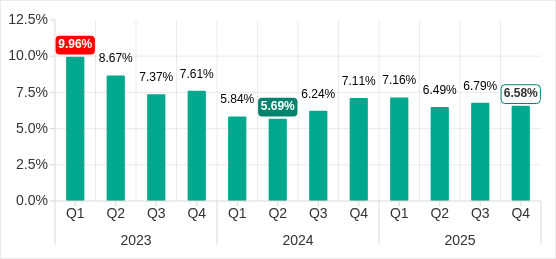
Complementing traditional financial malware, infostealers played a significant role in enabling financial crime both on PCs and mobile devices by harvesting credentials, cookies, and autofill data from browsers and applications, which attackers then used for account takeovers or direct banking fraud. Kaspersky analyses pointed to a surge in infostealer detections (up by 59% globally on PCs), fueling credential-based attacks.

Financial cyberthreats on the dark web

The Kaspersky Digital Footprint Intelligence (DFI) team closely monitors infostealer activity on both PC and mobile devices to analyze emerging trends and assess the evolving tactics of cybercriminals.

Fraudsters especially target financial data such as payment cards, cryptocurrency wallets, login credentials and cookies for banking services, as well as documents stored on the victim’s device. The stolen data is collected in log files and shared on dark web resources, where they are bought, sold, or distributed freely and then used for financial fraud.

With access to financial data, fraudsters can gain control of users’ bank accounts and payment cards, and withdraw funds. Compromised accounts and cards are also frequently used in subsequent activities, turning the victims into intermediaries in a fraud scheme.

Compromised accounts

Kaspersky DFI found that in 2025, over one million online banking accounts (these are not Kaspersky product users) served by the world’s 100 largest banks fell victim to infostealers: their credentials were being freely shared on the dark web.

The countries with the highest median number of compromised accounts per bank were India, Spain, and Brazil.

The chart below shows the median number of compromised accounts per bank for the TOP 10 countries.

TOP 10 countries with the highest compromised account median (download)

Compromised payment cards

Seventy-four percent of payment cards that were compromised by infostealer malware, published on dark web resources and identified by the Digital Footprint Intelligence team in 2025, remained valid as of March 2026. This means that attackers could still use the cards that had been stolen months or even years prior.

It should be noted that the number of bank accounts and payment cards known to have been compromised by infostealers in 2025 will continue to rise, because fraudsters do not publish the log files immediately after the compromise but only after a delay of months or even years.

Data breaches

Regardless of the industry in which the target company operates, data breaches often expose users’ financial data, including payment card information, bank account details, transaction histories and other financial information. As a consequence, the compromised databases are sold and distributed on underground resources.

It should be noted that the threat is not limited to the exposure of financial information alone. Various identity documents and even seemingly public data, such as names, phone numbers and email addresses, can become a risk when they are published on the dark web. Such data attracts fraudsters’ attention and can be used in social engineering attacks to gain access to the user’s financial assets.

An example of a post offering a database

An example of a post offering a database

Sale of bank accounts and payment cards

The dark web often features services provided by stores that specialize in selling bank accounts and payment cards. Fraudsters typically obtain data for sale from a variety of sources, including infostealer logs and leaked databases, which are first repackaged and then combined.

Examples of a post (top) and a site (bottom) offering payment cards

Examples of a post (top) and a site (bottom) offering payment cards

Often, sellers offer complete victim profiles, referred to by fraudsters as “fullz”. These include not only bank accounts or payment cards but also identification documents, dates of birth, residential addresses, and other personal details. A full‑information package is usually more expensive than a payment card or a bank account alone.

Examples of a post (top) and a site (bottom) offering bank accounts

Examples of a post (top) and a site (bottom) offering bank accounts

Compiled databases

Fraudsters exploit various sources, including previously leaked databases, to compile new, thematic ones. Finance- and, in particular, cryptocurrency-related databases, are among the most popular. Compilations aimed at specific user groups, such as the elderly or wealthy people, are also of interest to cybercriminals.

Usually, thematic databases contain personal information about users, such as names, phone numbers, and email addresses. Fraudsters can use this data to launch social engineering attacks.

An example of a message offering compiled databases

An example of a message offering compiled databases

Creation of phishing websites

Phishing websites have become a powerful tool for the financial enrichment of fraudsters. Cybercriminals create fraudulent sites that masquerade as legitimate resources of companies operating in various industries. Gambling and retail sites remain among the most popular targets.

In order to obtain personal and financial information from unsuspecting users, adversaries seek out ways to create such phishing websites. Ready-made layouts and website copies are sold on the dark web and advertised as profitable tools. Moreover, fraudsters offer phishing website creation services.

Examples of posts offering creation of phishing websites

Examples of posts offering creation of phishing websites

Conclusion

The decline of traditional PC banking malware is not an indicator of reduced risk; rather, it highlights a redistribution of attacker effort toward more efficient methods targeting mobile devices, credential theft, and social engineering. Infostealers, in particular, are a force multiplier, enabling widespread compromise at scale.

Looking ahead to 2026, the financial threat landscape is expected to become even more data-driven and automated. Organizations must adapt by focusing on identity protection, real-time monitoring, and cross-channel threat intelligence, while users must remain vigilant against increasingly sophisticated and personalized attack techniques.

  • ✇Securelist
  • Exploits and vulnerabilities in Q4 2025 Alexander Kolesnikov
    The fourth quarter of 2025 went down as one of the most intense periods on record for high-profile, critical vulnerability disclosures, hitting popular libraries and mainstream applications. Several of these vulnerabilities were picked up by attackers and exploited in the wild almost immediately. In this report, we dive into the statistics on published vulnerabilities and exploits, as well as the known vulnerabilities leveraged with popular C2 frameworks throughout Q4 2025. Statistics on registe
     

Exploits and vulnerabilities in Q4 2025

6 de Março de 2026, 07:00

The fourth quarter of 2025 went down as one of the most intense periods on record for high-profile, critical vulnerability disclosures, hitting popular libraries and mainstream applications. Several of these vulnerabilities were picked up by attackers and exploited in the wild almost immediately.

In this report, we dive into the statistics on published vulnerabilities and exploits, as well as the known vulnerabilities leveraged with popular C2 frameworks throughout Q4 2025.

Statistics on registered vulnerabilities

This section contains statistics on registered vulnerabilities. The data is taken from cve.org.

Let’s take a look at the number of registered CVEs for each month over the last five years, up to and including the end of 2025. As predicted in our last report, Q4 saw a higher number of registered vulnerabilities than the same period in 2024, and the year-end totals also cleared the bar set the previous year.

Total published vulnerabilities by month from 2021 through 2025 (download)

Now, let’s look at the number of new critical vulnerabilities (CVSS > 8.9) for that same period.

Total number of published critical vulnerabilities by month from 2021 to 2025< (download)

The graph shows that the volume of critical vulnerabilities remains quite substantial; however, in the second half of the year, we saw those numbers dip back down to levels seen in 2023. This was due to vulnerability churn: a handful of published security issues were revoked. The widespread adoption of secure development practices and the move toward safer languages also pushed those numbers down, though even that couldn’t stop the overall flood of vulnerabilities.

Exploitation statistics

This section contains statistics on the use of exploits in Q4 2025. The data is based on open sources and our telemetry.

Windows and Linux vulnerability exploitation

In Q4 2025, the most prevalent exploits targeted the exact same vulnerabilities that dominated the threat landscape throughout the rest of the year. These were exploits targeting Microsoft Office products with unpatched security flaws.

Kaspersky solutions detected the most exploits on the Windows platform for the following vulnerabilities:

  • CVE-2018-0802: a remote code execution vulnerability in Equation Editor.
  • CVE-2017-11882: another remote code execution vulnerability, also affecting Equation Editor.
  • CVE-2017-0199: a vulnerability in Microsoft Office and WordPad that allows an attacker to assume control of the system.

The list has remained unchanged for years.

We also see that attackers continue to adapt exploits for directory traversal vulnerabilities (CWE-35) when unpacking archives in WinRAR. They are being heavily leveraged to gain initial access via malicious archives on the Windows operating system:

  • CVE-2023-38831: a vulnerability stemming from the improper handling of objects within an archive.
  • CVE-2025-6218 (formerly ZDI-CAN-27198): a vulnerability that enables an attacker to specify a relative path and extract files into an arbitrary directory. This can lead to arbitrary code execution. We covered this vulnerability in detail in our Q2 2025 report.

  • CVE-2025-8088: a vulnerability we analyzed in our previous report, analogous to CVE-2025-6218. The attackers used NTFS streams to circumvent controls on the directory into which files were being unpacked.

As in the previous quarter, we see a rise in the use of archiver exploits, with fresh vulnerabilities increasingly appearing in attacks.

Below are the exploit detection trends for Windows users over the last two years.

Dynamics of the number of Windows users encountering exploits, Q1 2024 – Q4 2025. The number of users who encountered exploits in Q1 2024 is taken as 100% (download)

The vulnerabilities listed here can be used to gain initial access to a vulnerable system. This highlights the critical importance of timely security updates for all affected software.

On Linux-based devices, the most frequently detected exploits targeted the following vulnerabilities:

  • CVE-2022-0847, also known as Dirty Pipe: a vulnerability that allows privilege escalation and enables attackers to take control of running applications.
  • CVE-2019-13272: a vulnerability caused by improper handling of privilege inheritance, which can be exploited to achieve privilege escalation.
  • CVE-2021-22555: a heap overflow vulnerability in the Netfilter kernel subsystem.
  • CVE-2023-32233: another vulnerability in the Netfilter subsystem that creates a use-after-free condition, allowing for privilege escalation due to the improper handling of network requests.

Dynamics of the number of Linux users encountering exploits, Q1 2024 – Q4 2025. The number of users who encountered exploits in Q1 2024 is taken as 100% (download)

We are seeing a massive surge in Linux-based exploit attempts: in Q4, the number of affected users doubled compared to Q3. Our statistics show that the final quarter of the year accounted for more than half of all Linux exploit attacks recorded for the entire year. This surge is primarily driven by the rapidly growing number of Linux-based consumer devices. This trend naturally attracts the attention of threat actors, making the installation of security patches critically important.
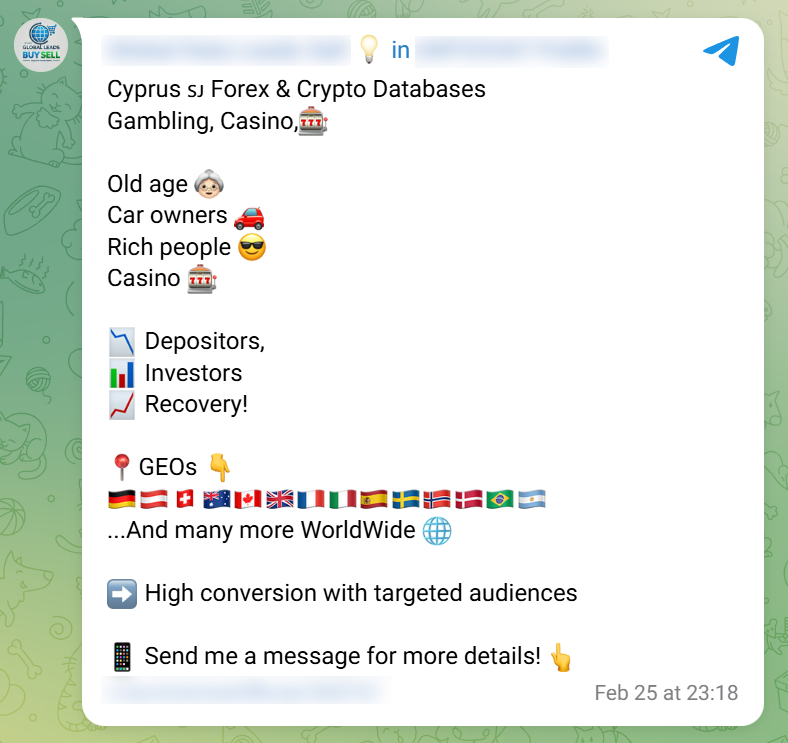
Most common published exploits

The distribution of published exploits by software type in Q4 2025 largely mirrors the patterns observed in the previous quarter. The majority of exploits we investigate through our monitoring of public research, news, and PoCs continue to target vulnerabilities within operating systems.
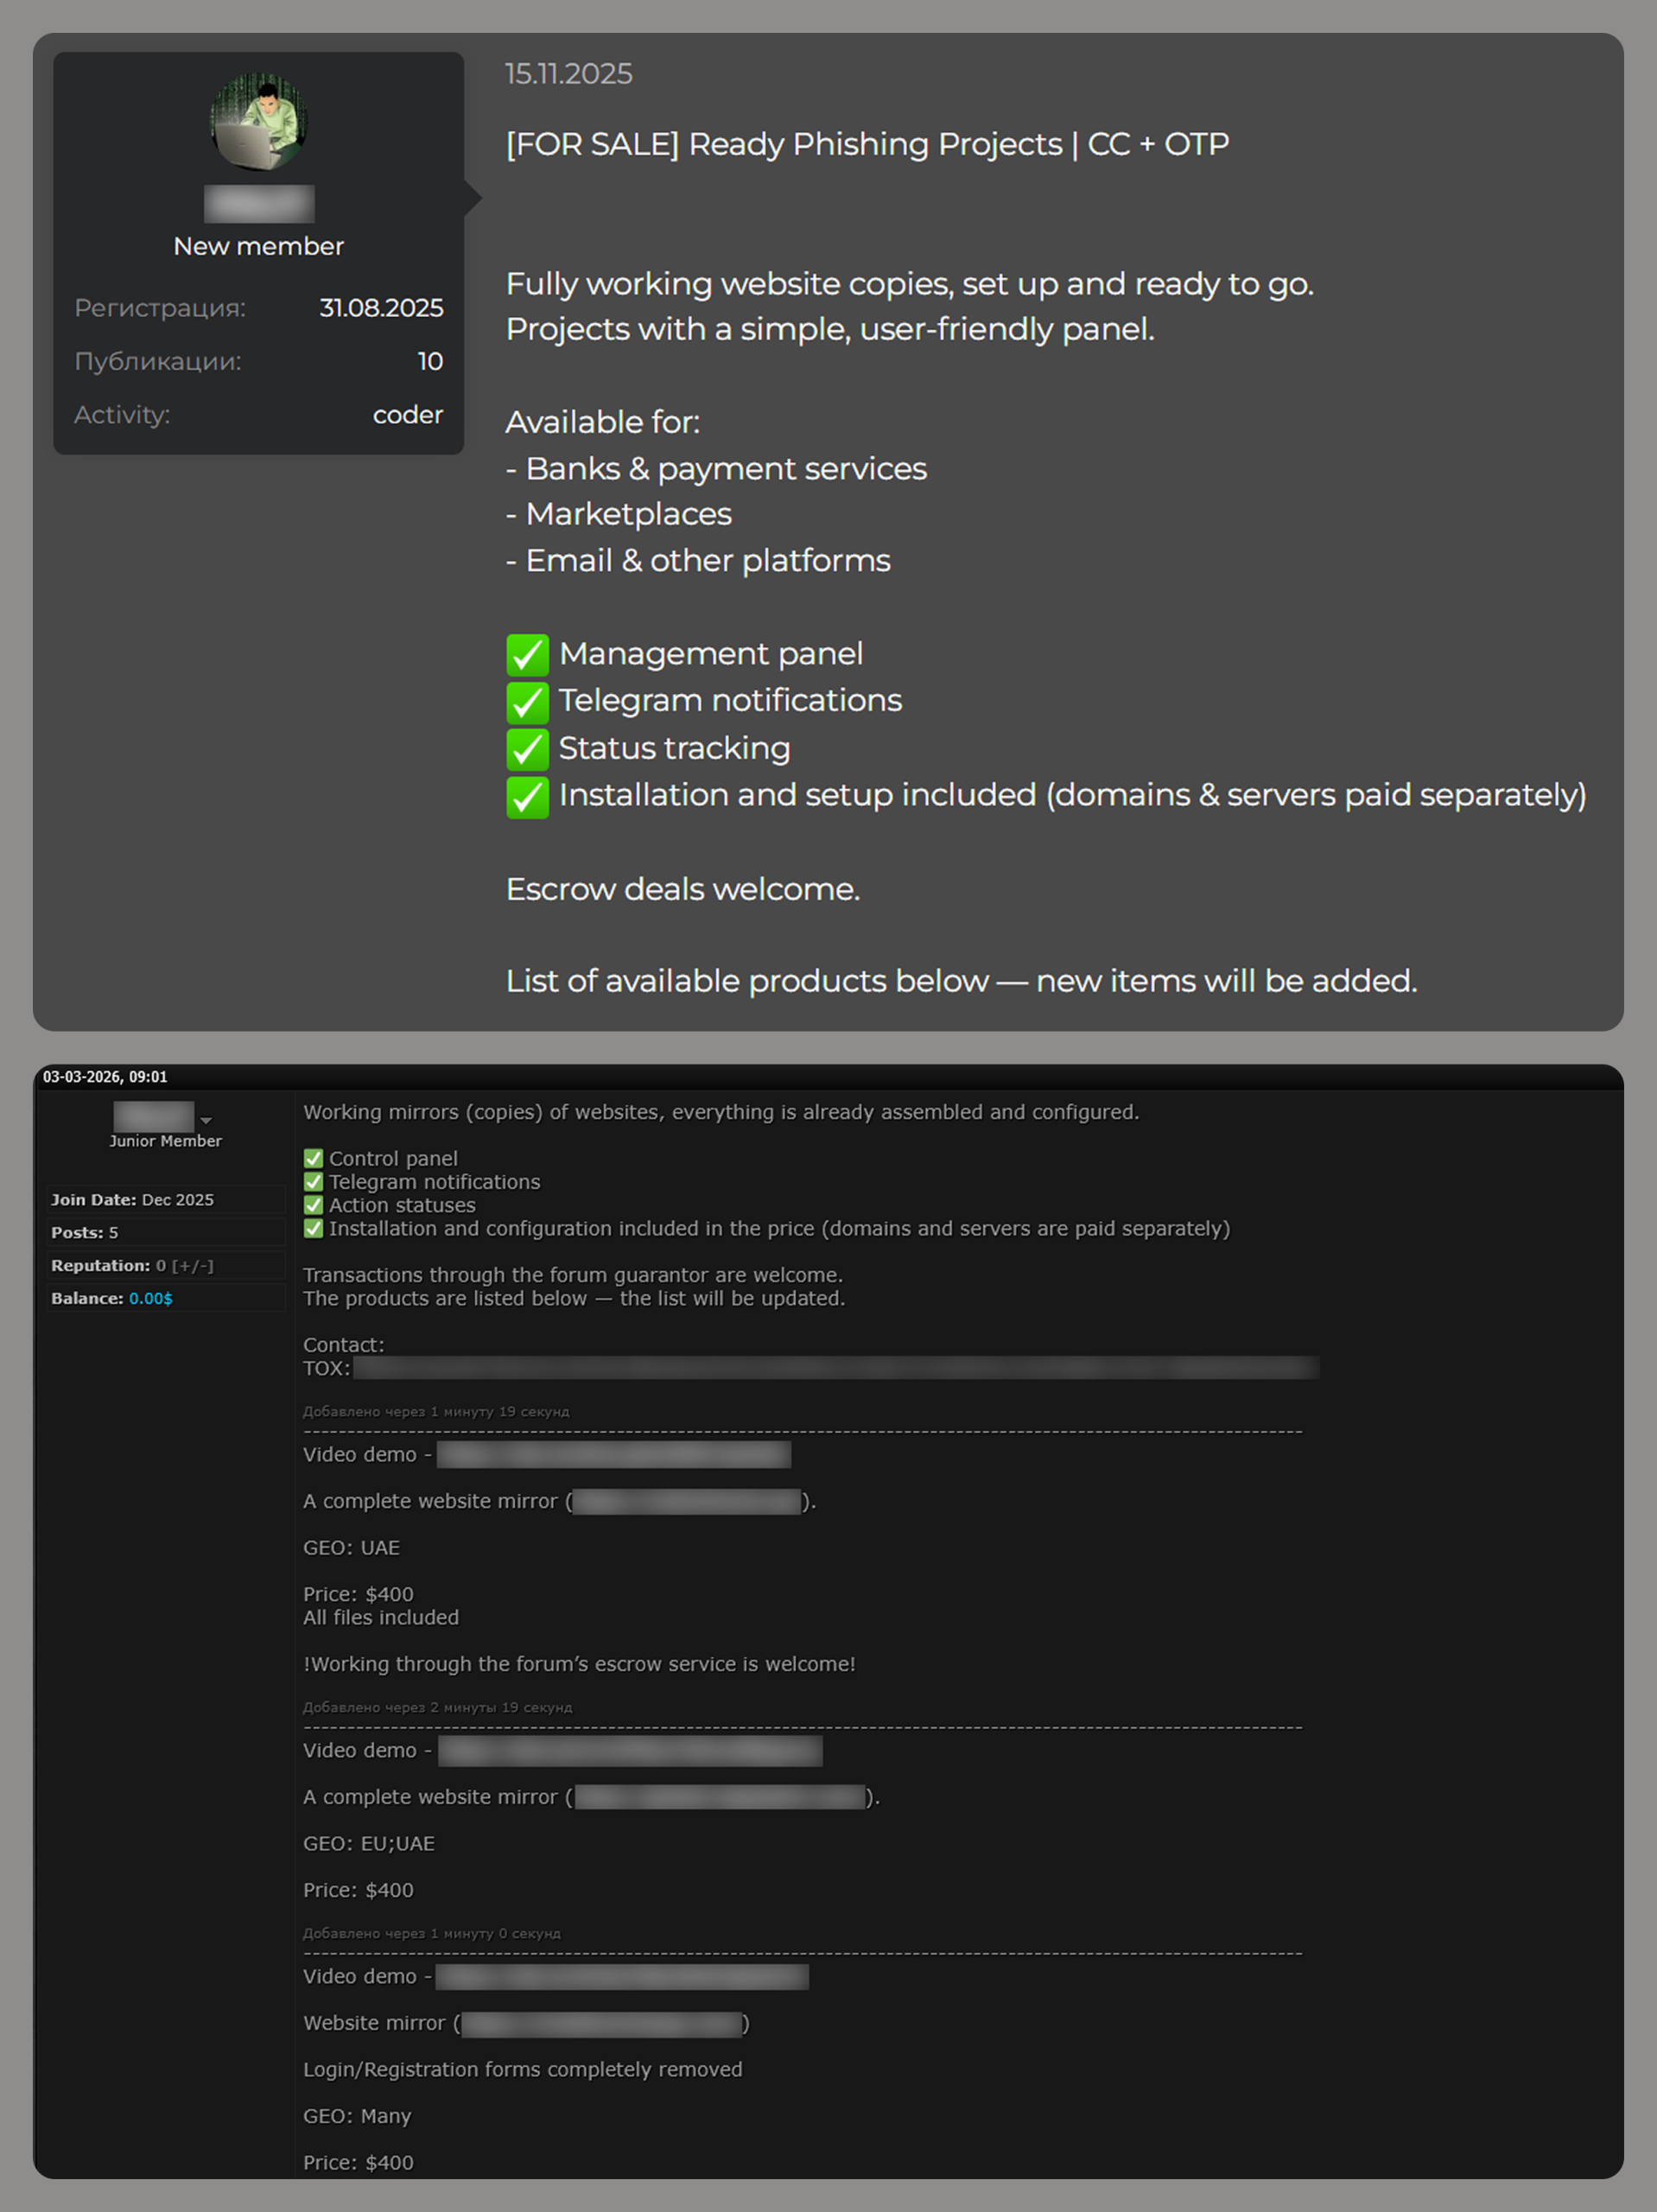
Distribution of published exploits by platform, Q1 2025 (download)

Distribution of published exploits by platform, Q2 2025 (download)

Distribution of published exploits by platform, Q3 2025 (download)

Distribution of published exploits by platform, Q4 2025 (download)

In Q4 2025, no public exploits for Microsoft Office products emerged; the bulk of the vulnerabilities were issues discovered in system components. When calculating our statistics, we placed these in the OS category.

Vulnerability exploitation in APT attacks

We analyzed which vulnerabilities were utilized in APT attacks during Q4 2025. The following rankings draw on our telemetry, research, and open-source data.

TOP 10 vulnerabilities exploited in APT attacks, Q4 2025 (download)

In Q4 2025, APT attacks most frequently exploited fresh vulnerabilities published within the last six months. We believe that these CVEs will remain favorites among attackers for a long time, as fixing them may require significant structural changes to the vulnerable applications or the user’s system. Often, replacing or updating the affected components requires a significant amount of resources. Consequently, the probability of an attack through such vulnerabilities may persist. Some of these new vulnerabilities are likely to become frequent tools for lateral movement within user infrastructure, as the corresponding security flaws have been discovered in network services that are accessible without authentication. This heavy exploitation of very recently registered vulnerabilities highlights the ability of threat actors to rapidly implement new techniques and adapt old ones for their attacks. Therefore, we strongly recommend applying the security patches provided by vendors.

C2 frameworks

In this section, we will look at the most popular C2 frameworks used by threat actors and analyze the vulnerabilities whose exploits interacted with C2 agents in APT attacks.

The chart below shows the frequency of known C2 framework usage in attacks against users during Q4 2025, according to open sources.

TOP 10 C2 frameworks used by APTs to compromise user systems in Q4 2025 (download)

Despite the significant footprints it can leave when used in its default configuration, Sliver continues to hold the top spot among the most common C2 frameworks in our Q4 2025 analysis. Mythic and Havoc were second and third, respectively. After reviewing open sources and analyzing malicious C2 agent samples that contained exploits, we found that the following vulnerabilities were used in APT attacks involving the C2 frameworks mentioned above:

  • CVE-2025-55182: a React2Shell vulnerability in React Server Components that allows an unauthenticated user to send commands directly to the server and execute them from RAM.
  • CVE-2023-36884: a vulnerability in the Windows Search component that allows the execution of commands on a system, bypassing security mechanisms built into Microsoft Office applications.
  • CVE-2025-53770: a critical insecure deserialization vulnerability in Microsoft SharePoint that allows an unauthenticated user to execute commands on the server.
  • CVE-2020-1472, also known as Zerologon, allows for compromising a vulnerable domain controller and executing commands as a privileged user.
  • CVE-2021-34527, also known as PrintNightmare, exploits flaws in the Windows print spooler subsystem, enabling remote access to a vulnerable OS and high-privilege command execution.
  • CVE-2025-8088 and CVE-2025-6218 are similar directory-traversal vulnerabilities that allow extracting files from an archive to a predefined path without the archiving utility notifying the user.

The set of vulnerabilities described above suggests that attackers have been using them for initial access and early-stage maneuvers in vulnerable systems to create a springboard for deploying a C2 agent. The list of vulnerabilities includes both zero-days and well-known, established security issues.

Notable vulnerabilities

This section highlights the most noteworthy vulnerabilities that were publicly disclosed in Q4 2025 and have a publicly available description.

React2Shell (CVE-2025-55182): a vulnerability in React Server Components

We typically describe vulnerabilities affecting a specific application. CVE-2025-55182 stood out as an exception, as it was discovered in React, a library primarily used for building web applications. This means that exploiting the vulnerability could potentially disrupt a vast number of applications that rely on the library. The vulnerability itself lies in the interaction mechanism between the client and server components, which is built on sending serialized objects. If an attacker sends serialized data containing malicious functionality, they can execute JavaScript commands directly on the server, bypassing all client-side request validation. Technical details about this vulnerability and an example of how Kaspersky solutions detect it can be found in our article.

CVE-2025-54100: command injection during the execution of curl (Invoke-WebRequest)

This vulnerability represents a data-handling flaw that occurs when retrieving information from a remote server: when executing the curl or Invoke-WebRequest command, Windows launches Internet Explorer in the background. This can lead to a cross-site scripting (XSS) attack.

CVE-2025-11001: a vulnerability in 7-Zip

This vulnerability reinforces the trend of exploiting security flaws found in file archivers. The core of CVE-2025-11001 lies in the incorrect handling of symbolic links. An attacker can craft an archive so that when it is extracted into an arbitrary directory, its contents end up in the location pointed to by a symbolic link. The likelihood of exploiting this vulnerability is significantly reduced because utilizing such functionality requires the user opening the archive to possess system administrator privileges.

This vulnerability was associated with a wave of misleading news reports claiming it was being used in real-world attacks against end users. This misconception stemmed from an error in the security bulletin.

RediShell (CVE-2025-49844): a vulnerability in Redis

The year 2025 saw a surge in high-profile vulnerabilities, several of which were significant enough to earn a unique nickname. This was the case with CVE-2025-49844, also known as RediShell, which was unveiled during a hacking competition. This vulnerability is a use-after-free issue related to how the load command functions within Lua interpreter scripts. To execute the attack, an attacker needs to prepare a malicious script and load it into the interpreter.

As with any named vulnerability, RediShell was immediately weaponized by threat actors and spammers, albeit in a somewhat unconventional manner. Because technical details were initially scarce following its disclosure, the internet was flooded with fake PoC exploits and scanners claiming to test for the vulnerability. In the best-case scenario, these tools were non-functional; in the worst, they infected the system. Notably, these fraudulent projects were frequently generated using LLMs. They followed a standardized template and often cross-referenced source code from other identical fake repositories.

CVE-2025-24990: a vulnerability in the ltmdm64.sys driver

Driver vulnerabilities are often discovered in legitimate third-party applications that have been part of the official OS distribution for a long time. Thus, CVE-2025-24990 has existed within code shipped by Microsoft throughout nearly the entire history of Windows. The vulnerable driver has been shipped since at least Windows 7 as a third-party driver for Agere Modem. According to Microsoft, this driver is no longer supported and, following the discovery of the flaw, was removed from the OS distribution entirely.

The vulnerability itself is straightforward: insecure handling of IOCTL codes leading to a null pointer dereference. Successful exploitation can lead to arbitrary command execution or a system crash resulting in a blue screen of death (BSOD) on modern systems.

CVE-2025-59287: a vulnerability in Windows Server Update Services (WSUS)

CVE-2025-59287 represents a textbook case of insecure deserialization. Exploitation is possible without any form of authentication; due to its ease of use, this vulnerability rapidly gained traction among threat actors. Technical details and detection methodologies for our product suite have been covered in our previous advisories.

Conclusion and advice

In Q4 2025, the rate of vulnerability registration has shown no signs of slowing down. Consequently, consistent monitoring and the timely application of security patches have become more critical than ever. To ensure resilient defense, it is vital to regularly assess and remediate known vulnerabilities while implementing technology designed to mitigate the impact of potential exploits.

Continuous monitoring of infrastructure, including the network perimeter, allows for the timely identification of threats and prevents them from escalating. Effective security also demands tracking the current threat landscape and applying preventative measures to minimize risks associated with system flaws. Kaspersky Next serves as a reliable partner in this process, providing real-time identification and detailed mapping of vulnerabilities within the environment.

Securing the workplace remains a top priority. Protecting corporate devices requires the adoption of solutions capable of blocking malware and preventing it from spreading. Beyond basic measures, organizations should implement adaptive systems that allow for the rapid deployment of security updates and the automation of patch management workflows.

  • ✇Securelist
  • Mobile malware evolution in 2025 Anton Kivva
    Starting from the third quarter of 2025, we have updated our statistical methodology based on the Kaspersky Security Network. These changes affect all sections of the report except for the installation package statistics, which remain unchanged. To illustrate trends between reporting periods, we have recalculated the previous year’s data; consequently, these figures may differ significantly from previously published numbers. All subsequent reports will be generated using this new methodology, en
     

Mobile malware evolution in 2025

4 de Março de 2026, 07:00

Starting from the third quarter of 2025, we have updated our statistical methodology based on the Kaspersky Security Network. These changes affect all sections of the report except for the installation package statistics, which remain unchanged.

To illustrate trends between reporting periods, we have recalculated the previous year’s data; consequently, these figures may differ significantly from previously published numbers. All subsequent reports will be generated using this new methodology, ensuring accurate data comparisons with the findings presented in this article.

Kaspersky Security Network (KSN) is a global network for analyzing anonymized threat intelligence, voluntarily shared by Kaspersky users. The statistics in this report are based on KSN data unless explicitly stated otherwise.

The year in figures

According to Kaspersky Security Network, in 2025:

  • Over 14 million attacks involving malware, adware or unwanted mobile software were blocked.
  • Adware remained the most prevalent mobile threat, accounting for 62% of all detections.
  • Over 815 thousand malicious installation packages were detected, including 255 thousand mobile banking Trojans.

The year’s highlights

In 2025, cybercriminals launched an average of approximately 1.17 million attacks per month against mobile devices using malicious, advertising, or unwanted software. In total, Kaspersky solutions blocked 14,059,465 attacks throughout the year.

Attacks on Kaspersky mobile users in 2025 (download)

Beyond the malware mentioned in previous quarterly reports, 2025 saw the discovery of several other notable Trojans. Among these, in Q4 we uncovered the Keenadu preinstalled backdoor. This malware is integrated into device firmware during the manufacturing stage. The malicious code is injected into libandroid_runtime.so – a core library for the Android Java runtime environment – allowing a copy of the backdoor to enter the address space of every app running on the device. Depending on the specific app, the malware can then perform actions such as inflating ad views, displaying banners on behalf of other apps, or hijacking search queries. The functionality of Keenadu is virtually unlimited, as its malicious modules are downloaded dynamically and can be updated remotely.

Cybersecurity researchers also identified the Kimwolf IoT botnet, which specifically targets Android TV boxes. Infected devices are capable of launching DDoS attacks, operating as reverse proxies, and executing malicious commands via a reverse shell. Subsequent analysis revealed that Kimwolf’s reverse proxy functionality was being leveraged by proxy providers to use compromised home devices as residential proxies.

Another notable discovery in 2025 was the LunaSpy Trojan.

LunaSpy Trojan, distributed under the guise of an antivirus app

LunaSpy Trojan, distributed under the guise of an antivirus app

Disguised as antivirus software, this spyware exfiltrates browser passwords, messaging app credentials, SMS messages, and call logs. Furthermore, it is capable of recording audio via the device’s microphone and capturing video through the camera. This threat primarily targeted users in Russia.

Mobile threat statistics

815,735 new unique installation packages were observed in 2025, showing a decrease compared to the previous year. While the decline in 2024 was less pronounced, this past year saw the figure drop by nearly one-third.

Detected Android-specific malware and unwanted software installation packages in 2022–2025 (download)

The overall decrease in detected packages is primarily due to a reduction in apps categorized as not-a-virus. Conversely, the number of Trojans has increased significantly, a trend clearly reflected in the distribution data below.

Detected packages by type

Distribution* of detected mobile software by type, 2024–2025 (download)

* The data for the previous year may differ from previously published data due to some verdicts being retrospectively revised.

A significant increase in Trojan-Banker and Trojan-Spy apps was accompanied by a decline in AdWare and RiskTool files. The most prevalent banking Trojans were Mamont (accounting for 49.8% of apps) and Creduz (22.5%). Leading the persistent adware category were MobiDash (39%), Adlo (27%), and HiddenAd (20%).

Share* of users attacked by each type of malware or unwanted software out of all users of Kaspersky mobile solutions attacked in 2024–2025 (download)

* The total may exceed 100% if the same users encountered multiple attack types.

Trojan-Banker malware saw a significant surge in 2025, not only in terms of unique file counts but also in the total number of attacks. Nevertheless, this category ranked fourth overall, trailing far behind the Trojan file category, which was dominated by various modifications of Triada and Fakemoney.

TOP 20 types of mobile malware

Note that the malware rankings below exclude riskware and potentially unwanted apps, such as RiskTool and adware.

Verdict % 2024* % 2025* Difference in p.p. Change in ranking
Trojan.AndroidOS.Triada.fe 0.04 9.84 +9.80
Trojan.AndroidOS.Triada.gn 2.94 8.14 +5.21 +6
Trojan.AndroidOS.Fakemoney.v 7.46 7.97 +0.51 +1
DangerousObject.Multi.Generic 7.73 5.83 –1.91 –2
Trojan.AndroidOS.Triada.ii 0.00 5.25 +5.25
Trojan-Banker.AndroidOS.Mamont.da 0.10 4.12 +4.02
Trojan.AndroidOS.Triada.ga 10.56 3.75 –6.81 –6
Trojan-Banker.AndroidOS.Mamont.db 0.01 3.53 +3.51
Backdoor.AndroidOS.Triada.z 0.00 2.79 +2.79
Trojan-Banker.AndroidOS.Coper.c 0.81 2.54 +1.72 +35
Trojan-Clicker.AndroidOS.Agent.bh 0.34 2.48 +2.14 +74
Trojan-Dropper.Linux.Agent.gen 1.82 2.37 +0.55 +4
Trojan.AndroidOS.Boogr.gsh 5.41 2.06 –3.35 –8
DangerousObject.AndroidOS.GenericML 2.42 1.97 –0.45 –3
Trojan.AndroidOS.Triada.gs 3.69 1.93 –1.76 –9
Trojan-Downloader.AndroidOS.Agent.no 0.00 1.87 +1.87
Trojan.AndroidOS.Triada.hf 0.00 1.75 +1.75
Trojan-Banker.AndroidOS.Mamont.bc 1.13 1.65 +0.51 +8
Trojan.AndroidOS.Generic. 2.13 1.47 –0.66 –6
Trojan.AndroidOS.Triada.hy 0.00 1.44 +1.44

* Unique users who encountered this malware as a percentage of all attacked users of Kaspersky mobile solutions.

The list is largely dominated by the Triada family, which is distributed via malicious modifications of popular messaging apps. Another infection vector involves tricking victims into installing an official messaging app within a “customized virtual environment” that supposedly offers enhanced configuration options. Fakemoney scam applications, which promise fraudulent investment opportunities or fake payouts, continue to target users frequently, ranking third in our statistics. Meanwhile, the Mamont banking Trojan variants occupy the 6th, 8th, and 18th positions by number of attacks. The Triada backdoor preinstalled in the firmware of certain devices reached the 9th spot.

Region-specific malware

This section describes malware families whose attack campaigns are concentrated within specific countries.

Verdict Country* %**
Trojan-Banker.AndroidOS.Coper.a Türkiye 95.74
Trojan-Dropper.AndroidOS.Hqwar.bj Türkiye 94.96
Trojan.AndroidOS.Thamera.bb India 94.71
Trojan-Proxy.AndroidOS.Agent.q Germany 93.70
Trojan-Banker.AndroidOS.Coper.c Türkiye 93.42
Trojan-Banker.AndroidOS.Rewardsteal.lv India 92.44
Trojan-Banker.AndroidOS.Rewardsteal.jp India 92.31
Trojan-Banker.AndroidOS.Rewardsteal.ib India 91.91
Trojan-Dropper.AndroidOS.Rewardsteal.h India 91.45
Trojan-Banker.AndroidOS.Rewardsteal.nk India 90.98
Trojan-Dropper.AndroidOS.Agent.sm Türkiye 90.34
Trojan-Dropper.AndroidOS.Rewardsteal.ac India 89.38
Trojan-Banker.AndroidOS.Rewardsteal.oa India 89.18
Trojan-Banker.AndroidOS.Rewardsteal.ma India 88.58
Trojan-Spy.AndroidOS.SmForw.ko India 88.48
Trojan-Dropper.AndroidOS.Pylcasa.c Brazil 88.25
Trojan-Dropper.AndroidOS.Hqwar.bf Türkiye 88.15
Trojan-Banker.AndroidOS.Agent.pp India 87.85

* Country where the malware was most active.
** Unique users who encountered the malware in the indicated country as a percentage of all users of Kaspersky mobile solutions who were attacked by the same malware.

Türkiye saw the highest concentration of attacks from Coper banking Trojans and their associated Hqwar droppers. In India, Rewardsteal Trojans continued to proliferate, exfiltrating victims’ payment data under the guise of monetary giveaways. Additionally, India saw a resurgence of the Thamera Trojan, which we previously observed frequently attacking users in 2023. This malware hijacks the victim’s device to illicitly register social media accounts.

The Trojan-Proxy.AndroidOS.Agent.q campaign, concentrated in Germany, utilized a compromised third-party application designed for tracking discounts at a major German retail chain. Attackers monetized these infections through unauthorized use of the victims’ devices as residential proxies.

In Brazil, 2025 saw a concentration of Pylcasa Trojan attacks. This malware is primarily used to redirect users to phishing pages or illicit online casino sites.

Mobile banking Trojans

The number of new banking Trojan installation packages surged to 255,090, representing a several-fold increase over previous years.

Mobile banking Trojan installation packages detected by Kaspersky in 2022–2025 (download)

Notably, the total number of attacks involving bankers grew by 1.5 times, maintaining the same growth rate seen in the previous year. Given the sharp spike in the number of unique malicious packages, we can conclude that these attacks yield significant profit for cybercriminals. This is further evidenced by the fact that threat actors continue to diversify their delivery channels and accelerate the production of new variants in an effort to evade detection by security solutions.

TOP 10 mobile bankers

Verdict % 2024* % 2025* Difference in p.p. Change in ranking
Trojan-Banker.AndroidOS.Mamont.da 0.86 15.65 +14.79 +28
Trojan-Banker.AndroidOS.Mamont.db 0.12 13.41 +13.29
Trojan-Banker.AndroidOS.Coper.c 7.19 9.65 +2.46 +2
Trojan-Banker.AndroidOS.Mamont.bc 10.03 6.26 –3.77 –3
Trojan-Banker.AndroidOS.Mamont.ev 0.00 4.10 +4.10
Trojan-Banker.AndroidOS.Coper.a 9.04 4.00 –5.04 –4
Trojan-Banker.AndroidOS.Mamont.ek 0.00 3.73 +3.73
Trojan-Banker.AndroidOS.Mamont.cb 0.64 3.04 +2.40 +26
Trojan-Banker.AndroidOS.Faketoken.pac 2.17 2.95 +0.77 +5
Trojan-Banker.AndroidOS.Mamont.hi 0.00 2.75 +2.75

* Unique users who encountered this malware as a percentage of all users of Kaspersky mobile solutions who encountered banking threats.

In 2025, we observed a massive surge in activity from Mamont banking Trojans. They accounted for approximately half of all new apps in their category and also were utilized in half of all banking Trojan attacks.

Conclusion

The year 2025 saw a continuing trend toward a decline in total unique unwanted software installation packages. However, we noted a significant year-over-year increase in specific threats – most notably mobile banking Trojans and spyware – even though adware remained the most frequently detected threat overall.

Among the mobile threats detected, we have seen an increased prevalence of preinstalled backdoors, such as Triada and Keenadu. Consistent with last year’s findings, certain mobile malware families continue to proliferate via official app stores. Finally, we have observed a growing interest among threat actors in leveraging compromised devices as proxies.

❌
❌