Visualização normal

Ontem — 8 de Setembro de 2026SOC Prime Blog
  • ✇SOC Prime Blog
  • Projects in Agentic Threat Research: Context That Sticks SOC Prime Team
    Every investigation starts the same way — re-explaining your environment, your log sources, your detection standards, before you can even get to the actual analysis. Multiply that setup tax across every new chat you open for the same investigation, and you’re spending more time re-briefing the AI than hunting threats. Projects solves this. Available within Agentic Threat Research — the AI-assisted workspace in Prime Architect for detection engineering and threat research — Projects let you g
     

Projects in Agentic Threat Research: Context That Sticks

7 de Setembro de 2026, 12:23

Every investigation starts the same way — re-explaining your environment, your log sources, your detection standards, before you can even get to the actual analysis. Multiply that setup tax across every new chat you open for the same investigation, and you’re spending more time re-briefing the AI than hunting threats.

Projects solves this. Available within Agentic Threat Research — the AI-assisted workspace in Prime Architect for detection engineering and threat research — Projects let you group multiple chats under a single shared context, so you only have to set the stage once. Define your data schema, log sources, detection structure, and expected output up front, and every chat in that project automatically inherits it. No more re-pasting the same background into every new session — the AI already knows how your environment works before you type your first question.

Think of a project as a workspace built around a specific investigation focus — a threat campaign, your or a customer environment, a detection engineering initiative, an ongoing incident. Everything the AI needs to reason correctly about that focus lives in one place, and every chat inside it starts from that same, fully-briefed baseline. Projects sit right in the left panel of Agentic Threat Research alongside your regular chats, and everything you already rely on there — custom prompts as well as the built-in Agentic AI tools — works the same way inside a project, just with your context already applied.

Contact Sales

Why It Matters

  • Consistency across your own investigations. Every chat you open inside a project starts from the same baseline context, so your results stay comparable and repeatable across sessions, instead of depending on what you happened to type into the prompt that day.
  • Faster investigations. Skip the setup tax entirely. Open a new chat and get straight to the analysis — the context is already loaded, so the AI can go from question to answer instead of question to clarifying-question.
  • Institutional knowledge, built in. Upload your internal playbooks, incident reports, environment documentation, and other security-related reference materials so the AI reasons with your organization’s actual standards and history, not generic assumptions about how a SOC should work.
  • Precision by design. Set rules once — clarify assumptions before acting, require precise technical language, suggest tuning ideas for noisy detections — and every chat in the project follows them automatically, without you having to repeat yourself.
  • A dedicated workspace per investigation. Keep separate projects for separate focuses — a threat campaign, your or a customer environment, a detection engineering initiative — so the context loaded into each one is always exactly what that investigation needs, without unrelated work affecting it.

A Quick Example

Say you’re running a project focused on lateral movement detection. You attach your data schema so the AI understands your field naming conventions, list out your log sources (EDR, VPN, identity provider, and firewall logs) so it knows what evidence is actually available, and upload your detection structure and expected output template so every finding comes back in the same format you use for triage. You also drop in a couple of relevant internal playbooks and prior incident reports covering similar activity. From that point forward, every new chat you open in that project can answer questions like “does this authentication pattern match known lateral movement TTPs in our environment?” grounded in your actual data model and your own case history — not a generic response — without you having to re-explain any of it.

Getting Started

  1. Create a project. In Prime Architect, go to the Agentic Threat Research mode, select Projects in the left panel, and then select Create Project. Give it a name.
  1. Define the shared context. Pick either or both:
  • Instructions: Click the pencil icon in the Instructions section and write a prompt describing how the AI should behave in this project — for example, your data schema, log source details, detection structure and expected output format, or key rules like clarifying assumptions and using precise technical language. Select Save. You can revisit and edit this anytime via the same pencil icon.
  • Resources: Click the plus (+) icon in the Resources section, select Upload Files, and attach your reference material — playbooks, incident reports, environment docs, or other security references. You can upload up to 5 files, each up to 15 MB and 500k tokens. Supported formats: PDF, TXT, CSV, JSON, PNG, JPG/JPEG (PDFs up to 1,000 pages). 

Everything you add here applies automatically to every chat in the project.

  1. Start working. Open the project and start a new chat — it inherits the context immediately, no extra steps required. All chats you create within the project are grouped together and available under the chat panel, so your investigation history stays organized in one view instead of scattered across a general chat list.
  1. Keep it organized. As a project grows, you can rename or delete individual chats at any time — just click the three-dot menu next to a chat and select the option you need. This makes it easy to keep active investigations clearly labeled and archive ones that are closed out, without losing the shared context that the rest of the project still relies on.

Set the context once. Investigate faster, every time after.


The post Projects in Agentic Threat Research: Context That Sticks appeared first on SOC Prime.

  • ✇SOC Prime Blog
  • From Raw Threat Reports to Actionable Defense: AI-Powered Deep Threat Research SOC Prime Team
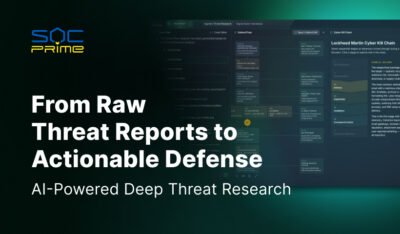
    Security teams are drowning in threat reports. Every week brings a new advisory, a new vendor write-up, a new blog post describing the latest campaign — and every one of them demands hours of manual reading, cross-referencing, and translation into something your SOC can actually act on. Deep Threat Research changes that equation entirely. Deep Threat Research is an agentic AI tool available within Agentic Threat Research mode in Prime Architect. It takes any threat report and instantly trans
     

From Raw Threat Reports to Actionable Defense: AI-Powered Deep Threat Research

7 de Setembro de 2026, 12:16

Security teams are drowning in threat reports. Every week brings a new advisory, a new vendor write-up, a new blog post describing the latest campaign — and every one of them demands hours of manual reading, cross-referencing, and translation into something your SOC can actually act on. Deep Threat Research changes that equation entirely.

Deep Threat Research is an agentic AI tool available within Agentic Threat Research mode in Prime Architect. It takes any threat report and instantly transforms it into structured, decision-ready threat intelligence — complete with a clear threat summary, precise MITRE ATT&CK mappings, and a full set of interactive visualizations that show exactly how an adversary operates. What used to take an analyst hours of manual triage now happens in minutes, freeing your team to focus on what matters most: threat detection and threat mitigation.

What Deep Threat Research Solves

Every threat report contains value, but that value is locked inside dense paragraphs of prose. Deep Threat Research unlocks it automatically. It reads the report the way your most experienced analyst would — extracting the adversary’s tactics, techniques, and procedures, identifying relevant indicators, and mapping everything against the MITRE ATT&CK framework — then hands you a complete intelligence package: investigation guidance, mitigation recommendations, response actions, associated threat actors, and even AI-generated detection rules ready for deployment.

Instead of starting from a blank page, your team starts from a fully-formed picture of the threat: who’s behind it, how it moves, what it touches, and how to stop it.

Contact Sales

What You Get

Once an analysis completes, results are generated and appear one after another. Some sections are ready to read right away, while others display as tiles you simply click to open and explore in more detail — just scroll down to move through the full analysis. Overall, Deep Threat Research organizes its findings into clear, digestible sections:

  • Summary – the essential facts of the threat, distilled from the report
  • Investigation – guided next steps for analysts
  • Mitigation – best-practice actions to reduce impact
  • Response – recommended steps once malicious activity is confirmed
  • Actors – the threat actors tied to the activity
  • MITRE ATT&CK Techniques – the specific behaviors and techniques adversaries used, mapped directly to the framework
  • Detections – existing SOC Prime Platform detections plus new AI-generated rules, ready to copy, translate into your SIEM’s language, validate, or save straight to your repository
  • Simulation – ready-made simulations of the malicious activity for testing your defenses

On top of that, four interactive visualizations bring the intelligence to life:

  • Attack Flow – the adversary’s full attack sequence based on MITRE ATT&CK, viewable as a diagram or matrix and exportable as MMD
  • Cyber Kill Chain – maps the threat across all seven Lockheed Martin stages, from Reconnaissance to Actions on Objectives, so you can spot detection opportunities at every phase
  • Pyramid of Pain – breaks down every extracted indicator into six tiers, from Hash Values and IP Addresses up through Domain Names, Network/Host Artifacts, Tools, and TTPs, so you can see at a glance how resilient your detection coverage really is
  • Diamond Model – connects the four pillars of any intrusion — Adversary, Capability, Victim, and Infrastructure — and shows how they link together

Getting Started

Getting from a raw report to full threat intelligence takes just a few steps:

  1. Open Prime Architect and select the Agentic Threat Research mode.
  2. Click Code Editor in the upper-right corner and paste in the text of your threat report. 
  3. Select Analyze.
  1. Choose Deep Threat Research from the list of analysis types.
  2. Click the Enter icon to run the analysis.

That’s it. Within moments, your results appear — summary, investigation and mitigation guidance, ATT&CK mappings, detections, simulation, and all four visualizations, ready to explore, click into, and act on.

The Value You Gain

Deep Threat Research doesn’t just summarize a report — it operationalizes it. By pairing AI-driven analysis with the structure of MITRE ATT&CK and the SOC Prime Platform’s detection library, it turns every threat report your team encounters into a springboard for faster investigation, sharper mitigation, and stronger detection coverage. Less time reading. More time defending.


The post From Raw Threat Reports to Actionable Defense: AI-Powered Deep Threat Research appeared first on SOC Prime.

Antes de ontemSOC Prime Blog
  • ✇SOC Prime Blog
  • Bring Your Files Into the Conversation SOC Prime Team
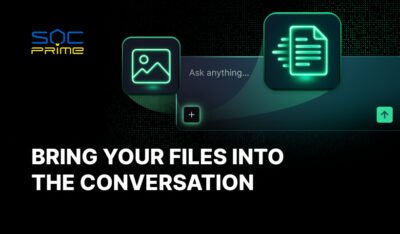
    Get more relevant, more accurate answers from Prime Architect by giving your AI agent the context it needs — no more copy-pasting excerpts or describing an incident from memory. In Prime Architect, every chat is a space to work through detection engineering and threat research tasks with AI, whether you’re writing a custom prompt or running one of the built-in Agentic AI tools. Now you can bring your own reference materials into that conversation directly: upload playbooks, incident reports, en
     

Bring Your Files Into the Conversation

28 de Agosto de 2026, 04:17

Get more relevant, more accurate answers from Prime Architect by giving your AI agent the context it needs — no more copy-pasting excerpts or describing an incident from memory. In Prime Architect, every chat is a space to work through detection engineering and threat research tasks with AI, whether you’re writing a custom prompt or running one of the built-in Agentic AI tools. Now you can bring your own reference materials into that conversation directly: upload playbooks, incident reports, environment documentation, screenshots, and other reference materials into your chat, and let the AI work from the real source.

Why It Matters

Better context means better output. When an AI tool works from your actual playbook, incident report, or environment documentation, its analysis is grounded in your real data rather than a secondhand summary. You can write your message and attach files together, and the AI agent treats the attached files as context for that message — whether you’re running a custom prompt or one of the purpose-built AI tools in Prime Architect. Instead of retyping the key details of an incident or manually condensing a lengthy report before you can even start your analysis, you simply hand the AI the source document and move straight to the insight.

Flexibility for every workflow. Not every analyst wants to work the same way. That’s why there are three different ways to attach a file — a manual upload button, drag and drop, and clipboard paste — so you can choose whichever fits your current task and habits. Dragging a report straight from your desktop, pasting a screenshot you just captured, or browsing for a file through the upload menu all lead to the same result: your AI agent working with richer, more accurate context.

Built for how security teams actually work. Detection engineers and threat researchers rarely start from a blank page — they start from an existing playbook, a prior incident write-up, environment documentation, or a screenshot of a suspicious event. This feature meets that reality head-on, letting you carry that material directly into your conversation instead of translating it into a prompt by hand.

How to Add a File

There are three simple ways to get a file into your chat message in Prime Architect.

Option 1: Upload manually

  1. Click the + icon in the chat input area and select Add Files and Images.
  1. Select a file from your device.
  2. The file appears in the input area and begins uploading.

Option 2: Drag and drop

  1. Locate the file on your computer — for example, in Finder or File Explorer.
  2. Drag the file into the chat panel in Prime Architect. You can drop it anywhere in the chat window, including the message history area or the input field.
  1. The file appears in the input area and begins uploading.

Option 3: Paste from clipboard

  1. Copy an image, screenshot, or file — take a screenshot, copy an image from another app, or select a file in your OS file explorer and press Cmd+C / Ctrl+C.
  2. Click into the chat input field to make it active.
  3. Paste using Cmd+V / Ctrl+V.
  4. The file appears in the input area and begins uploading.

A few things to know: You can attach up to 3 files per message, with a maximum size of 5 MB per file. Supported formats include PDF, TXT, CSV, JSON, PNG, and JPG/JPEG — covering the most common document, data, and image formats used in security workflows. Depending on the size of your files, it may take a moment to process them before they’re ready to be used as context, especially for documents with many images or visual elements.

Make It Part of Your Workflow

Whether it’s a playbook pulled from your files, a screenshot of a suspicious alert, or an incident report you’ve had open all day, getting it into Prime Architect takes just a click, a drag, or a paste. Stop summarizing your evidence — start uploading it, and let your AI agent do the deeper work.


The post Bring Your Files Into the Conversation appeared first on SOC Prime.

  • ✇SOC Prime Blog
  • LogTotal Public Preview: Free, Private Security Log Analysis in Under a Minute SOC Prime Team
    Security teams don’t have a data shortage — they have a data flood. A single incident can throw off hundreds of thousands, sometimes millions, of log events, and making sense of them under time pressure is exactly the kind of work that breaks people and tooling alike. SOC Prime built LogTotal to take that pressure off, without asking teams to hand over the raw evidence to do it. The problem: every “send us the logs” request is a privacy decision Endpoint events, identity logs, cloud a
     

LogTotal Public Preview: Free, Private Security Log Analysis in Under a Minute

26 de Agosto de 2026, 13:51

Security teams don’t have a data shortage — they have a data flood. A single incident can throw off hundreds of thousands, sometimes millions, of log events, and making sense of them under time pressure is exactly the kind of work that breaks people and tooling alike. SOC Prime built LogTotal to take that pressure off, without asking teams to hand over the raw evidence to do it.

The problem: every “send us the logs” request is a privacy decision

Endpoint events, identity logs, cloud audit trails, syslog, Windows Event Logs, application JSON — this is the raw material of detection, hunting, and response. When something breaks, the first ask is almost always the same: send the logs.

That request used to stay inside a closed environment. Now it rarely does. Logs get attached to vendor tickets, dropped into collaboration tools, uploaded to SaaS analyzers, pasted into AI chat windows, copied into shared workspaces. Each hop widens the circle of people, systems, and jurisdictions that can see the original values.

The risk is easy to miss because logs look operational rather than confidential. In practice, one authentication event can carry a username, a source IP, a workstation name, a session cookie, and a bearer token in an Authorization header. A payment-adjacent log can contain a PAN-shaped number. A Windows file path can leak a home-directory username. A field labeled UserName or x-api-key often holds the value in plain text, even when the rest of the line looks harmless. Under GDPR and similar regimes, most of that counts as personal data — and a leaked token or key isn’t a historical record, it’s a live access path.

Refuse to share the logs and you slow down the investigation. Share them raw and you risk violating policy, contracts, or regulation. Manual redaction doesn’t scale, isn’t consistent across analysts, and often strips out the exact identifiers an investigation needs to correlate events.

This isn’t hypothetical. SOC Prime built LogTotal partly in response to HuggingFace’s July 2026 security incident, in which the team’s attempt to send roughly 17,000 events to frontier AI models was blocked by guardrails — forcing a fallback to a local GLM model with GPU and VRAM requirements most organizations simply don’t have. LogTotal is built to handle that same job — at up to 1,700,000 events — without anyone needing frontier-model access or a private GPU cluster.

Why simple redaction doesn’t hold up

Most redaction approaches fail in one of two directions.

Static masking — turning every IP into the same placeholder, every user into USER — destroys the thing that makes investigation possible: correlation. If ten failed logons all collapse to the identical token, you can no longer tell a single compromised account from a credential-spray attack hitting ten different people.

Plain find-and-replace fails the other way. It misses values in unusual encodings or nested JSON, and it over-redacts things that only look sensitive — version numbers shaped like IPs, UUIDs used as message IDs, well-known non-sensitive hostnames. Unkeyed hashing doesn’t solve it either: a raw hash of a common value can be reversed by dictionary-guessing, and identical unsalted hashes across different organizations can accidentally link unrelated incidents together.

LogTotal was built to avoid both failure modes.

How it actually works

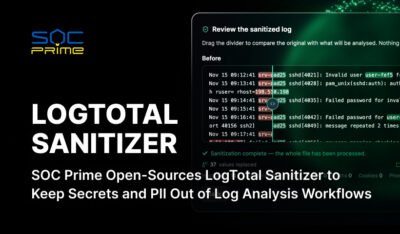
  1. Sanitization happens locally, in your browser, before anything is sent anywhere. You can download the sanitized log at any point — you always have a clean copy of exactly what was analyzed.
  2. Your files never leave your control unsanitized, and nothing is stored. LogTotal doesn’t retain your logs after analysis, and SOC Prime has no need to — the platform isn’t training on your data.
  3. Upload in your native format. LogTotal auto-detects EVTX, CEF, JSON/NDJSON, and syslog — no manual conversion.
  4. Your sanitized events are correlated at scale. LogTotal runs them against roughly 1,000,000 detection rules and a dataset of 13,000 labels, then applies Higher Order Sigma Rules and agentic AI correlation to connect related events into a coherent picture — up to 1.7 million events, in under a minute.
  5. You get an investigation, not a dump. Results are structured as findings on the LogTotal site, not a wall of raw matches.

However, log sanitization is only the first stage of LogTotal once it’s out of the preview. Coming soon is something even more powerful: sanitized logs checked against tens of thousands of behaviour rules, with matches correlated around Higher Order Sigma rules for active threats.

Where teams can use this

  • Incident response with external retainers. Sanitize a log packet with a key you retain. The retainer can still cluster hosts, users, and addresses — and you can map tokens back internally if a specific identity needs to be named in a privileged briefing.
  • Vendor support and TAC cases. “The log file that shows the error” is famous for containing environment details unrelated to the ticket. Sanitizing before you attach it cuts accidental disclosure without turning the file into noise.
  • Detection engineering and rule testing. Sample logs are how detections get written and validated — and how production identities leak into git history, CI artifacts, and demo environments. Sanitizing fixtures once, with a key shared inside the team, keeps examples correlatable while stripping secrets.
  • Pre-SIEM or pre-lake sharing. Not every pipeline needs a commercial processor to redact a batch file. For exports, one-off hunts, and cross-team handoffs, a local sanitizer is the control people will actually use.
  • GDPR and privacy reviews. Pseudonymization isn’t a blanket exemption, but replacing identifiers with keyed tokens before a file leaves the organization is a concrete technical measure — one you can point to and describe: what was removed, what was retained, how tokens were generated, who holds the key.
  • AI-assisted analysis without exposing raw telemetry. Whether the destination is LogTotal, an internal model, or a restricted vendor environment, the question is the same: does the model need the actual password, or does it need to know a secret was present and the same user touched three hosts?

Try LogTotal

The SOC Prime Platform exists to help security teams anticipate, detect, validate, and respond to threats faster. That mission has never required collecting customer secrets. LogTotal extends it to private event analysis at community scale. 

Security teams should not have to choose between a thorough investigation and a defensible data-handling story. Sanitize first. Correlate on tokens. Keep the key. Analyze the evidence that remains.

Explore LogTotal at https://logtotal.com

Join the SOC Prime Platform to improve visibility into threats most relevant to your business. To help you get started and drive immediate value, book a meeting now with SOC Prime experts.


The post LogTotal Public Preview: Free, Private Security Log Analysis in Under a Minute appeared first on SOC Prime.

  • ✇SOC Prime Blog
  • Attack Chains: See the Full Story Behind Every Threat SOC Prime Team
    Every day, your SOC drowns in isolated alerts — a suspicious login here, an odd process spawn there, a strange outbound connection somewhere else. Individually, each one looks like noise. Together, they might be the early signature of a coordinated adversary campaign already unfolding inside your environment. The problem isn’t a lack of data — it’s a lack of connection. Attack Chains changes that equation. Instead of asking your analysts to manually stitch together dozens of low-confidence s
     

Attack Chains: See the Full Story Behind Every Threat

12 de Agosto de 2026, 10:03

Every day, your SOC drowns in isolated alerts — a suspicious login here, an odd process spawn there, a strange outbound connection somewhere else. Individually, each one looks like noise. Together, they might be the early signature of a coordinated adversary campaign already unfolding inside your environment. The problem isn’t a lack of data — it’s a lack of connection.

Attack Chains changes that equation. Instead of asking your analysts to manually stitch together dozens of low-confidence signals, Attack Chains does it for them automatically — correlating historical scan results across your SIEM, EDR/XDR, and Data Lake (Prime Hunt), or real-time event streams as they’re generated, before that data even reaches your SIEM (Prime Detect). Either way, it doesn’t correlate against a static, generic rule set — it correlates against Active Threats: newly identified, real-world threats as they’re published to detect potential Attack Chains before they become confirmed incidents. That means your detection logic is only ever as current as the threat landscape itself. 

Where to find it: Attack Chains lives as its own tab inside both Prime Hunt and Prime Detect. If you’re working with historical data, go to Prime Hunt → Attack Chains. If you want real-time correlation before data hits your SIEM, go to Prime Detect → Attack Chains.

Always Watching for What’s New

Once you’re in Attack Chains, the Monitored Threats tab shows every Active Threat your environment is being correlated against. Attack Chains stays current without any effort on your part. The moment a new threat is identified in the wild, it’s already part of what your environment is being checked against — no waiting for a rule update, no manual research cycle. You still decide what matters most to your organization, focusing correlation on the threats most relevant to your industry or risk profile.

Enable or disable individual threats, or apply bulk actions to manage several at once — right from the Monitored Threats list — so your correlation scope always reflects what actually matters to your organization.

And if a threat’s detection coverage isn’t actually working — whether it hasn’t been scanned yet or a rule isn’t properly connected — you’ll see it right away, instead of finding out after the fact. Here’s what that looks like:

A green checkmark means a threat’s detection coverage is fully in place. An issue label flags a gap — click it to see exactly what’s missing.

The Picture Attack Chains Give You

Once a chain forms, it’s not just a correlated pile of events — it’s an investigation-ready story, at both a program-wide and case-by-case level.

At a glance, your Attack Chains Overview gives you a real-time pulse on your overall exposure: how many chains have been built, how many active threats are currently being watched, how many hosts are involved, and how much of your detection coverage is actually firing. It’s the kind of summary that turns “are we being targeted?” into a number you can check in seconds.

Click into any individual chain from the Attack Chains tab, and your team gets:

  • An AI-generated summary of the detected activity, so analysts get immediate context 
  • A visual timeline of adversary techniques, showing exactly how the attack progressed step by step — with techniques already confirmed by detection rules, plus activity caught through fuzzy pattern matching (Prime Hunt
  • Threat actor and technique attribution, mapped to industry-standard frameworks, so scoping and context-building start immediately instead of from scratch
  • A clear match, showing how closely the activity lines up with a known attack pattern — so your team knows exactly how seriously to treat it
  • Full asset and environment context — which host, which part of your infrastructure, and which of your data sources picked it up — so there’s no guessing where to look next
  • A direct path back into your existing tools, letting analysts pivot straight into the underlying events without losing time or context
  • A built-in investigation trail, tracking the status of the Attack Chain from first detected to fully resolved, and nothing falls through the cracks

Low-confidence noise is filtered out by the AI, so what reaches your team by default is what actually deserves their attention — with the option to dig into everything else whenever they choose to.

Bringing It All Together: Configuring Attack Chain Correlation

With the threat intelligence and the picture it produces in mind, here’s how you tell Attack Chains exactly how to correlate it:

  1. Set the chain-forming threshold — the minimum percentage of a threat’s technique sequence that must match before Attack Chains are formed
  2. Define the correlation window — how close together in time events must occur to be correlated
  3. Define the lookback window — how far back the engine searches when hunting for related events (Prime Hunt only)
  4. Choose your data sources — include or exclude the SIEM, EDR/XDR, and Data Lake sources (Prime Hunt) or topics (Prime Detect) feeding correlation, and optionally auto-enroll new ones as they’re added
  5. Review data-sharing settings — hostname data needs to be transmitted and stored for correlation to work, which may require explicit consent (Prime Hunt)
  6. Save and click Run — Attack Chain monitoring is live from that point on, continuously checking your environment against the newest threats as they emerge

CHECK AVAILABLE DETECTIONS


The post Attack Chains: See the Full Story Behind Every Threat appeared first on SOC Prime.

  • ✇SOC Prime Blog
  • Telemetry Pipeline: How It Works and Why It Matters in 2026 Steven Edwards
    A telemetry pipeline has become a core layer in modern security operations because teams no longer send data from applications, infrastructure, and cloud services straight into a single backend and hope for the best. In 2026, most environments are distributed across cloud, hybrid, and on-prem systems, which means more services, more data sources, more formats, and more operational complexity for teams that already struggle to keep visibility, control costs, and respond quickly.  Splunk’s State
     

Telemetry Pipeline: How It Works and Why It Matters in 2026

25 de Março de 2026, 08:31
Delemetry Data Pipeline

A telemetry pipeline has become a core layer in modern security operations because teams no longer send data from applications, infrastructure, and cloud services straight into a single backend and hope for the best. In 2026, most environments are distributed across cloud, hybrid, and on-prem systems, which means more services, more data sources, more formats, and more operational complexity for teams that already struggle to keep visibility, control costs, and respond quickly. 

Splunk’s State of Security 2025 found that 46% of security professionals spend more time maintaining tools than defending the organization. Cisco’s research adds that 59% deal with too many alerts, 55% face too many false positives, and 57% lose valuable investigation time because of gaps in data management. When too much raw telemetry flows into the stack without filtering, enrichment, or routing, the result is higher bills, slower investigations, and more noise for already stretched teams.

That is why telemetry pipelines are gaining momentum. They give organizations a control layer to normalize, enrich, route, and govern telemetry before it reaches SIEM, observability, or storage platforms. What began primarily as a way to control volume and cost is quickly becoming a must for modern security operations. Gartner suggests that by 2027, 40% of all log data will be processed through telemetry pipeline products, up from less than 20% in 2024.

As that model matures, the next logical step is not just to manage telemetry better, but to make it useful earlier. If teams are already adding a pipeline to reduce noise, control spend, and improve routing, it makes sense to move part of the detection process closer to the stream itself rather than waiting for every event to land in downstream tools first. Solutions like SOC Prime’s DetectFlow act as an additional detection layer running directly on the stream. Instead of using the pipeline only for transport and optimization, DetectFlow applies tens of thousands of Sigma rules on live Kafka streams with Apache Flink, tags and enriches events in flight, and helps teams act on higher-value signals much earlier in the flow.

What Is Telemetry?

Before talking about telemetry pipelines, it is important to define telemetry itself.

Telemetry is the evidence systems leave behind while they run. It shows how applications, infrastructure, and services behave in real time, including performance, failures, usage, and health. 

For enterprises, that evidence is valuable because it shows what users are actually experiencing, where bottlenecks form, when failures begin, and where suspicious activity starts to flicker. For security teams, telemetry is even more important because it becomes the raw material for detection, investigation, hunting, and response.

Put differently, telemetry is the trail of digital footprints your environment leaves behind. Useful on its own, but much more powerful when it is organized before the tracks disappear into the mud.

What Are the Main Types of Telemetry Data?

Most teams work with four main telemetry categories grouped under the MELT model: Metrics, Events, Logs, and Traces.

Metrics

Metrics are numerical measurements collected over time, such as CPU usage, memory consumption, latency, throughput, request volume, and error rate. They help teams track system health, identify trends, and spot anomalies before they become visible outages.

Events

Events capture notable actions or state changes inside a system. They usually mark something important that happened, such as a user login, a deployment, a configuration update, a purchase, or a failover. Events are especially useful because they often connect technical activity to business activity.

Logs

Logs are timestamped records of discrete activity inside an application, system, or service. They provide detailed evidence about what happened, when it happened, and often who or what triggered it. Logs are essential for debugging, troubleshooting, auditing, and security investigations.

Traces

Traces show the end-to-end path of a request as it moves across different services and components. They help teams understand how systems interact, how long each step takes, and where delays or failures occur. Traces are especially valuable in distributed systems and microservices environments.

Some platforms also break telemetry into more specific categories, such as requests, dependencies, exceptions, and availability signals. These help teams understand incoming operations, external service calls, failures, and uptime. 

Telemetry Data Pros and Cons

Telemetry data can be one of the most valuable assets in modern operations, but only when it is managed with purpose. Done well, it gives teams a real-time view of how systems behave, how users interact with services, and where risks or inefficiencies begin to form. Done poorly, it becomes just another stream of noisy, expensive data.

Telemetry Data Benefits

The biggest advantage of telemetry is visibility. By collecting and analyzing metrics, logs, traces, and events, teams can see what is happening across applications, infrastructure, and services in real time.

Key benefits include:

  • Real-time visibility into system health, performance, and user activity
  • Proactive issue detection by spotting anomalies before they turn into outages or incidents
  • Improved operational efficiency through automated monitoring and faster workflows
  • Faster troubleshooting by giving teams the context needed to identify root causes quickly
  • Better decision-making through data-backed insights for product, operations, and security teams

To get the full value, telemetry needs to be consolidated and handled consistently. A unified telemetry layer helps reduce mess across tools, improves scalability, and makes data easier to analyze and act on.

Telemetry Data Challenges

Telemetry also comes with real challenges, especially as data volumes grow. The most common ones include:

  • Security and privacy risks when sensitive data is collected or stored without strong controls
  • Legacy system integration across different formats, sources, and older technologies
  • Rising storage and ingestion costs when too much low-value data is kept in expensive platforms
  • Tool fragmentation makes correlation and investigation harder
  • Interoperability issues when systems do not follow consistent standards or schemas

This is exactly why telemetry strategy matters. The goal is not to collect more data for the sake of it, but to collect the right data, shape it early, and route it where it creates the most value. In cybersecurity, that difference is critical. The right telemetry can speed up detection and response, while unmanaged telemetry can bury important signals under cost and noise.

How to Analyze Telemetry Data 

The best way to analyze telemetry data is to stop treating analysis as the last step. In practice, good analysis starts much earlier, with clear goals, structured collection, smart routing, and storage policies that keep useful data accessible without flooding downstream tools. 

Define Goals

Start with the question behind the data. Are you trying to improve performance, reduce MTTR, monitor customer experience, detect security threats, or control SIEM costs? Once that is clear, decide which signals matter most and which KPIs will show progress. For a product team, that may be latency and error rate. For a SOC, it may be detection coverage, false positives, and investigation speed. This is also the stage to set privacy and compliance boundaries so teams know what data should be collected, masked, or excluded from the start. 

Configure Collection

Once goals are clear, configure the tools that will collect the right telemetry from the right places. That usually means deciding which applications, hosts, cloud services, APIs, endpoints, and identity systems should send logs, metrics, traces, and events. It also means setting practical rules for sampling, field selection, filtering, and schema consistency.

Shape and Route the Data 

Before data reaches SIEM, observability, or storage platforms, it should be shaped to fit the goal. That can mean normalizing records into consistent schemas, enriching events with identity or asset context, filtering noisy data, redacting sensitive fields, and routing each signal to the destination where it creates the most value.

Store Data With Intent

Not all telemetry needs the same retention period, storage tier, or query speed. High-value operational and security data may need to stay hot for rapid search and alerting, while bulk historical data can move to cheaper long-term storage. The key is to align retention with investigation needs, compliance obligations, and cost tolerance. 

Analyze, Alert, and Refine

Only after that foundation is in place does analysis become truly useful. Dashboards, alerts, anomaly detection, and visualizations work much better when the underlying telemetry is already clean, consistent, and routed with purpose. Machine learning and AI can make this process more effective by helping teams spot unusual patterns, detect anomalies faster, and identify changes that may be easy to miss in high-volume environments.

That is especially important in security operations, where the real challenge is turning telemetry into better decisions with less noise. This is exactly why a pipeline-based approach becomes so valuable. When telemetry is already being normalized, enriched, and routed upstream, analysis can start earlier, before raw events pile up in costly SIEM platforms.

Solutions like DetectFlow placе detection logic, threat correlation, and Agentic AI capabilities directly in the pipeline. At the pre-SIEM stage, DetectFlow can correlate events across log sources from multiple systems, while Flink Agent and AI help surface the attack chains that matter in real time and reduce false positives. In practice, that means teams can move detection left and deliver cleaner, richer, and more actionable signals downstream.

Telemetry and Monitoring: Main Difference

Telemetry and monitoring are closely related, but they are not the same thing. Telemetry is the process of collecting and transmitting data from systems and applications. It captures raw signals such as metrics, logs, traces, and events, then sends them to a central place for analysis. Monitoring is what teams do with that data to understand system health, performance, and availability. It turns telemetry into dashboards, alerts, and reports that help people act on what they see.

The difference matters because many organizations still build their strategy around dashboards and alerts alone. Monitoring is important, but it is only one use of telemetry. Security teams also rely on telemetry for investigation, hunting, root-cause analysis, and detection engineering. In other words, telemetry is the foundation, while monitoring is one of the ways that foundation is used.

In fact, telemetry is like the nervous system, constantly gathering signals from every part of the body. Monitoring is like the brain, interpreting those signals and deciding what needs attention. Telemetry feeds monitoring. Without telemetry, there is nothing to monitor. Without monitoring, telemetry remains a raw signal with no clear action attached.

What Is a Telemetry Pipeline?

A telemetry pipeline is the operating layer between telemetry sources and telemetry destinations. It collects signals from applications, hosts, cloud platforms, APIs, identity systems, endpoints, and networks, then processes that data before sending it onward.

The easiest way to think about it is that telemetry sources produce data, but the pipeline gives that data direction. Without a pipeline, downstream tools become catch-all warehouses. With a pipeline, telemetry can be standardized, routed by value, and governed according to policy. That is especially important for security operations, where one class of data may need real-time detection while another belongs in lower-cost retention or long-term investigation storage.

From a business perspective, the value is straightforward:

  • Lower cost by reducing unnecessary downstream ingestion
  • Better signal quality through normalization and enrichment
  • Less analyst fatigue by cutting noisy, low-value events earlier
  • More flexibility to send each data type where it creates the most value
  • Stronger governance through filtering, redaction, and policy-based routing


How Does the Telemetry Pipeline Work?

At a high level, a telemetry pipeline works through three core stages: ingest, process, and route. Together, these stages turn raw telemetry from many sources into clean, useful data to act on.

Ingest

The first stage is ingestion. This is where the pipeline collects telemetry from across the environment: applications, cloud services, containers, endpoints, identity systems, network tools, and infrastructure components. In modern environments, this stage must handle multiple signal types at once, including logs, metrics, traces, and events, often arriving at very different volumes and speeds.

Process

The second stage is processing, and this is where most of the value is created. Data is cleaned, normalized, enriched, filtered, and optimized before it reaches downstream systems. That can include removing duplicates, standardizing schemas, enriching records with identity or threat context, redacting sensitive fields, or reducing noisy data that creates cost without adding much value.

This is also where optimization and governance come in. Instead of treating all telemetry as equally important, teams can shape data according to business and security priorities. High-value signals can be enriched and preserved. Low-value records can be reduced, tiered, or dropped. Sensitive information can be handled according to the compliance policy. In other words, processing is where the pipeline stops being a transport mechanism and becomes a control mechanism. 

Route

The final stage is routing. Once telemetry has been shaped, the pipeline sends it to the right destinations. Security-relevant events may go to a SIEM or an in-stream detection layer. Operational metrics may go to observability tooling. Bulk logs may go to lower-cost storage. Archived data may be retained for compliance or long-term investigation. The point is that the same data no longer has to go everywhere in the same form.

By integrating collection, processing, and routing into one flow, a telemetry pipeline turns data from a flood into a controlled stream. It does not just move telemetry. It makes telemetry usable.

What Kind of Companies Need Telemetry Data Pipelines?

Any company running modern digital systems needs telemetry. The real difference is how urgently it needs to manage that telemetry well. Telemetry pipelines become especially important when blind spots are expensive, which usually means complex infrastructure, regulated data, customer-facing services, or constant security pressure. AWS’s observability guidance is explicitly built for cloud, hybrid, and on-prem environments, which already describes most enterprise estates.

That need shows up across many industries. Technology and SaaS companies rely on telemetry pipelines to protect uptime and customer experience. Financial institutions use them to monitor transactions, improve fraud detection, and keep audit data under control. Healthcare organizations use them to balance reliability with privacy and compliance. Retailers, telecom providers, manufacturers, logistics firms, and public-sector agencies need them because scale and continuity leave very little room for guesswork.

For security teams, the case is even sharper. Telemetry becomes the evidence layer behind detection, triage, investigation, and response. That is why the better question is no longer whether a company needs telemetry, but whether it is still treating telemetry like raw exhaust, or finally managing it like the strategic asset it has become.

How SOC Prime Turns Telemetry Pipelines Into Detection Pipelines

Telemetry pipelines started as a smarter way to move, shape, and control data before it reached expensive downstream platforms. SOC Prime extends that idea further with DetectFlow, which turns the pipeline into an active detection layer instead of using it only for transport and optimization. 

DetectFlow can run tens of thousands of Sigma detections on live Kafka streams, chain detections at line speed, drastically reduce the volume of potential alerts, and surface attack chains that are then further correlated and pre-triaged by Agentic AI before they hit the SIEM. It also brings real-time visibility, in-flight tagging and enrichment, and ensures infrastructure scalability that goes beyond traditional SIEM limits. That moves detection left, closer to the data, earlier in the flow, and far less dependent on costly downstream solutions.

For cybersecurity teams, that is the larger takeaway. Telemetry pipelines are not just an observability upgrade or a cost-control tactic. They are becoming a core part of modern cyber defense. And when detection logic, correlation, and AI move into the pipeline itself, telemetry stops being just something teams store and search later, instead acting on it in real time.


The post Telemetry Pipeline: How It Works and Why It Matters in 2026 appeared first on SOC Prime.

  • ✇SOC Prime Blog
  • SOC Prime Launches DetectFlow Enterprise To Enhance Security Data Pipelines with Agentic AI Andrii Bezverkhyi
    BOSTON, MA — March 12, 2026 — SOC Prime today announced the release of DetectFlow Enterprise, a solution that brings real-time threat detection to the ingestion layer, turning data pipelines into detection pipelines. Running tens of thousands of Sigma detections on live Kafka streams with millisecond MTTD using Apache Flink, DetectFlow Enterprise enables security teams to detect, tag, enrich, and correlate threat data in flight before data reaches downstream systems such as SIEM, EDR, and Data
     

SOC Prime Launches DetectFlow Enterprise To Enhance Security Data Pipelines with Agentic AI

12 de Março de 2026, 05:03
SOC Prime releases DetectFlow enterprise

BOSTON, MAMarch 12, 2026SOC Prime today announced the release of DetectFlow Enterprise, a solution that brings real-time threat detection to the ingestion layer, turning data pipelines into detection pipelines.

Running tens of thousands of Sigma detections on live Kafka streams with millisecond MTTD using Apache Flink, DetectFlow Enterprise enables security teams to detect, tag, enrich, and correlate threat data in flight before data reaches downstream systems such as SIEM, EDR, and Data Lakes. This gives organizations a way to expand detection coverage earlier in the processing flow, enrich security telemetry before downstream analysis, and scale detection on infrastructure they already have.

As detection volumes continue to grow, many SOC teams face the same set of operational challenges, such as delayed detections, rising ingestion costs, infrastructure bottlenecks, fragmented visibility across tools, and difficulty scaling rule coverage without adding more operational overhead. DetectFlow Enterprise is designed to address those pressures by moving detection closer to the data pipeline itself, where events can be inspected, enriched, and correlated in real time.

This release reflects a practical shift in how detection is operationalized. Rather than treating the pipeline as a transport layer alone, DetectFlow Enterprise turns it into an active part of the detection workflow. Teams can manage detections from cloud or local sources, stage and validate updates, and roll out changes safely with full traceability and zero downtime. This new architectural approach also establishes DetectFlow Enterprise as a foundation for unified CI/CD workflows across the SOC Prime Platform, supporting more scalable and efficient security operations.

Teams can also run thousands of detections directly on streaming pipelines with real-time visibility and in-flight tagging and enrichment. They can correlate events across multiple log sources at the pre-SIEM stage, helping surface the attack chains that matter in real time while reducing noise and false positives.

By performing correlation before data reaches the SIEM, DetectFlow Enterprise allows teams to evaluate full telemetry streams against thousands of rules without the performance and cost trade-offs of downstream ingestion. Built on SOC Prime’s Detection Intelligence dataset, shaped by 11 years of continuous threat research and detection engineering, DetectFlow uses Flink Agent to assemble detections, events, and relevant active threat context for AI-powered analysis. This helps security teams surface high-confidence attack chains, improve investigative clarity, and accelerate response to critical threats.

I have spent most of my career working across threat detection, SIEM, EDR, and SOC operations, and one challenge remained constant. Detection logic was always constrained by the performance and economics of the underlying stack. With DetectFlow Enterprise, we are giving teams a way to move beyond those constraints by turning the data pipeline into an active detection layer, running rules at stream speed, enriching telemetry in flight, and helping organizations scale detection without rearchitecting the rest of their security environment.

Andrii Bezverkhyi, CEO and Founder of SOC Prime

DetectFlow is designed to work with existing ingestion architecture, requiring no changes to established SIEM workflows. It supports both air-gapped and cloud-connected deployments, allowing organizations to keep data under their control while extending detection across the broader security ecosystem. It can achieve an MTTD of 0.005–0.01 seconds and help organizations increase rule capacity on existing infrastructure by up to ten times.

About SOC Prime

SOC Prime has built and operates the world’s largest AI-Native Detection Intelligence Platform for SOC teams. Trusted by over 11,000 organizations, the company delivers real-time, cross-platform detection intelligence that helps security teams to anticipate, detect, validate, and respond to cyber threats faster and more effectively.

Pioneering Security-as-Code approach, SOC Prime’s Detection Intelligence is applied to over 56 SIEM, EDR, Data Lake, and Data Pipeline platforms. The company continuously improves its breadth and quality of threat coverage, shipping top-quality signals for AI SOCs and security analysts.

For more information, visit https://socprime.com or follow us on LinkedIn & X.


The post SOC Prime Launches DetectFlow Enterprise To Enhance Security Data Pipelines with Agentic AI appeared first on SOC Prime.

  • ✇SOC Prime Blog
  • What Is a Security Data Pipeline Platform: Key Benefits for Modern SOC Steven Edwards
    Security teams are drowning in telemetry: cloud logs, endpoint events, SaaS audit trails, identity signals, and network data. Yet many programs still push everything into a SIEM, hoping detections will sort it out later. The problem is that “more data in the SIEM” doesn’t automatically translate into better detection. It often translates into chaos. Many SOCs admit they don’t even know what they’ll do with all that data once it’s ingested. The SANS 2025 Global SOC Survey reports that 42% of SOC
     

What Is a Security Data Pipeline Platform: Key Benefits for Modern SOC

24 de Fevereiro de 2026, 13:23

Security teams are drowning in telemetry: cloud logs, endpoint events, SaaS audit trails, identity signals, and network data. Yet many programs still push everything into a SIEM, hoping detections will sort it out later.

The problem is that “more data in the SIEM” doesn’t automatically translate into better detection. It often translates into chaos. Many SOCs admit they don’t even know what they’ll do with all that data once it’s ingested. The SANS 2025 Global SOC Survey reports that 42% of SOCs dump all incoming data into a SIEM without a plan for retrieval or analysis. Without upstream control over quality, structure, and routing, the SIEM becomes a dumping ground where messy inputs create messy outcomes: false positives, brittle detections, and missing context when it matters most.

That pressure shows up directly in the analyst experience. A Devo survey found that 83% of cyber defenders are overwhelmed by alert volume, false positives, and missing context, and 85% spend substantial time gathering and connecting evidence just to make alerts actionable. Even the mechanics of SIEM-based detection can work against you. Events must be collected, parsed, indexed, and stored before they’re reliably searchable and correlatable.

Cost is part of the same story. Forrester notes that “How do we reduce our SIEM ingest costs?” is one of the top inquiry questions it gets from clients. The practical answer is data pipeline management for security: route, reduce, redact, enrich, and transform logs before they hit the SIEM. Done well, this reduces spend and makes telemetry usable by enforcing consistent fields, stable schemas, and healthier pipelines so data turns into detections.

The demand pushes security teams to borrow a familiar idea from the data world. ETL stands for Extract, Transform, Load. It pulls data from multiple sources, transforms it into a consistent format, and then loads it into a target system for analytics and reporting. IBM describes ETL as a way to consolidate and prepare data, and notes that ETL is often batch-oriented and can be time-consuming when updates need to be frequent. Security increasingly needs the real-time version of this concept because a security signal loses value when it arrives late.

That is why event streaming has become so relevant. Apache Kafka sees event streaming as capturing events in real time, storing streams durably, processing them in real time or later, and routing them to different destinations. In security terms, this means you can normalize and enrich telemetry before detections depend on it, monitor telemetry health so the SOC does not go blind, and route the right data to the right place for response, hunting, or retention.

This is where Security Data Pipeline Platforms (SDPP) enter the picture. An SDPP is the solution located between sources and destinations that turns raw telemetry into governed, security-ready data. It handles ingestion, normalization, enrichment, routing, tiering, and data health so downstream systems can rely on clean and consistent events instead of compensating for broken schemas and missing context.

What Is a Security Data Pipeline Platform (SDPP)?

A Security Data Pipeline Platform (SDPP) is a centralized system that ingests security telemetry from many sources, processes it in-flight, and delivers it to one or more destinations, including SIEM, XDR, SOAR, and Data Lakes. The SDPP job is to take raw security data as it arrives, shape it properly, and deliver it downstream in a form that is consistent, enriched, and ready for detection and response. The shift is subtle but important. Instead of treating log management as “collect and store,” an SDPP treats it as “collect, improve, then distribute.”

In practice, SDPPs commonly support:

  • Collection from agents, APIs, syslog, cloud streams, and message buses
  • Parsing and normalization to consistent schemas (e.g., OCSF-style concepts)
  • Enrichment with asset, identity, vulnerability, and threat intel context
  • Filtering and sampling to reduce noise and control spend
  • Routing to multiple destinations (and different formats per destination)

Unlike legacy data pipelines that mainly move data from point A to point B, an SDPP adds intelligence and governance. It treats security data as a managed capability that can be standardized, observed, and adapted as environments change. That matters as teams adopt hybrid SIEM plus Data Lake strategies, scale cloud infrastructure for detection & response, and standardize telemetry for correlation & automation.

What Are the Key Capabilities of a Security Data Pipeline?

A security data pipeline turns raw telemetry into something usable before it hits your security stack. The most effective pipelines do two things at once. They improve data quality, and they control where data goes, how long it stays, and what it looks like when it arrives.

Ingest at Scale

A modern security data pipeline must collect continuously, not occasionally. That means cloud logs, SaaS audit feeds, endpoint telemetry, identity signals, and network data, pulled via APIs, agents, and streaming transports.

Transform in Flight

In-flight transformation is where the pipeline earns its value. As data flows, fields are parsed, key attributes are extracted, and formats are normalized into stable schemas. This reduces errors from inconsistent data and keeps correlation logic portable across tools. At the same time, noise can be filtered, events sampled, and privacy or redaction rules applied in a controlled, measurable, and reversible way. The result is clean, reliable data that’s ready for detection and action as it moves through the system.

Enrich With Context

Enrichment transforms daily SOC work by bringing context to the data before it reaches analysts. Instead of spending time manually gathering information, the pipeline adds identity and asset details, environment tags, vulnerability insights, and threat intelligence so events are ready for triage and correlation.

Route and Tier

Routing is where telemetry becomes truly governed. Instead of sending all data to a single destination, the pipeline applies policies to deliver the right events to SIEM, XDR, SOAR, and Data Lakes. Data is stored by value, with clear hot, warm, and cold retention paths, and can be accessed quickly when investigations require it. By handling different formats and subsets for each tool, routing keeps the pipeline organized, consistent, and fully managed across environments, turning raw streams into reliable, actionable telemetry.

Monitor Data Health

Pipelines need their own observability. Missing data, unexpected schema changes, or sudden spikes and drops can create blind spots that may only be noticed during an incident. A strong Security Data Pipeline Platform provides observability across the system, making these issues visible early and supporting safe rerouting if a destination fails.

AI Assistance

Teams are increasingly comfortable with relevant AI assistance in pipelines, especially for repetitive tasks like parser generation when formats change, drift detection, clustering similar events, and QA. The goal is not autonomous decision-making. It is a faster, more consistent pipeline operation with human control.

Detect in Stream

Some teams are now running detections directly in the data stream, turning their pipelines into active detection layers. Tools like SOC Prime’s DetectFlow enable this by applying tens of thousands of Sigma rules to live Kafka streams using Apache Flink, tagging and enriching events in real time before they reach systems like SIEM. The goal is not to replace centralized analytics, but to prioritize critical events earlier, improve routing, and reduce mean time to detect (MTTD).

What Challenge SDPPs Help to Solve?

Security Data Pipeline Platforms exist because modern SOC pain is not only “too many logs.” It is the friction between data collection and real detection outcomes. When telemetry is late, inconsistent, expensive to store, and hard to query at scale, the SOC ends up working around the data instead of working on threats. The main challenges SDPPs help solve are the following:

  • Data arrives too late to be useful. SIEM-based detection is not instant. Events must be collected, parsed, ingested, indexed, and stored before they are reliably searchable and correlatable. In real environments, correlation can take 15+ minutes depending on ingestion and processing load. SDPPs reduce this gap by shaping telemetry in-flight so downstream systems receive cleaner, normalized events sooner, and by routing high-priority data on faster paths when needed.
  • “Store everything” breaks the budget. Event data growth makes the default approach unaffordable. Even if you can pay to ingest everything, you still end up indexing and retaining huge volumes that do not improve detection outcomes. SDPPs help teams set clear policies, so high-value security events go to real-time systems, while bulk or long-retention logs are routed to cheaper tiers with predictable rehydration during investigations.
  • Detection logic can’t keep up with log volume. Average SOCs deploy roughly 40 rules per year, while practical SIEM rule programs and performance limits often cap usable coverage in the hundreds. More telemetry lands, but detection content does not scale at the same pace. SDPPs close the gap by reducing noise, stabilizing schemas, and preparing data so each rule has a higher signal value and works more consistently across environments.
  • ETL is not enough on its own. ETL is great for extracting, transforming, and loading data for analytics and reporting, often in batch. Security needs the continuous version of that idea. Telemetry arrives as a stream, formats change frequently, and detections need consistent schemas plus health monitoring to stay reliable. SDPPs complement ETL-style workflows by providing security-specific processing for streaming logs, schema drift handling, and operational observability.
  • Threats iterate faster than your query budget. AI-driven campaigns can evolve malicious payloads in minutes, which punishes workflows that depend on slow query cycles and manual evidence stitching. SIEMs also impose practical ceilings, including hard caps like under 1,000 queries per hour, depending on platform and licensing. SDPPs help by making each query more effective through normalization and enrichment, and by reducing the need for brute-force querying via smart routing, filtering, and tagging upstream.

What Are the Benefits of a Security Data Pipeline Platform?

When security teams talk about “too much data,” they rarely mean they want less visibility. They mean the work has become inefficient. Analysts waste time stitching context together, detections break when schemas drift, and leaders end up paying for ingest that does not move risk down.

A Security Data Pipeline Platform changes the day-to-day reality by putting one layer in charge of how telemetry is prepared and where it goes. For SOC teams, that means events arrive cleaner, more consistent, and easier to investigate. For the business, it means you can scale detection and retention without turning SIEM spend and operational noise into a permanent paycheck.

Therefore, key benefits of using Security Data Pipeline Platforms include the following:

  • Less noise, more signal. By filtering low-value events, deduplicating repeats, and adding context before events reach alerting systems, the SDPP helps analysts focus on what actually matters.
  • Lower SIEM and storage spend. The pipeline controls what gets sent to expensive destinations, routing high-value events to real-time systems while pushing bulk telemetry to cheaper tiers.
  • Less manual burden and rework. Transformation and routing rules live once in the pipeline instead of being rebuilt across tools and environments.
  • Stronger governance and compliance. Centralized policies simplify privacy controls, data residency constraints, and retention rules.
  • Fewer blind spots and surprises. Silence detection and telemetry health monitoring surface missing logs, drift, and delivery failures before incidents do.

How a Security Data Pipeline Platform Can Help Your Business?

At a business level, a Security Data Pipeline Platform is about making security operations predictable. When telemetry is governed upstream, leadership gets clearer answers to three questions that usually stay messy in mature environments: what data matters, where it should live, and what it should cost to operate at scale.

One practical impact is budget planning that survives data growth. Instead of treating ingestion as an uncontrollable variable, the pipeline makes volume a managed policy. You can set targets, prove what was reduced, and preserve the context that supports detection and compliance. That predictability turns cost reduction into operational freedom rather than a risky cut.

Another impact is standardization that unlocks reuse. When normalization is done once and applied everywhere, detection content and correlation logic can be reused across environments instead of being rewritten per source or per destination. That reduces the hidden maintenance costs that slow rollouts and drain engineering time.

A third impact is flexibility without lock-in. Intelligent routing and tiering let you align data to purpose, not vendor limitations. High-priority telemetry stays hot for response, broader datasets support hunting in cheaper stores, and long-retention logs can be archived with a clear rehydration path for investigations. The pipeline keeps the data layer stable while destinations evolve.

Finally, pipelines support operational assurance. Many organizations worry more about missing telemetry than noisy telemetry because quiet failures create blind spots that surface during incidents and audits. A pipeline that monitors source health and drift makes gaps visible early and improves confidence in security reporting.

Unlocking More SDPP Value With SOC Prime DetectFlow

Security data pipelines already help you collect, shape, and route telemetry with intent. SOC Prime’s DetectFlow adds an in-stream detection layer that turns your data pipeline into a detection pipeline. It runs Sigma rules on live Kafka streams using Apache Flink, tags, and enriches matching events in-flight, and routes high-priority matches downstream without changing your SIEM ingestion architecture.

Detect Flow, in-stream detection layer for SDPP

This directly targets the detection coverage gap. There are 216 MITRE ATT&CK techniques and 475 sub-techniques, yet the average SOC ships ~40 rules per year, and many SIEMs start to struggle around ~500 custom rules. DetectFlow is built to run tens of thousands of Sigma rules at stream speed with sub-second MTTD versus 15+ minutes common in SIEM-first pipelines. Because it scales with your infrastructure, you avoid vendor caps, keep data in your environment, support air-gapped or cloud-connected deployments, and unlock up to 10× rule capacity on existing infrastructure.

DetectFlow vs Traditional Approach: Benefits for SOC Teams

For more details, reach out to us at sales@socprime.com or kick off your journey at socprime.com/detectflow.


The post What Is a Security Data Pipeline Platform: Key Benefits for Modern SOC appeared first on SOC Prime.

  • ✇SOC Prime Blog
  • Model Context Protocol: Security Risks & Mitigations Daryna Olyniychuk
    AI adoption is moving fast, shifting from pilot projects to the infrastructure-level, day-to-day practice. The budget curve reflects that shift. Gartner expects worldwide AI spending to reach $2.52T in 2026, a 44% year-over-year increase. At the same time, AI cybersecurity spending is expected to grow by more than 90% in 2026, a clear signal that the deeper AI is embedded into business operations, the larger the attack surface becomes. As organizations operationalize LLMs, the real challenge sh
     

Model Context Protocol: Security Risks & Mitigations

11 de Fevereiro de 2026, 08:54

AI adoption is moving fast, shifting from pilot projects to the infrastructure-level, day-to-day practice. The budget curve reflects that shift. Gartner expects worldwide AI spending to reach $2.52T in 2026, a 44% year-over-year increase. At the same time, AI cybersecurity spending is expected to grow by more than 90% in 2026, a clear signal that the deeper AI is embedded into business operations, the larger the attack surface becomes.

As organizations operationalize LLMs, the real challenge shifts from response quality to safe execution. It is no longer enough for a model to explain what to do. In many environments, value comes from taking action, pulling the right context, and interacting with the systems where work happens. That includes code repositories, ticketing platforms, SaaS tools, databases, and internal services.

Before Model Context Protocol, every tool integration was like building a different custom cable for every device, and then discovering that each LLM vendor used a slightly different plug. MCP standardizes the connector and the message format; therefore, tools can expose capabilities once, and multiple models can use them consistently. The result is faster development, fewer bespoke integrations, and lower long-term maintenance as adoption spreads across the ecosystem.

This shift is already visible in cybersecurity-focused AI assistants. For example, SOC Prime’s Uncoder AI is powered by MCP tools that turn an LLM into a contextually aware cybersecurity co-pilot, supporting easier integration, vendor flexibility, pre-built connections, and more controlled data handling. For instance, MCP allows semantic searches across the Threat Detection Marketplace, quickly finding rules for specific log sources or threat types, and cutting down on manual search time. All this is backed by privacy and security at its core.

Yet, in general, when MCP becomes a common pathway between agents and critical systems, every server, connector, and permission scope becomes security relevant. Overbroad tokens, weak isolation, and incomplete audit trails can turn convenience into data exposure, unintended actions, or lateral movement.

This guide explains how MCP works, then focuses on practical security risks and mitigations.

What Is MCP?

Since it was released and open-sourced by Anthropic in November 2024, Model Context Protocol has rapidly gained traction as the connective layer between AI agents and the tools, APIs, and data they rely on.

At its core, MCP is a standardized way for LLM-powered applications to communicate with external systems in a consistent and controlled manner. It moves AI assistants beyond static, training-time knowledge by enabling them to retrieve fresh context and perform actions through approved interfaces. The practical outcome is an AI agent that can be more accurate and useful, because it can work with real operational data.

Key Components

Model Context Protocol architecture is built around a simple set of blocks that coordinate how an LLM discovers external capabilities, pulls the right context, and exchanges structured requests and responses with connected systems.

  • MCP Host. The environment where the LLM runs. Examples include an AI-powered IDE or a conversational interface embedded into a product. The host manages the user session and decides when external context or actions are needed.
  • MCP Client. A component inside the host that handles protocol communication. It discovers MCP servers, requests metadata about available capabilities, and translates the model’s intent into structured requests. It also returns responses back to the host in a form that the application can use.
  • MCP Server. The external service that provides context and capabilities. It can access internal data sources, SaaS platforms, specialized security tooling, or proprietary workflows. This is where organizations typically enforce system-specific authorization, data filtering, and operational guardrails.

Layers

  • Data layer. This inner layer is based on the JSON-RPC protocol and handles client-server communication. It covers lifecycle management and the core primitives that MCP exposes, including tools, resources, prompts, and notifications.
  • Transport layer. This outer layer defines how messages actually move between clients and servers. It specifies the communication mechanisms and channels, including transport-specific connection setup, message framing, and authorization.

Conceptually, the data layer provides the contract and semantics, while the transport layer provides the connectivity and enforcement path for secure exchange.

How Does the MCP Work?

MCP sits between the LLM and the external systems your agent plans to use. Instead of giving the model direct access to databases, SaaS apps, or internal services, MCP exposes approved capabilities as tools and provides a standard way to call them. The LLM focuses on understanding the request and deciding what to do next. MCP handles tool discovery, execution, and returning results in a predictable format.

A typical flow can look like the one below:

  • User asks a question or gives a task. The prompt arrives in the AI application, also called the MCP host.
  • Tool discovery. The MCP client checks one or more MCP servers to see what tools are available for this session.
  • Context injection. MCP adds relevant tool details to the prompt, so the LLM knows what it can use and how to call it.
  • Tool call generation. The LLM creates a structured tool request, basically a function call with parameters.
  • Execution in the downstream service. The MCP server receives the request and runs it against the target system, often through an API such as REST.
  • Results returned and used. The output comes back to the AI application. The LLM can use it to make another call or to write the final answer.

Here is a simple example of how that works in Uncoder AI. You ask: “Find detections for credential dumping that work with Windows Security logs.

  • The LLM realizes it needs access to a detection library, not just its own knowledge.
  • Through MCP, Uncoder AI calls the relevant Detection Search tool connected to SOC Prime’s Threat Detection Marketplace.
  • The MCP server runs the search and returns a short list of matching detections.
  • Uncoder AI then reviews the results and replies with a clean shortlist of five detection rules.


Uncoder_SOC Prime_MCP Tool_Search Detections

MCP Risks & Vulnerabilities

Model Context Protocol expands what an LLM can do by connecting it to tools, APIs, and operational data. That capability is the value, but it is also the risk. Once an assistant can retrieve internal context and trigger actions through connected services, MCP becomes part of your control plane. The security posture is no longer defined by the model alone, but by the servers you trust, the permissions you grant, and the guardrails you enforce around tool use.

Key MCP Security Considerations

MCP servers serve as the glue between hosts and a broad range of external systems, including potentially untrusted or risky ones. Understanding your exposure requires visibility into what sits on each side of the server boundary, which LLM hosts and clients are calling it, how the server is configured, what third-party servers are enabled, and which tools the model can actually invoke in practice.

  • Confused Deputy Problem. If an MCP server can act with broader privileges than the user, it may execute actions that the user should not be allowed to trigger. The secure pattern is that the server acts on behalf of the user with explicit consent and least-privilege scopes, not with a blanket service identity.
  • Token Passthrough. Passing client tokens through to downstream APIs without proper validation breaks trust boundaries and can defeat audience controls. MCP guidance treats this as a high-risk anti-pattern because it makes authorization ambiguous and hard to audit.
  • Session Hijacking and Event Injection. Stateful connections can be abused if session identifiers can be stolen, replayed, or resumed by an attacker. Secure session handling matters because tool calls become a sequence, not a single request, and attackers target the weakest link in that chain.
  • Local MCP Server Compromise. Local servers can be powerful, and that power cuts both ways. Risks include running untrusted code, unsafe startup behavior, and exposing a local service in a way that another site or process can reach it. Local deployments need sandboxing, strict binding, and safe defaults.
  • Scope Minimization Failures. Overly broad scopes increase blast radius and weaken governance. The specifications highlight scope design pitfalls, such as overloading a single scope for many operations or advertising excessive scope support. Least-privilege scopes and clear separation of read and write capabilities are essential.

Many MCP risks map to familiar security fundamentals; therefore, MCP servers should be treated like any other integration surface. Organizations need to apply supply-chain controls, scan code and dependencies, pin versions, and review changes before release. Also, it’s important to harden endpoints with strong authentication and authorization, rate limits, and secure defaults. These practices eliminate a large share of preventable failures.

The MCP specification provides a list of security best practices, with common attack patterns and practical mitigations you can apply when building or operating MCP hosts, clients, and servers.

Top MCP Security Risks

To make the list actionable, it helps to group MCP threats into the most common risk patterns defenders see in real deployments.

Prompt Injection

Attackers craft inputs that push the assistant into unsafe tool use or sensitive data disclosure.

Mitigation tip: Restrict tool access, enforce call policies, and monitor tool usage for abnormal patterns.

Indirect Prompt Injection

Hostile instructions can arrive through retrieved content and be treated as trusted intent.

Mitigation tip: Segregate untrusted content, sanitize it, and prevent tools from being invoked based on instructions found in external data.

Tool Poisoning

Tool descriptions, parameters, or defaults can be manipulated to steer model decisions.

Mitigation tip: Treat tool metadata as untrusted input, review tool definitions like code, and require integrity checks before updates.

Tool Shadowing and Tool Name Collision

Lookalike tools can impersonate legitimate ones and capture requests.

Mitigation tip: Maintain an allowlist of approved servers and tools, and fail closed when a tool identity cannot be verified.

Confused Deputy Authorization Failures

A server executes actions using its own broad privileges rather than user-bound permissions.

Mitigation tip: Use explicit consent, enforce user-bound scopes, and validate tokens as required by the MCP authorization guidance.

Token Passthrough and Weak Token Validation

Forwarding tokens or accepting tokens without proper audience validation undermines authorization.

Mitigation tip: Forbid passthrough, validate token audience, and follow the OAuth-based flow defined for HTTP transports.

Session Hijacking

Attackers abuse resumable sessions or stolen identifiers to inject events or impersonate a client.

Mitigation tip: Bind sessions tightly, rotate identifiers, apply timeouts, and log resumptions and anomalies.

Local Server Compromise

Local MCP servers can be leveraged to access files, run commands, or pivot to other resources if not isolated.

Mitigation tip: Sandbox local servers, minimize OS privileges, restrict file system access, and avoid exposing local services beyond what is required.

Excessive Scopes and Permission Creep

Broad scopes create unintended access, and permissions tend to accumulate over time.

Mitigation tip: Split read and write tools, review scopes regularly, and keep scope sets minimal and task-specific.

Lack of Auditability and Weak Incident Response

If you cannot correlate prompts, tool calls, tokens, and downstream actions, investigations become guesswork.

Mitigation tip: Centralize logs, attach correlation IDs, and record tool call intent, parameters, and outcomes in a SIEM-friendly format.

The practical takeaway is that MCP should be secured like a high-impact integration layer. Assume tool outputs are untrusted, minimize permissions, enforce strong identity and authorization, and invest early in monitoring that can tie prompts to tool calls and downstream actions.

SOC Prime follows established security and privacy best practices to protect customers and ensure the trustworthy operation of the SOC Prime Platform and AI-enabled capabilities. The SOC Prime team also created and open-sourced AI/DR Bastion, a comprehensive GenAI protection system designed to safeguard against malicious prompts, injection attacks, and harmful content. The system incorporates multiple detection engines that operate sequentially to analyze and classify user inputs before they reach GenAI applications.

Furthermore, the SOC Prime Platform supports integration with AIDEFEND (Artificial Intelligence Defense Framework), an open, AI-focused knowledge base of defensive countermeasures for emerging AI/ML threats. Backed by Uncoder AI, the AIDEFEND-native MCP makes this knowledge immediately actionable. Security professionals can ask for defenses against specific threats, pull detailed technique guidance, generate quick checklists, or extract secure code snippets to implement controls faster and with less research overhead.

What Is the Future of MCP Security?

Security concerns around MCP are valid, but standardization is also a major opportunity to improve control. As MCP adoption grows, organizations get a more consistent security surface where they can apply the same policies and monitoring across tool usage, instead of securing a different custom integration for every model and every downstream system.

Looking ahead, MCP security will mature in a few predictable directions:

  • Secure the MCP Building Blocks. MCP security will increasingly focus on the protocol primitives that define what an agent can do. Tools are executable functions and need tight permissions and clear rules for when they can run. Resources act as data containers and need access control and validation to reduce leakage and poisoning. Prompts influence behavior and must be protected with solutions, like AI/DR Bastion, against injection and unauthorized modification.
  • Make Identity Mandatory for Remote MCP. For any networked MCP server, authentication should be treated as a baseline requirement. Teams need a clear identity model that answers who is making the call, what they are allowed to do, and what consent was granted. This also helps prevent common failures highlighted in the spec, such as confused deputy behavior and risky token handling patterns.
  • Enforce Policy Using Full Context. Allowlists are useful, but agent workflows need richer guardrails. The prompt, the user, the selected tool, tool parameters, and the target system should all influence what is allowed. With that context, you can restrict risky operations, limit sensitive data retrieval, block unsafe parameter patterns, and require extra checks when the risk level is high.
  • Treat Monitoring as a Core Control. As agents chain actions, investigation depends on being able to trace behavior end-to-end. A practical baseline is logging that correlates prompts, tool selection, tool inputs, tool outputs, and downstream requests. Without that linkage, it is difficult to audit actions or respond quickly when something goes wrong.
  • Add Approval Gates for High-Impact Actions. For actions that create, modify, delete, pay, or escalate privileges, human review remains essential. Mature MCP deployments will add explicit approval steps that pause execution until a user or a security workflow confirms the action. This reduces the attack surface from both malicious prompting and accidental tool misuse.
  • Verify Servers and Control Updates. As the ecosystem expands, trust and provenance become mandatory. Organizations will increasingly rely on approved MCP servers, controlled onboarding, and strict change management for updates. Version pinning, integrity checks, and dependency scanning matter because MCP servers are executable code, and tool behavior can change over time, even if interfaces look stable.
  • Keep the Fundamentals Front and Center. Even with MCP-specific controls, the most common security practices remain the basics. Least privilege, clear scopes, safe session handling, strong authentication, hardened endpoints, and complete audit logging remove a large share of real-world risk. Use the MCP security best practices list as a standing checklist, then add controls based on your environment and risk appetite.

As MCP spreads across more assistants and tools, security becomes the difference between a helpful co-pilot and an unchecked automation engine. The safest path is simple: treat MCP like privileged infrastructure, keep permissions tight, and make every tool call visible and traceable. Do that well, and MCP can scale agent workflows with confidence instead of turning speed into risk.

FAQ

What are MCP servers?

MCP server is a building block in the MCP architecture alongside the MCP host and MCP client. MCP servers grant approved capabilities to an AI assistant by exposing tools and resources the LLM can use. MCP servers provide context, data, or actions to the LLM and broker access to downstream systems such as SaaS apps, databases, internal services, or security tooling. In other words, an MCP server is the controlled gateway where organizations can apply authorization, data filtering, and operational guardrails before anything touches production systems.

How do MCP servers work?

MCP servers sit behind the MCP client inside an AI application. When a user submits a request, the MCP client discovers what tools are available from one or more MCP servers and passes relevant tool context to the LLM. The LLM then decides what to do and generates a structured tool call with parameters. The MCP client sends that tool call to the MCP server, which executes it against the downstream system and returns the result in a predictable format. The client feeds the result back to the LLM, which either makes another tool call or produces the final response to the user.

What is MCP security flow?

MCP security flow is the set of controls, best practices, and architectural steps required to safely implement the Model Context Protocol. It starts with strong identity, consent, and least-privilege scopes so the MCP server acts on behalf of the user rather than using broad service permissions. It includes safe token handling and session protections to reduce the risk of token passthrough, session hijacking, or event injection. Finally, it depends on enforcement and visibility, including tool allowlists, input and output validation, isolation for local servers, and centralized logging that ties prompts to tool calls and downstream actions for investigation and incident response.


The post Model Context Protocol: Security Risks & Mitigations appeared first on SOC Prime.

❌
❌