❌

Visualização normal

Antes de ontemStream principal
  • ✇bellingcat
  • EU Satellite Imagery Delayed Over Gaza and Parts of West Bank by 24-hours Logan Williams
    Sign up here to receive Bellingcat’s biggest investigations by email as soon as they are published. Become a member and support our work here. Imagery captured by the European Space Agency’s freely available Sentinel-2 and Sentinel-1 satellites appears to be delayed over Gaza and parts of the West Bank, a Bellingcat analysis has found. While the delay remains relatively short at just 24 hours, this can still impact the speed at which analysts and researchers can observe what is happening
     

EU Satellite Imagery Delayed Over Gaza and Parts of West Bank by 24-hours

29 de Outubro de 2026, 19:15

Sign up here to receive Bellingcat’s biggest investigations by email as soon as they are published. Become a member and support our work here.

Imagery captured by the European Space Agency’s freely available Sentinel-2 and Sentinel-1 satellites appears to be delayed over Gaza and parts of the West Bank, a Bellingcat analysis has found.

While the delay remains relatively short at just 24 hours, this can still impact the speed at which analysts and researchers can observe what is happening in the region.

For example, the Israeli Defence Forces demolished homes in the West Bank Palestinian city of Hebron in recent days. New imagery captured on October 26, which included Hebron, would allow open source researchers to quickly confirm the demolitions, assess the impacted area and observe any unreported IDF activity. But imagery for the western half of Hebron was not available until October 27 due to the Sentinel-2 delay, inhibiting real-time fact-checking and reporting on this evolving situation.

A spokesperson for the European Union told Bellingcat that the delay was not related to events in Gaza but to “mitigate possible threats” due to the war in the Middle East “including Iran’s attacks on its neighbours and possible threats to European interests”. The delayed region of Sentinel tiles that cover Gaza as well as parts of Israel and the West Bank also extends over the Eastern Mediterranean Sea.

The European Union ordered a 24-hour delay on Sentinel satellite imagery over the Gulf of Oman earlier this year during US and Israeli strikes on Iran. However the delay impacting Gaza and parts of the West Bank has not been announced or previously reported.

“Such decisions are taken unanimously by all EU Member states and will stay in place as long as necessary,” the spokesperson said. They also said that while the Copernicus program, which includes the Sentinel satellites, operated a free and open data policy there were limitations to this for security. 

When asked if the delay, which began in late March, was related to the presence of US vessels in the Eastern Mediterranean or if there were other areas of delay, the spokesperson said they had no further comment.

Sentinel Delays

The Sentinel-2 and Sentinel-1 satellites provide an invaluable source of imagery for open source researchers. This has been especially true this year, as commercial satellite imagery providers restricted access to imagery in the Middle East, including areas of active human rights concern, such as Gaza. 

However, in July, the European Union published Council Decision 2026/1716, which ordered a 24-hour delay on Sentinel imagery over the Gulf of Oman, after a request from the US government which was involved in strikes on Iran at that time.

Just two weeks later, the European Union issued a corrigendum that unpublished decision 2026/1716 and removed it from the Council of the European Union record, although satellite data shows the delay has remained. 

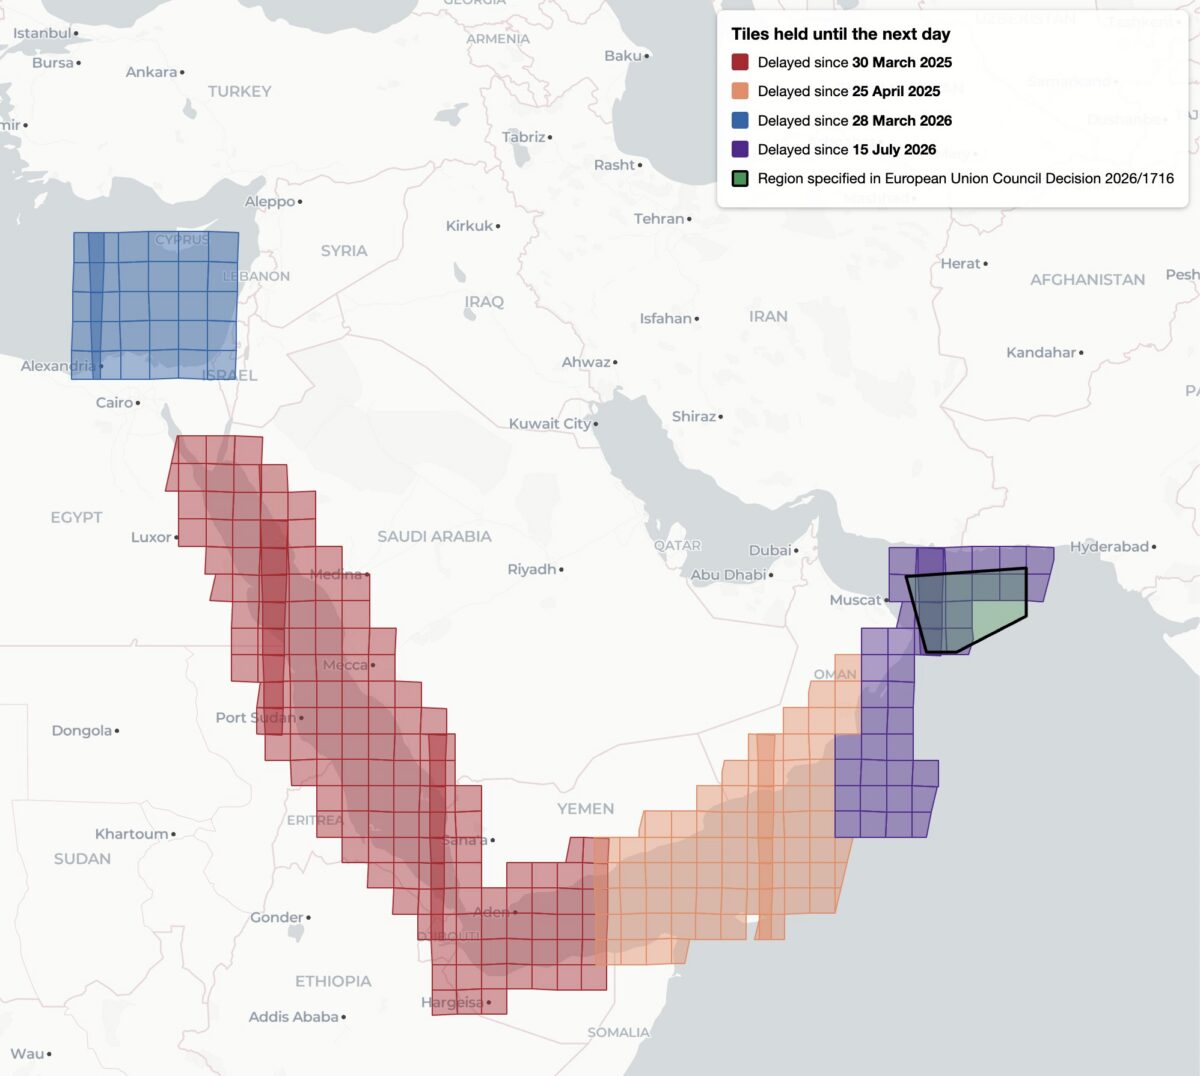
This decision, while it was available, was reportedly the first public notification of delayed Sentinel imagery. Yet it was not the first time that Sentinel imagery has been restricted, analysis shows. Bellingcat found four distinct regions of delayed satellite imagery during 2025 and 2026: the Gulf of Oman, the Gulf of Aden/western Arabian Sea, the Red Sea as well as the previously unreported delay in the Eastern Mediterranean Sea and parts of Israel, the West Bank and the entirety of Gaza.

Bellingcat’s analysis shows the regions where Sentinel-2 imagery is subject to a 24-hour delay, and when the delay was imposed. Only the July 15, 2026 delay over the Gulf of Oman was referenced by European Commission directives and the region referenced in 2026/1716 encompasses only a portion of the delayed tiles.

Bellingcat’s analysis shows that these delays have been implemented in stages. Twenty-four hour delays of Sentinel-2 imagery were first observed by open source researchers in March and April 2025 after the US launched a naval and air strike campaign against Houthi targets in Yemen. 

The previously unreported imagery delay in the Eastern Mediterranean began on March 28, 2026, the same month that commercial American space imaging company Planet Labs also restricted imagery across the Middle East. The Gulf of Oman delay began on July 15, 2026, two days after the publication of Council Decision 2026/1716.

Decision 2026/1716 also specified that the delay be implemented for both Sentinel-2 and Sentinel-1 radar imagery. Bellingcat’s analysis of Sentinel-1 image availability shows that this is the case for both the Gulf of Oman region and the unreported region over the Eastern Mediterranean Sea. However, the 2025 restrictions on Sentinel-2 imagery in the Red Sea and Gulf of Aden are not implemented in Sentinel-1. 

Sentinel-1 imagery uses “synthetic aperture radar” to capture lower resolution radar images that can collect data at night and on cloudy days. This differs from Sentinel-2, which captures optical satellite imagery at higher resolution.

Bellingcat’s analysis shows the regions where Sentinel-1 satellite imagery is subject to a 24-hour delay and when that delay was imposed.

A Tale of Two Tiles

Sentinel satellite imagery is most commonly accessed by open source researchers through Copernicus Browser, a free online platform, but it is also distributed as large tiled files in the Copernicus Data Space Ecosystem. These tiles are numbered using the Military Grid Reference System, and can be listed using APIs that provide information on each tile, including the capture and publication time. By comparing the capture and publication time, the publication delay can be computed.

For example, the catalog information for the tile T36RXV, which includes Gaza and portions of the West Bank, Negev and Egypt, provides the following metadata for the October 21, 2026 capture.

Metadata from tile T36RXV, which includes Gaza and portions of the West Bank, Negev and Egypt.

This shows that while the image was captured at 08:20 UTC on October 21, it was not published until 10:09 UTC on October 22 — almost 26 hours later. This is in contrast to the neighboring tile T36RYV, which includes parts of the West Bank, Israel, and Jordan. API data for this tile shows that the image was published at 12:10 UTC on October 21, just under four hours after the capture time.

Metadata from tile T36RYV, which includes parts of the West Bank, Israel, and Jordan.

This difference is not unique to this date either. Bellingcat’s analysis shows that this tile has been consistently delayed by one day since March 28, 2026.

Graphing the publication delay for two adjacent Sentinel-2 tiles shows a clear difference beginning March 28, 2026.

This method can be extended further, and by analysing every tile with valid publication date timestamps, Bellingcat identified all global Sentinel-2 and Sentinel-1 delays since 2023. The only consistent delays visible were those identified in the Gulf of Oman, the Gulf of Aden/western Arabian Sea, the Red Sea and Eastern Mediterranean in 2025 and 2026.

Impact on open source investigations

While the 24-hour delay on certain Sentinel imagery is a less severe restriction than other satellite providers have imposed, it can still impact the open source research process in fast moving situations. This is especially so in recent months as the European Space Agency’s Sentinel satellite data has emerged as a refuge as other satellite data is censored.

The image below shows how imagery for the eastern half of Hebron was visible on October 26, but not the western half where demolitions took place earlier this week.

The city of Hebron, Palestine, seen in Copernicus Browser on October 26, 2026. While imagery is available for the eastern half of the city, there is no recent imagery of the western half.

The shape of the missing tiles can be seen by zooming out within the Copernicus browser, demonstrating how imagery of Gaza and other parts of Israel and the West Bank are also delayed.

The missing tiles also include Gaza, parts of Israel, Egypt, and Cyprus, and the Eastern Mediterranean Sea.

Sentinel imagery covering western Hebron after the demolitions took place was published on October 27. However, the delay prevented local reports from being verified with satellite imagery while the situation was still ongoing.

Some Sentinel-2 users have previously described the challenges of covering fast-moving issues in the Gulf of Oman when the Sentinel delay was announced in March.


Bellingcat is a non-profit and the ability to carry out our work is dependent on the kind support of individual donors. If you would like to support our work, you can do so here. You can also subscribe to our Newsletter and follow us on Bluesky here, Instagram here, Reddit here and YouTube here.

The post EU Satellite Imagery Delayed Over Gaza and Parts of West Bank by 24-hours appeared first on bellingcat.

  • ✇bellingcat
  • Satellite Imagery Documents New Border Patrol Road Construction in Big Bend National Park Logan Williams
    Sign up here to receive Bellingcat’s biggest investigations by email as soon as they are published. Satellite images obtained and analysed by Bellingcat show over five miles of new road constructed in Big Bend National Park in southwestern Texas, part of a US Customs and Border Protection (CBP) “Smart Wall” installation, which includes roads, barriers, lighting and cameras.  The project was paused earlier this week after pushback from local residents, politicians and environmental groups.
     

Satellite Imagery Documents New Border Patrol Road Construction in Big Bend National Park

20 de Agosto de 2026, 17:50

Sign up here to receive Bellingcat’s biggest investigations by email as soon as they are published.

Satellite images obtained and analysed by Bellingcat show over five miles of new road constructed in Big Bend National Park in southwestern Texas, part of a US Customs and Border Protection (CBP) “Smart Wall” installation, which includes roads, barriers, lighting and cameras. 

The project was paused earlier this week after pushback from local residents, politicians and environmental groups.

The roads have been built adjacent to the Rio Grande, through the river’s floodplain and riparian forest, and include construction adjacent to Cottonwood Campground, Santa Elena Canyon, and Mariscal Canyon in the National Park.

Planet Labs satellite imagery captured on August 15 and August 19 shows new roads cleared through the riparian forest around the Rio Grande in Big Bend National Park.

The map above traces the new road construction in yellow. An unannotated version of the satellite image showing the new road can be found here while a before image of the same area where no road is visible can be seen here.

The new road extends to Cottonwood Campground, one of four campgrounds in Big Bend National Park. 

The road can be seen crossing the riparian forest and smaller drainages before joining the campground access road. Imagery also appears to show bright yellow construction equipment staging in the campground area, where bulldozers were previously seen.

Planet Labs satellite imagery captured on August 19 shows a new road near Cottonwood Campground in Big Bend National Park. Hover to compare to Planet satellite imagery from September 2022. Note that the removal of cottonwood trees in the campground is unrelated to CBP construction activity.

In the southernmost part of Big Bend National Park, additional new road construction is also visible near Mariscal Canyon and connecting to Talley Road. 

CBP planning documents indicate that this section of the border will receive a four-to-six foot tall vehicle barrier in addition to the “smart wall” lighting and camera systems. Talley Road currently provides access to riverside backcountry campsites and hiking and boating access to Mariscal Canyon on the Rio Grande.

Planet Labs satellite imagery captured on August 18 shows a new road near Mariscal Canyon in the southernmost part of Big Bend National Park.

The map above traces the new road construction in yellow. An unannotated version of the satellite image showing the new road can be found here. A before image of the same area where no road is visible can be seen here.

Support Bellingcat

Your donations directly contribute to our ability to publish groundbreaking investigations and uncover wrongdoing around the world.

CBP Commissioner Rodney Scott described the construction activities as “survey and design work” in an August 13 statement. He also stated that CBP is “building one new access road, improving existing roads, installing detection technology, and placing vehicle barriers in limited, strategic locations.”

However, by August 17 Scott had announced a “pause” of construction activities in the face of  bipartisan criticism of the project’s impact to the environment, recreation access, and the local economy

The Big Bend Border Patrol Sector sees the fewest migrant apprehensions of any part of the US southern border, according to CBP’s own data.


Bellingcat is a non-profit and the ability to carry out our work is dependent on the kind support of individual donors. If you would like to support our work, you can do so here. Subscribe to our Newsletter and follow us on Bluesky here, Instagram here, Reddit here and YouTube here.

The post Satellite Imagery Documents New Border Patrol Road Construction in Big Bend National Park appeared first on bellingcat.

  • ✇bellingcat
  • Will Ronaldo Cry​? World Cup Fans Bet Billions Through Prediction Markets Miguel Ramalho
    Cristiano Ronaldo during Portugal’s losing game against Spain earlier this month. Source: Imagn Images via Reuters Connect Football fans wagered more than US $14 billion on the FIFA World Cup through prediction markets Polymarket and Kalshi, a Bellingcat analysis has found. Support Bellingcat Your donations directly contribute to our ability to publish groundbreaking investigations and uncover wrongdoing around the world. Donate On the crypto-based Polymarket, which prov
     

Will Ronaldo Cry​? World Cup Fans Bet Billions Through Prediction Markets

30 de Julho de 2026, 08:17
Cristiano Ronaldo during Portugal’s losing game against Spain earlier this month. Source: Imagn Images via Reuters Connect

Football fans wagered more than US $14 billion on the FIFA World Cup through prediction markets Polymarket and Kalshi, a Bellingcat analysis has found.

Support Bellingcat

Your donations directly contribute to our ability to publish groundbreaking investigations and uncover wrongdoing around the world.

On the crypto-based Polymarket, which provides more information about individual trading accounts than its rival American site Kalshi, we also found that just 1% of users collected the vast majority of winnings during the tournament.

Users traded on almost 60,000 outcomes across both sites during the competition, betting on everything from the sponsor of the Golden Boot winner to whether Cristiano Ronaldo would shed a tear during a Portugal match. 

The World Cup, held in the US, Canada and Mexico over June and July, was forecast to be the biggest betting event in history, with a predicted $50 billion in wagers. 

Unlike traditional sports betting sites, prediction markets resemble stock exchanges where users trade, via an order book, on whether a real-world event will happen. Prices fluctuate based on what the market believes the probability of that event is. The sites charge fees on each sports trade.  

With 48 teams playing 104 games, the World Cup was slated to be the biggest gambling event of all time. Source: Polymarket

The prediction market industry has faced criticism over its vulnerability to insider trading, potential market manipulation and concerns about fueling unregulated gambling. The Wall Street Journal also reported in May that a small number of individuals using algorithmic trading models were taking home an outsized share of winnings.

This would appear to align with Bellingcat’s World Cup analysis, where a small percentage of accounts made most of the winnings. However, the level of detail we were able to obtain did not allow us to see accounts that had utilised algorithmic methods.

Both Polymarket and Kalshi make events and volume data available for programmatic extraction – making it useful for open source analysis. Bellingcat’s data analysis examined all 104 matches as well as the World Cup winner event that was hosted on each platform.

On Polymarket, users traded a total of $10 billion ($5.7 billion on individual games and $4.3 billion on which country would win). The largest game on Polymarket was the Spain vs Argentina final ($212 million), followed by the France vs Spain semi-final ($165 million) and the England vs Argentina semi-final ($142 million). 

On Kalshi, users traded a total of more than $4.3 billion ($4.1 billion on the games and $200 million on the winner).

Bellingcat’s analysis also found that 1% of Polymarket trading accounts collected 86% of all winnings during the World Cup, and the bottom 50% of winners shared just 0.1% of profits. The typical winning account on Polymarket made $21, while the typical losing account lost $32 (measured by the median, which is less affected by a handful of exceptionally large wins and losses). More than 12% of traders (14,500) who bet on two or more games lost every bet. The Polymarket account that won the most across all games made a profit of more than $13 million, while the biggest loser lost $11.6 million.

We were unable to run the same win-loss analysis for Kalshi because trading account overviews are not publicly available.

The top teams, by trading volume, across both sites were Argentina ($1.068 billion), Spain ($876 million) and France ($836 million). The top players were Argentina’s Lionel Messi ($40 million), France’s Kylian Mbappé ($36 million) and Norway’s Erling Haaland ($16 million).

How We Calculated the Volume

Polymarket displays the actual traded volume on its site, the total US dollar amount of shares bought and sold since the market started.

Kalshi does not display the traded volume. Instead, it shows the notional volume, which counts every contract traded at the maximum payout value of $1. This means that a token bought for $0.20 will be presented as $1 extra in a user’s displayed volume. This makes the total monetary volume appear higher on Kalshi’s website. To achieve a fair comparison between both platforms, we implemented a heuristic to reconstruct Kalshi’s markets’ volume. We used the daily average price for each market over their duration and multiplied it by the number of contracts traded on that day, the sum of which gives us the values used in this piece. We applied this formula for the more than 21,000 World Cup markets. 


Data scraping was supported by Oxylabs’ Project 4β.

Bellingcat is a non-profit and the ability to carry out our work is dependent on the kind support of individual donors. If you would like to support our work, you can do so here. You can also subscribe to our Patreon channel here. Subscribe to our Newsletter and follow us on Bluesky here, Instagram here, Reddit here and YouTube here.

The post Will Ronaldo Cry​? World Cup Fans Bet Billions Through Prediction Markets appeared first on bellingcat.

❌
❌