
Visualização normal

Antes de ontemStream principal
  • ✇Securelist
  • ToddyCat: your hidden email assistant. Part 2 Andrey Gunkin
    Introduction We continue to share details on the malicious techniques and toolsets used by the ToddyCat APT group. In the first part of this report, we examined the group’s attacks aimed at stealing data from browsers, as well as from local and cloud email services. The methods used in that campaign indicated that ToddyCat was attempting to access corporate correspondence while evading monitoring tools. However, all of the group’s methods we described previously are effectively detected by EPP a
     

ToddyCat: your hidden email assistant. Part 2

30 de Junho de 2026, 07:00

Introduction

We continue to share details on the malicious techniques and toolsets used by the ToddyCat APT group. In the first part of this report, we examined the group’s attacks aimed at stealing data from browsers, as well as from local and cloud email services. The methods used in that campaign indicated that ToddyCat was attempting to access corporate correspondence while evading monitoring tools. However, all of the group’s methods we described previously are effectively detected by EPP and EDR solutions.

The attackers continued their search for ways to bypass security solutions and developed a new tool to gain access to a victim’s cloud account via the Google API. Armed with this tool, the group automated all stages of the attack and managed to remain undetected by monitoring systems.

In this part of the report, we break down the mechanics of this new attack and analyze the tool that was used to automate it. We’ll also discuss how to detect and defend against this threat.

Umbrij

In this campaign, the attackers focused their attention on corporate email communications hosted on Gmail, targeting access compromise via APIs. Because the Google API relies on the OAuth 2.0 protocol for authorization, applications can use an OAuth token to access requested email resources. To acquire this token, the threat actors developed a tool called Umbrij and used it to connect to the browser’s management console in headless mode via a remote debugging port. Through a series of requests, they obtained an OAuth authorization code, which they subsequently exchanged for an access token to reach the target resources via the API. We have dubbed this technique Shadow Token via Remote Debug (STRD).

This attack is viable on Chromium-based browsers. If the user has not logged out of their Gmail account, the browser maintains an active session. The attackers exploit this: they launch the browser, connect via the remote debugging port to take control, and send a request to the Gmail service to grant access to the Google account resources within the context of the user’s saved session.

During our investigation of this attack, we discovered several versions of the Umbrij tool. These versions included a variety of helper functions designed for debugging, as well as for searching and selecting user accounts within the browser, among other tasks.

Kaspersky solutions detect this tool with the following verdicts: HEUR:Trojan-PSW.MSIL.Umbrij.gen, HEUR:Trojan.MSIL.Agent.gen, HEUR:Trojan-PSW.MSIL.Agent.gen.

Execution

The Umbrij tool was discovered during a proactive threat hunting operation: a scheduled task, KasperskyEndpointSecurityEDRAvp, was running on a user host, launching a digitally signed file. Kaspersky solutions do not create scheduled tasks with that name; the attackers were attempting to masquerade their malicious activity as a legitimate process.

The signed file then used the DLL sideloading technique to load the malicious tool.
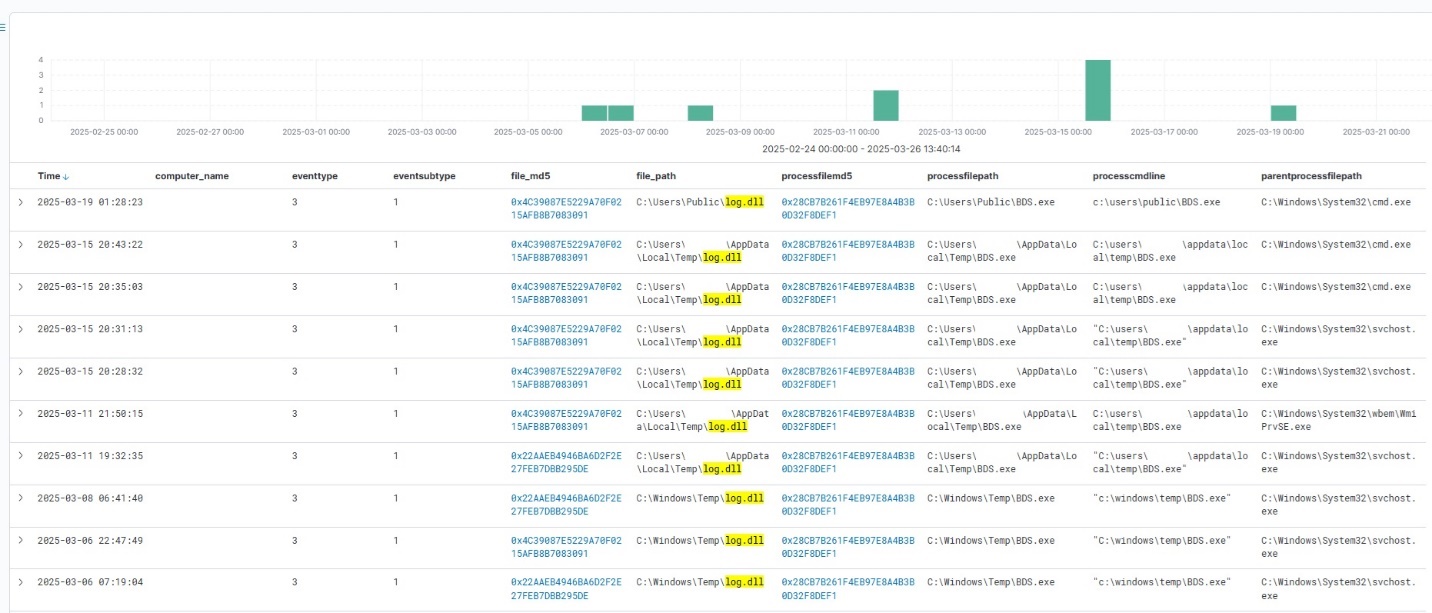
Umbrij execution events within Kaspersky Managed Detection and Response

Umbrij execution events within Kaspersky Managed Detection and Response

Throughout our observation period, we identified the following legitimate files vulnerable to the DLL sideloading technique that were used to launch Umbrij:

  1. BDSubWiz.exe: a component of the Submission Wizard in Bitdefender ConnectAgent, which is used to support connection features and interaction with other Bitdefender services or agents. This file insecurely loads a file named log.dll.
  2. VSTestVideoRecorder.exe: a component of the video-recording tool used for testing with Visual Studio (VS Test). This executable insecurely loads a file named Microsoft.VisualStudio.QualityTools.VideoRecorderEngine.dll.
  3. GoogleDesktop.exe: the discontinued Google Desktop Search application for indexing files and performing quick searches on a local Windows computer. This executable insecurely loads a file named GoogleServices.dll.

These files were used to load different versions of Umbrij; the same legitimate file could be leveraged to launch more than one variant. In total, we discovered three versions of Umbrij, which we refer to as a, b, and c for convenience.

The tool itself is a DLL written in .NET and obfuscated with ConfuserEx, an open-source obfuscator for .NET applications.
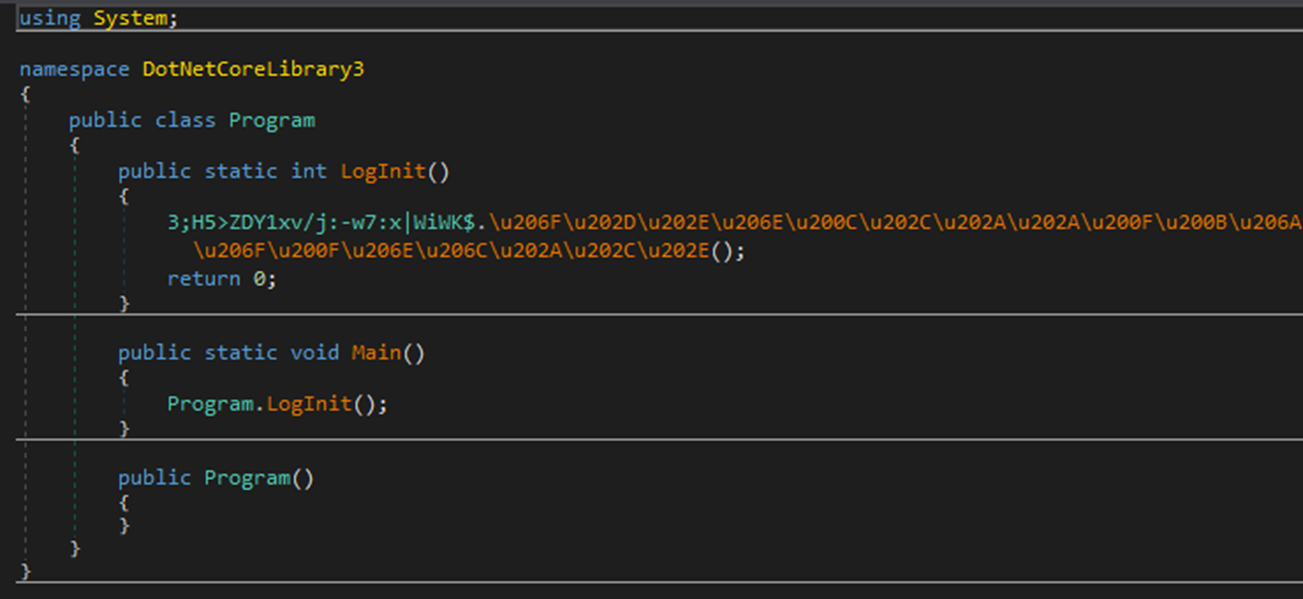
Example of an obfuscated code snippet

Example of an obfuscated code snippet

Umbrij is managed with the help of parameters passed through a command line at startup, although it is occasionally executed without any parameters. Below are examples of the command lines observed in attacks against users:

"c:\Users\Public\BDSubWiz.exe" -regex <name> -deepsearch
c:\windows\vss\bds.exe

However, these are not the only parameters the tool can accept and process. During the analysis of its executable code, we discovered additional parameters that vary depending on the version of Umbrij. See the table below for the parameters and their descriptions.

Version Command Description
a -regex <string> Used in conjunction with the -deepsearch parameter. Specifies a substring to search for within the user_name field of the user profile file, which typically contains the email address. The tool will utilize the user profile that matches this specified substring
a -user <username> Specifies the system username under which the tool will run
a -runas-currentuser Configures Umbrij to run within the execution context of the current user
a -deepsearch Enforces additional checks on the user_name field in the user profile: verifying that it is not empty and that it contains the substring specified in the -regex parameter
a, b, c -path <path> Specifies the full path to the directory containing the browser’s executable file
a, b, c -browser <both|msedge|chrome> Specifies which browser the tool should target: Google Chrome, Microsoft Edge, or both
a, b, c -debugport <port> Specifies the remote debugging port number
a, b, c -sync When this parameter is specified in the URL, the value 1095133494869 replaces 279448736670 in the permission request
b -domainAd Specifies the domain name if the user account is a domain account
b -savepdf Instructs Umbrij to save a screenshot of the user profile as a PDF file
c -lport Same as debugport

Environment preparation

At startup, the tool evaluates several prerequisites required to carry out the attack and performs preparatory actions to subsequently compromise the Gmail account.

First, Umbrij verifies the availability of the port that will be designated for browser debugging. To accomplish this, the tool utilizes a function named ChekPortAvailable() (original spelling retained), which accepts the target port number as a parameter. It then retrieves information about active connections on the host using the .NET GetActiveTcpConnections() function from the System.Net.NetworkInformation namespace. The tool iterates through each connection in a loop, comparing the port number to the one it is checking.

The ChekPortAvailable function used to verify open ports

The ChekPortAvailable function used to verify open ports

After this, the tool retrieves the user context. It searches the system for the explorer.exe process and duplicates its token, retaining all of its privileges (T1134.003 Access Token Manipulation: Make and Impersonate Token). This is the exact same mechanism used by another tool in the group’s arsenal, TomBerBil, which we covered previously.
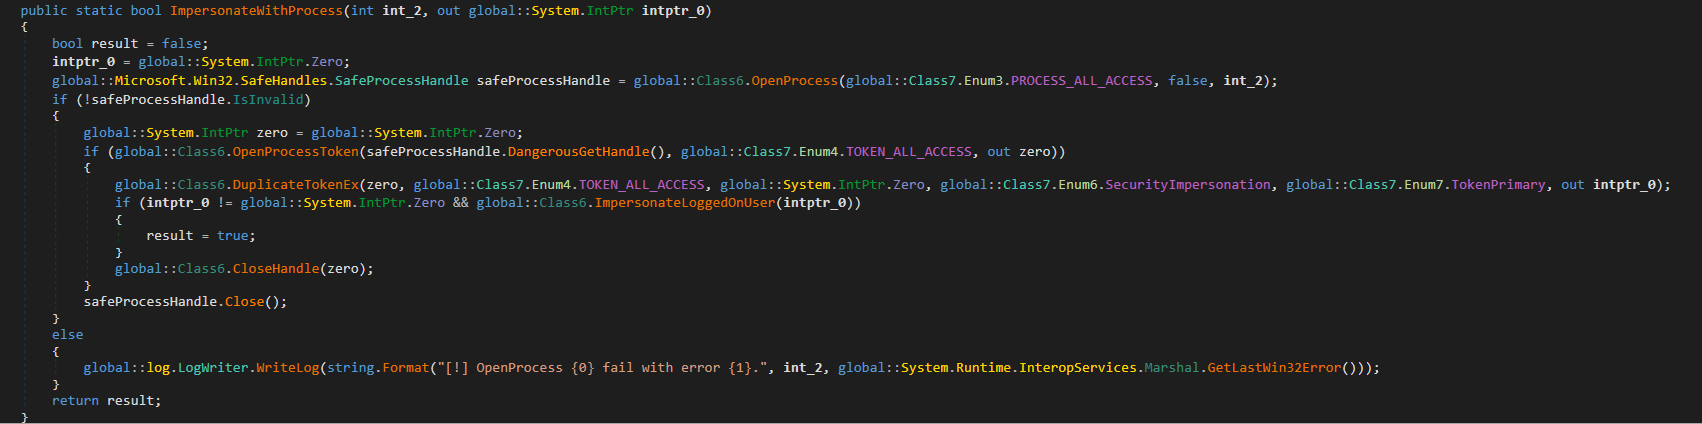
The ImpersonateWithProcess function used to retrieve user context

The ImpersonateWithProcess function used to retrieve user context

By default, Umbrij duplicates the token of the first explorer.exe process it encounters. If multiple users are logged in to the system, the -user <username> switch can be used to specify the name of the target user whose token to duplicate. If the -runas-currentuser switch is specified, the tool will execute within the context of the current user without duplicating any tokens.

Next, Umbrij constructs the path to the browser application folder within the user’s local application data repository. To do this, it uses the Environment.SpecialFolder.LocalApplicationData command to retrieve the repository directory from the environment variable and appends the directory of the target browser. The tool then searches for the Local State file in the following folders:

  • %LOCALAPPDATA%\Google\Chrome\User Data\Local State
  • %LOCALAPPDATA%\Microsoft\Edge\User Data\Local State

See below for an example of the Local State file structure.
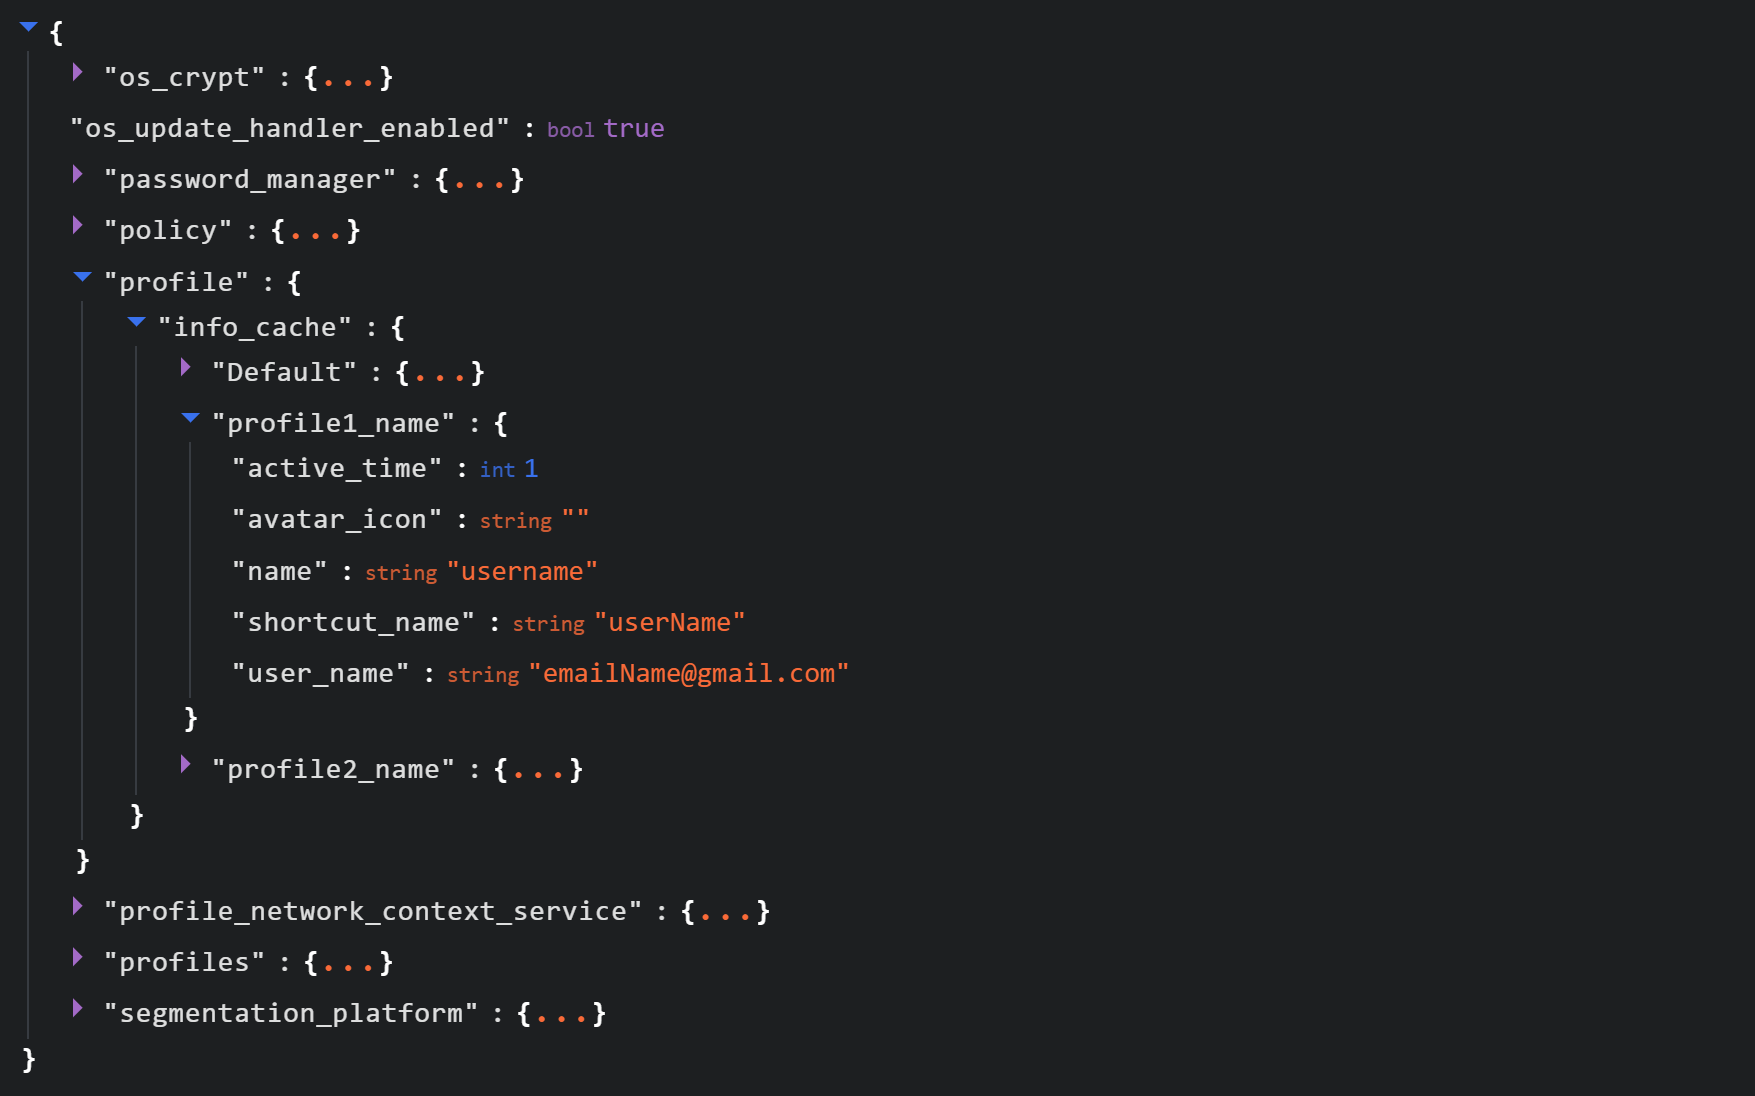
Structure of the Local State JSON file

Structure of the Local State JSON file

Within this file, the tool searches for the info_cache array, which stores information about browser user profiles. Umbrij enumerates all user profiles and looks for those containing a user_name field that includes an email address. The presence of an email address indicates that the user is authenticated to a Google service. While the tool can interact with every profile it finds, if the -regex <string> parameter is passed through a command line, it searches for the specified substring within the email addresses being enumerated and proceeds exclusively with those matches.

Next, Umbrij creates the following directories for Google Chrome and Microsoft Edge, respectively:

  • %LOCALAPPDATA%\Google\Chrome\BackupFiles\
  • %LOCALAPPDATA%\Microsoft\Edge\BackupFiles\

The tool copies the following user files and folders of each target user profile into these directories:

  • IndexedDB: a folder containing a relational database used for client-side storage of structured data
  • Local Storage: a component of the browser’s web storage that provides a key-value mechanism for storing data on the client side
  • Network: a folder where the browser stores files related to network requests and caching, such as the network cache and session files
  • Login Data: a file that stores saved passwords for various websites and applications
  • Login Data For Account: a file that stores credentials associated with a Google account or other synchronized accounts within the browser
  • Preferences: a file containing profile-level browser settings
  • Secure Preferences: a file that stores protected configurations, such as security and synchronization data
  • Web Data: a file that stores auto-fill data

If these files are locked by other processes, the tool includes a dedicated function to force-copy them.
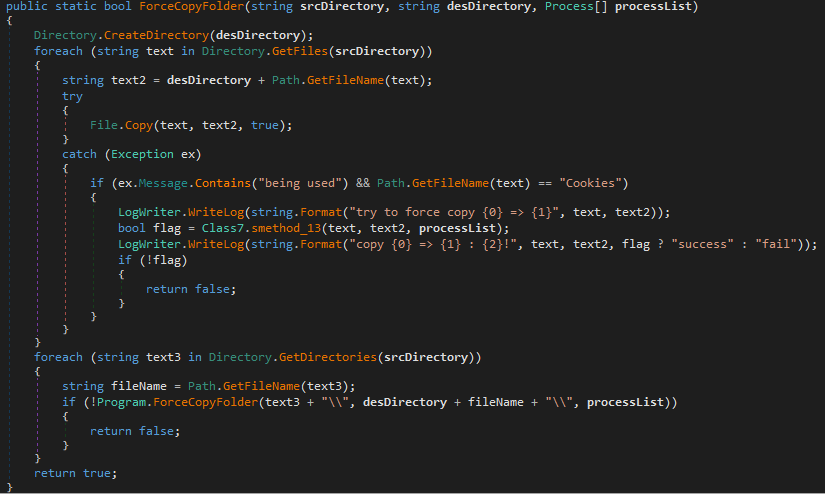
The ForceCopyFolder function used to copy files locked by other processes

The ForceCopyFolder function used to copy files locked by other processes

As the next step, the tool searches the “Program Files” and “Program Files (x86)” directories for the browser installation folder. Once it locates the executable file and successfully copies all required files, it is ready to proceed with acquiring the authorization code.

Acquiring the authorization code

In the next phase of execution, Umbrij launches Google Chrome, Microsoft Edge, or both browsers sequentially, depending on the parameters passed in the command line. It then passes arguments to the browser based on the following template:

"\"{1}\" --user-data-dir=\"{0}\" --remote-debugging-port={2}  --profile-directory=\"Default\" --headless https://www.google.com/"

It populates the template with the following values:

  • {0}: the path to \BackupFiles\, where the user profile files were copied
  • {1}: the path to the browser executable file
  • {2}: the remote debugging port number

The table below describes the parameters used in this browser launch template:

Parameter Description
–user-data-dir Specifies the path to the root directory that will store the shared browser data and user profiles
–remote-debugging-port Opens a port for remote browser debugging over the DevTools protocol. This switch is commonly used for automated testing with frameworks like Selenium
–profile-directory Specifies the name of the specific profile folder within the user-data-dir
–headless Launches the browser in headless mode, that is, without a graphical user interface

The browser process runs in headless mode while utilizing the copied user profile. Consequently, all active user cookies are applied, which means sites with saved credentials will skip authentication prompts. Furthermore, the browser will log history to a new folder, keeping it completely hidden from the user’s primary account view.

Through this method, the threat actors gain access to the user’s authenticated sessions — specifically their Google account — along with the ability to erase any trace of their activity within the browser.

Code snippet showing Umbrij connecting to the browser via the debugging port

Code snippet showing Umbrij connecting to the browser via the debugging port

Next, the tool uses the Puppeteer Sharp library, a .NET version of Puppeteer, to connect to the remote debugging port. Puppeteer provides a high-level API to control Chrome or Chromium browsers over the DevTools protocol. Its primary use is for automated testing.
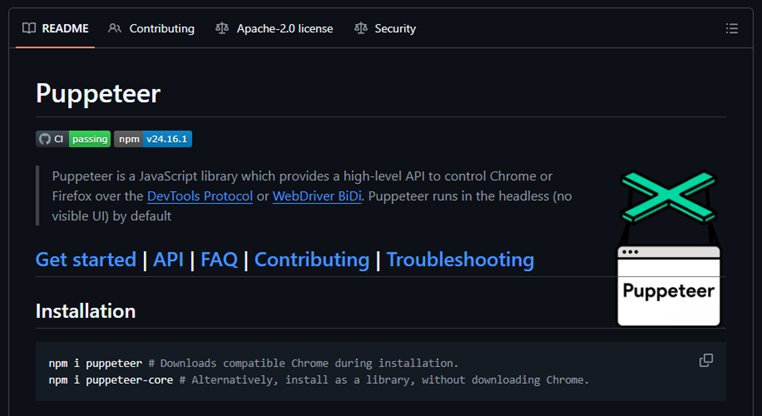
The Puppeteer module GitHub page

The Puppeteer module GitHub page

If the connection to the remote debugging port is successful, Umbrij sends a GET request to direct the browser to the following URL:

https[:]//accounts[.]google[.]com/o/oauth2/v2/auth/identifier?response_type=code&client_id=279448736670.apps.googleusercontent.com&redirect_uri=http%3A%2F%2Flocalhost&scope=https%3A%2F%2Fwww.googleapis.com%2Fauth%2Fcalendar%20https%3A%2F%2Fwww.googleapis.com%2Fauth%2Fcalendar.readonly%20https%3A%2F%2Fwww.google.com%2Fm8%2Ffeeds%2F%20https%3A%2F%2Fwww.google.com%2Fm8%2Ffeeds%2F%20https%3A%2F%2Fmail.google.com%2F%20https%3A%2F%2Fwww.googleapis.com%2Fauth%2Fgmail.insert%20https%3A%2F%2Fwww.googleapis.com%2Fauth%2Fgmail.labels%20https%3A%2F%2Fwww.googleapis.com%2Fauth%2Fdrive%20https%3A%2F%2Fwww.googleapis.com%2Fauth%2Fadmin.directory.user%20https%3A%2F%2Fwww.googleapis.com%2Fauth%2Ftasks%20https%3A%2F%2Fwww.googleapis.com%2Fauth%2Fadmin.directory.group.readonly%20https%3A%2F%2Fwww.googleapis.com%2Fauth%2Fapps.groups.migration%20https%3A%2F%2Fwww.googleapis.com%2Fauth%2Fuserinfo.email%20https%3A%2F%2Fwww.googleapis.com%2Fauth%2Fuserinfo.profile&flowName=GeneralOAuthFlow

The value specified in the client_id field belongs to Google Workspace Migration for Microsoft Outlook (GWMMO). This is Google’s official tool for importing email, calendar events, and contacts from Microsoft Exchange accounts or local PST files into a Google Workspace account.

Umbrij also includes the ability to switch the client_id value from 279448736670 to 1095133494869 by using the -sync parameter. This second identifier belongs to another application: Google Workspace Sync for Microsoft Outlook (GWSMO), which allows users to sync email, calendars, and other data from the cloud account directly into Microsoft Outlook.

Code snippet where the client_id replacement occurs

Code snippet where the client_id replacement occurs

The remaining parameters used in the request differ from those typically utilized by the legitimate applications. See the table below for a comparison of these parameters:

GET request parameter URL used by Umbrij Original URL
flowName=GeneralOAuthFlow Present Absent
code_challenge (PKCE) Absent Present (method=S256)
state Absent Present
login_hint Absent Present
redirect_uri http://localhost http://localhost:61619/callback

As seen from the list above, Umbrij omits several parameters characteristic of the legitimate applications. For instance, Umbrij drops the code_challenge parameter, normally used for data protection when retrieving an authorization code. Additionally, the tool modifies the redirection address: while the legitimate application specifies a dedicated port and a callback path, the tool simply points to localhost.

The authorization code request specifies the set of permissions for Google services required by the application. This list also differs significantly between requests issued by the legitimate application and those generated by Umbrij. The table below details the variations in the requested scopes:

Service parameter URL used by Umbrij Original URL
https://www.google.com/m8/feeds/ Present (specified twice) Absent
https://www.googleapis.com/auth/contacts Absent Present
https://www.googleapis.com/auth/admin.directory.resource.calendar.readonly Absent Present
https://www.googleapis.com/auth/peopleapi.readonly Absent Present

After the browser navigates to the URL provided by Umbrij, the Google account selection page opens.
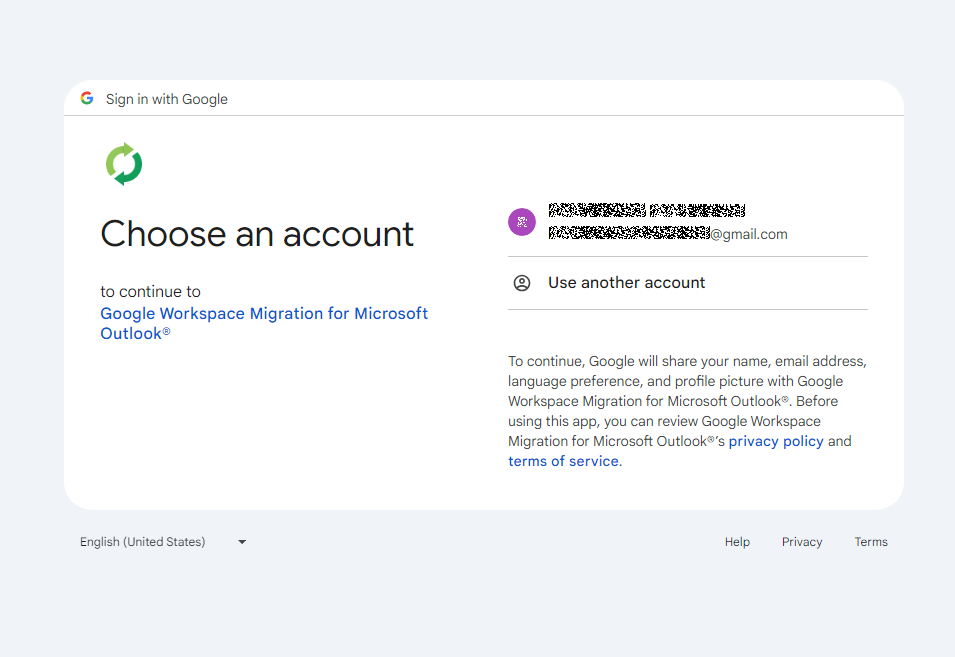
Account selection

Account selection

Because the attackers copied the victim’s profile folder and are operating within their specific environment, the account selection options will include the currently signed-in user’s authenticated session. Umbrij identifies the corresponding element within the page’s HTML source code.

Searching for HTML code elements on the page

Searching for HTML code elements on the page

The tool uses JavaScript to emulate a mouse click on the elements, allowing it to proceed to the next step.

Simulating a mouse click on a page element

Simulating a mouse click on a page element

The subsequent step opens a page displaying the list of requested permissions.
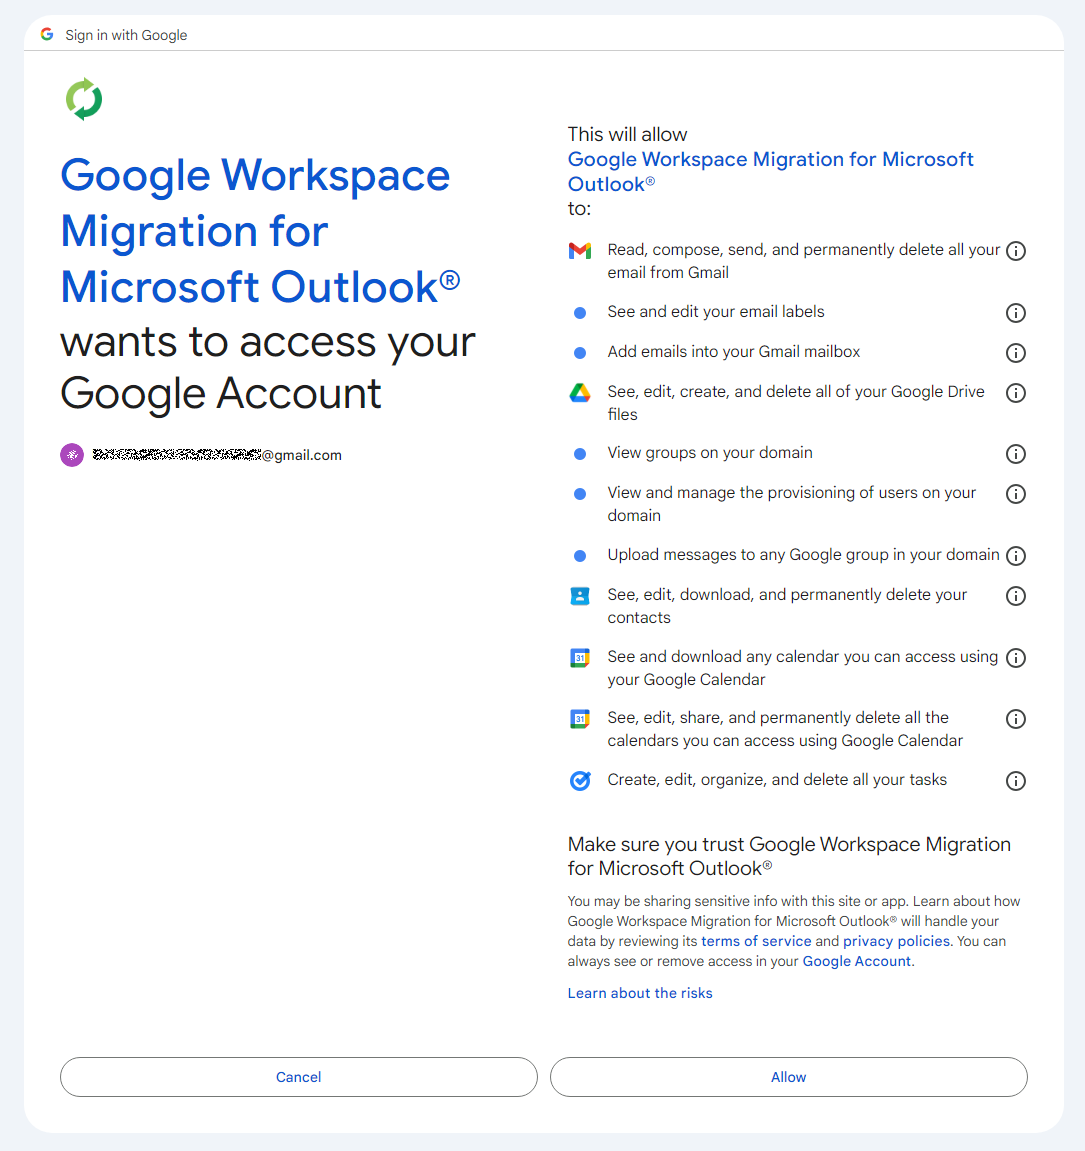
Confirming the list of requested access permissions

Confirming the list of requested access permissions

As shown in the screenshot, Umbrij requests full access to email, cloud storage, and contacts. Just like in the previous step, it uses JavaScript to click the “Allow” button, which completes the authentication process.

The browser is then redirected to the local address that was specified in the redirect_uri parameter of the initial request. The tool intentionally omits a port and a path to a specific page in the redirect_uri because the true objective of this action is simply to capture the code parameter from the context of the GET request. This parameter contains the OAuth authorization code. To retrieve it, Umbrij extracts the substring located between the code= and &scope parameters.
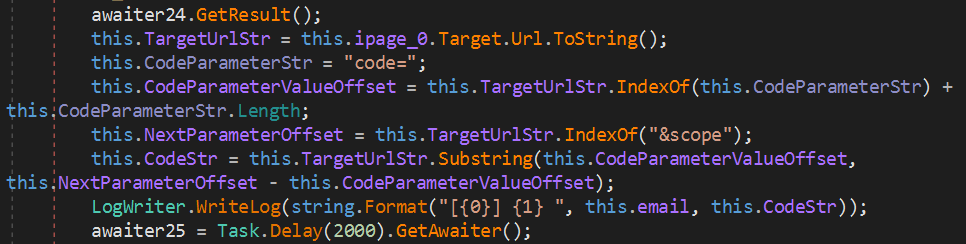
Extracting the authorization code from the GET request

Extracting the authorization code from the GET request

Results

Umbrij, like most other tools in ToddyCat’s arsenal, logs its actions in detail and saves them to a file. It also saves the retrieved authorization code to this log file, which the operator subsequently exfiltrates from the compromised host.

Below is an example of a log file generated by version a of the tool.

------------------------------
^^^^^^^^^^^^^^^^^^^^^^^^^^^^^^^
[*] switch to sync mode.
[!] port 11111 is available!
[*] Impersonate <username> success!
[*] browser switch to chrome .
Parsing C:\Users\<username>\AppData\Local\Google\Chrome\User Data\Local State ...
[*] detected profile: Profile 4 ==> <email>@gmail.com
[*] ready auth for <email>@gmail.com.
[*] Browser Exe path C:\Program Files\Google\Chrome\Application\chrome.exe.
[!] CreateProcessAsUserW...
[*] Browser created with pid 3108
[???] <email>@gmail.com
[pup] mail : <email>@gmail.com
[pup] account choice click !
[pup] Allow click !
[<email>@gmail.com] 4%2F0AcvDMrDtzQaC-TT8<hash>uMhg 
[*] RevertToSelf succeed!
^^^^^^^^^^^^^^^^^^^^^^^^^^^^^^^

The log indicates that the sync mode is selected (meaning the Google Workspace Sync for Microsoft Outlook application is used) and the debugging port is set to 11111. After locating the user profile and copying its folder, Umbrij launches Google Chrome. After this, the tool emulates clicks on the appropriate buttons to confirm permissions, ultimately outputting the final result of the operation: the stolen OAuth authorization code.

Since all requests occur within a background browser instance, the tool includes a feature to generate a PDF snapshot of the web page where the permission confirmation process halted in the event of an error.

Saving a web page as a PDF file in the case of an error

Saving a web page as a PDF file in the case of an error

Additionally, the tool can create a PDF file for the user profile in Google Chrome and Microsoft Edge by navigating to the following internal addresses:

  • edge://profile-internals
  • chrome://profile-internals
Example contents of a generated PDF file

Example contents of a generated PDF file

The acquired authorization code is then exchanged for an OAuth access token. The threat actors use that token to connect to the Gmail account through the API, thus compromising corporate email communications. The diagram below illustrates the complete attack workflow.
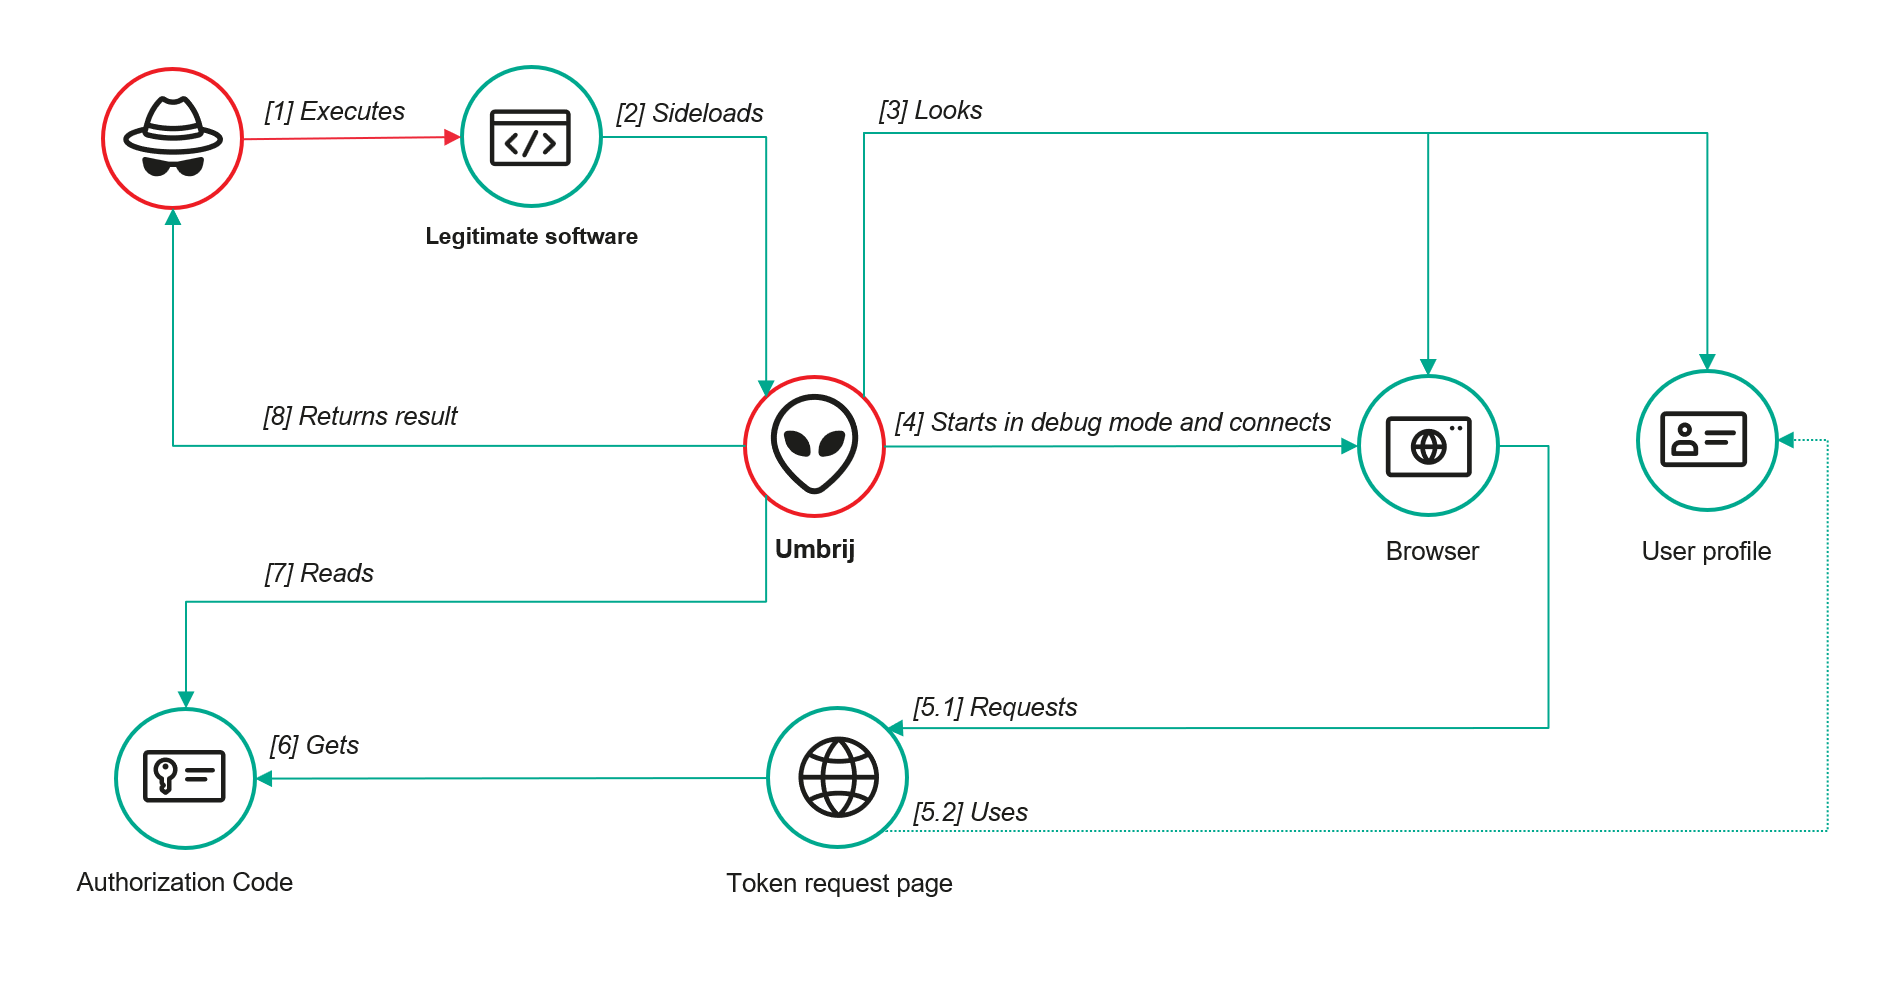
Umbrij workflow diagram

Umbrij workflow diagram

Detection

DLL sideloading

First and foremost, defenders should monitor library loading events (DLL loads) associated with the known applications vulnerable to DLL sideloading that are exploited by this tool: Bitdefender ConnectAgent, Visual Studio, and Google Desktop Search.

title: Possible Dll Hijacking Of Microsoft VisualStudio QualityTools dll
id: 246f1409-2993-46f6-9b77-e447a327df5d
status: experimental
description: Detects possible DLL hijacking of Microsoft.VisualStudio.QualityTools.VideoRecorderEngine.dll by looking for suspicious image loads, loading this DLL from unexpected locations
author: kaspersky
date: 2025-08-11
tags:
    - attack.defense-evasion
    - attack.t1574.001
logsource:
    product: windows
    category: image_load
detection:
    selection:
        ImageLoaded|endswith: 'Microsoft.VisualStudio.QualityTools.VideoRecorderEngine.dll'
    filter:
        ImageLoaded|contains: '\IDE\Extensions\TestPlatform\Extensions\'
    condition: selection
falsepositives:  Legitimate activity
level: high

Browser launch

Launching a browser with a remote debugging port specified is a highly unusual event on standard user hosts that are not running web application development or automated testing workflows. Consequently, monitoring for these specific command-line arguments can serve as a reliable indicator of this attack.

title: Launching Chrome With Debug Parameters
id: f072803f-3cf4-4537-82e6-e8b3a201d99f
status: stable
description: Detects the execution of Chromium based browsers launched with incognito mode and remote debugging enabled
author: kaspersky
date: 2025-12-11
tags:
    - attack.lateral_movement
    - attack.defense_evasion
    - attack.t1550.001
logsource:
    category: process_creation
    product: windows

detection:
    selection:
        CommandLine|contains|all:
            - '--remote-debugging-port'
            - '--headless'
    condition: selection
falsepositives: Opening a browser as part of web application testing. Legitimate activity
level: high

Revoking third-party access

To review the authorization codes granted to applications, navigate to the Google Account settings under the Third-party apps & services section, or access the following URL directly:

https://myaccount.google.com/connections

This page displays a comprehensive list of applications and services that currently have permission to access the account.
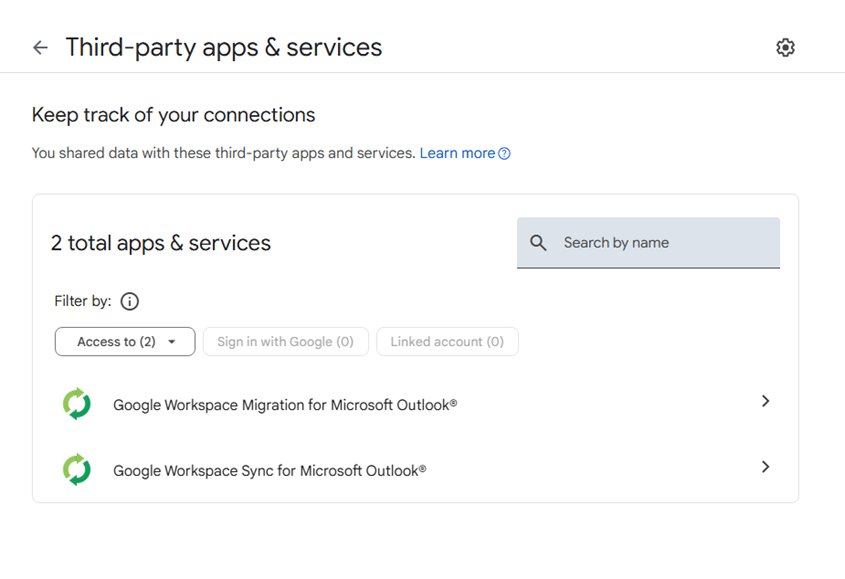
List of apps connected to the Google account

List of apps connected to the Google account

If the Google Workspace Migration for Microsoft Outlook or Google Workspace Sync for Microsoft Outlook applications appear in this list but are not actually used within your organization, revoke their access immediately. This will invalidate all potentially compromised OAuth tokens associated with them.

Risk mitigation

Launching a browser with a remote debugging port enabled is inherently suspicious for users who do not engage in web development. For these employees, you can completely disable Chromium-based browser developer tools.

This can be achieved by configuring the DeveloperToolsAvailability policy. To enforce this, set the registry value to 0x00000002 for the following Windows Registry key and restart the browser:

HKLM\Software\Policies\Google\Chrome\DeveloperToolsAvailability

To verify that the policy has been successfully applied, navigate to the browser’s internal policies page at chrome://policy:

Note that while disabling developer tools can successfully disrupt the automated retrieval of the OAuth authorization code, it will not help, however, if the adversary decides to leverage the browser’s graphical user interface (GUI) — though this manual approach is significantly less likely due to the friction it introduces for the attackers. Therefore, as a risk mitigation measure, users should be instructed to explicitly log out of their Google accounts as soon as their sessions are complete.

Takeaways

The ToddyCat APT group continues to search for ways of compromising corporate email communications. We have been tracking the group for a long time and we have observed continuous updates to its arsenal in an attempt to bypass security defenses, even as their core techniques remain consistent. For instance, the group has long relied on DLL sideloading to stealthily drop malicious utilities and scheduled tasks. However, their new tool, Umbrij, automates the attackers’ attempts to gain access to organizational email accounts. This automation not only helps increase the scale and frequency of their attacks but also demonstrates ToddyCat’s strong motivation and advanced technical skills.

To defend against these threats, corporate security teams must monitor for suspicious library loading events initiated by legitimate files, watch for instances of browsers launching in developer mode, and conduct regular audits of third-party applications and services with access permissions to Google accounts. Furthermore, deploying a robust, comprehensive security solution — such as Kaspersky Next — is critical to detect this type of malicious host-based activity in a timely manner.

Indicators of compromise

Additional information about this threat is available to customers of the Kaspersky Threat Intelligence Reporting service. Contact: intelreports@kaspersky.com.

Malicious files
1AB58838E5790EFB22F2D35AB98C0B7D              Umbrij ver. a
A7D7D6C4C3F227F7117261C63B9E23A9              Umbrij ver. a
3D3A621F852C42D97FD7260681E42508              Umbrij ver. a
3432DD9AC0DF80EF86EB80BD080F839B             Umbrij ver. a
22AAEB4946BA6D2F2E27FEB7DBB295DE             Umbrij ver. b
F61FBFB7AA1CD5DC8F70B055B51563E2              Umbrij ver. b
F169D6D172DFB775895A5E2B1540C854              Umbrij ver. c

Legitimate files leveraged for DLL sideloading

MD5 File name Name of DLL being loaded
9F5F2F0FB0A7F5AA9F16B9A7B6DAD89F GoogleDesktop.exe GoogleServices.DLL
28CB7B261F4EB97E8A4B3B0D32F8DEF1 BDSubWiz.exe log.dll
BAE82A15D1DBFB024617B9B56A8E5F66 VSTestVideoRecorder.exe Microsoft.VisualStudio.QualityTools.VideoRecorderEngine.dll

Paths to DLL sideloading files

Path to the file that loads the DLL Path to the DLL being loaded
C:\Users\<user>\AppData\Local\Temp\BDS.exe C:\Users\<user>\AppData\Local\Temp\log.dll
C:\Users\Public\BDS.exe C:\Users\Public\log.dll
c:\users\public\bdsubwiz.exe C:\Users\Public\log.dll
C:\Windows\Temp\BDS.exe C:\Windows\Temp\log.dll
c:\windows\vss\bds.exe C:\Windows\Vss\log.dll
c:\windows\temp\GoogleDesktop.exe c:\windows\temp\GoogleServices.DLL
c:\windows\temp\VSTestVideoRecorder.exe c:\windows\temp\Microsoft.VisualStudio.QualityTools.VideoRecorderEngine.dll

  • ✇Securelist
  • Wardriving assessment across Mexico: Preparing for the 2026 World Cup Isabel Manjarrez
    Introduction Mexico is one of the host countries for the 2026 FIFA World Cup, with matches to be played in three major cities: Mexico City, Monterrey, and Guadalajara. These locations are expected to see a large influx of international visitors, increasing the potential security risks. Many of those risks arise from users connecting to public wireless networks. To better understand the wireless environments that visitors may encounter, we at Kaspersky GReAT conducted a wardriving assessment in t
     

Wardriving assessment across Mexico: Preparing for the 2026 World Cup

2 de Junho de 2026, 09:00

Introduction

Mexico is one of the host countries for the 2026 FIFA World Cup, with matches to be played in three major cities: Mexico City, Monterrey, and Guadalajara. These locations are expected to see a large influx of international visitors, increasing the potential security risks. Many of those risks arise from users connecting to public wireless networks.

To better understand the wireless environments that visitors may encounter, we at Kaspersky GReAT conducted a wardriving assessment in the three host cities. The aim of the study was to analyze characteristics, deployment patterns, security configurations and potential exposure risks of public Wi-Fi infrastructure in urban wireless environments.

The information collected during the assessment was used exclusively for passive observation and infrastructure analysis. No attempts were made to authenticate, intercept communications, exploit systems or interact with the detected wireless networks beyond the publicly broadcast management information.

During processing of the collected data, one step involved filtering out networks belonging to cars or cell phones categorized as mobile hotspots because they do not represent networks that can be considered part of the assessment.

Research scope

The cities included in the study have high population density and extensive wireless infrastructure deployments. We chose areas with the most prominent wireless network activity and highly concentrated public access points. We carried out wardriving research in Monterrey back in 2008, but the city’s hotspot landscape has changed since then.

We chose the following analysis areas for each of the cities:

  1. Mexico City: México City Stadium, Mexico City International Airport, Zócalo, Paseo de la Reforma, Colonia Roma, La Condesa, Polanco, and Coyoacán.
  2. Guadalajara: Guadalajara Stadium, Guadalajara International Airport, the city center, Zapopan, Providencia, Avenida Chapultepec, Colonia Americana, Tlaquepaque, and the area around Andares.
  3. Monterrey: Monterrey Stadium, Monterrey International Airport, Fundidora Park, Cintermex Monterrey, the downtown area, Barrio Antiguo, MacroPlaza, and the San Pedro financial district.

The wireless information was collected using passive wireless reconnaissance techniques. The collected information included:

  • SSID analysis and information exposure, including BSSID-derived SSIDs
  • Default router configurations and ISP deployments
  • Frequency and signal characteristics
  • Channel congestion and spectrum usage
  • Wireless security configurations, including:
    • Open and insecure wireless networks
    • WPS-enabled networks
    • Secure networks (WPA2/WPA3) with WPS enabled

We performed a wireless infrastructure analysis in Mexico City, Guadalajara, and Monterrey. We drove through the areas surrounding the World Cup stadiums, tourist zones, and other places where fan concentrations are likely to be largest. Our goal was to evaluate the security status, deployment characteristics and operational exposure of detected wireless networks.

In total, we recorded 84,588 signals with 69,473 unique Service Set Identifiers (SSIDs) in busy locations and World Cup zones across the three cities. Mexico City accounted for 61.4% of the signals, Guadalajara for 23.6%, and Monterrey for 14.8%. Approximately 82% of the signals had a single SSID (81.9%, 81.34%, and 84% respectively). Notably, they all operate under the IEEE 802.11 standard protocol.

Particular attention was given to identifying standard deployment patterns, legacy configurations, default vendor settings and information disclosure through publicly broadcast wireless identifiers.

The following sections present the results that were obtained by analyzing wireless infrastructure across the three locations.

Our findings

SSID analysis and information exposure

SSID analysis was conducted to evaluate naming conventions, deployment standardization and potential information exposure.

Only a few networks (0.0047%) have an invisible SSID, meaning the names of these networks are not broadcast. Some users prefer to hide the SSID for various reasons, such as the network’s purpose, the profile of its users, internal policies, etc. In contrast, the rest of the networks maintained active SSID broadcasting.

SSID structures may unintentionally disclose operational details about internet service providers (ISPs), device manufacturers, deployment practices, organizational ownership or user identity. The repeated presence of default SSID naming patterns across the analyzed locations indicates a significant degree of infrastructure homogeneity and reuse of default wireless configurations. It may also facilitate passive infrastructure profiling by revealing standard characteristics in use.

Approximately 34% of the detected networks retained the default SSID naming conventions provided by the manufacturer or ISP, while 66% used customized identifiers.

Distribution of SSID naming conventions (download)

Several recurring SSID naming conventions associated with ISP-provided deployments were identified in the three cities. The most frequently observed patterns include identifiers such as “Club_Totalplay_WiFi”, “izzi WiFi”, and “Megacable WiFi”, which suggests extensive standardization of wireless infrastructure deployment. Additionally, we observed distinctive location-specific SSIDs in each area of analysis, such as “XXXX-Internet para Todos-CDMX” or “RED JALISCO”.

Most frequently observed SSID patterns (download)

Sequential SSID naming structures were also identified during the analysis. Patterns such as “INFINITUMXX” and “IZZI-XX” suggest automated ISP deployment and large-scale deployment strategies.

We identified 33 unique sequential naming structures among the 137 sequential SSIDs in total, representing approximately 0.16% of the detected wireless networks.

The following graph shows the top five sequential SSID patterns found in the largest number of networks:

Five most frequently observed sequential patterns (download)

Several customized SSIDs contained personal or organizational identifiers, including family names, professions, addresses or internal department references. Although personalized SSIDs may simplify local network identification for users, they may also expose sensitive information that could be useful for social engineering, physical targeting, or organizational profiling.

BSSID-derived SSID

During the analysis, multiple networks were identified that used the physical MAC address of a Wi-Fi access point (BSSID) as the visible SSID. This practice exposes hardware-level information that could facilitate vendor fingerprinting and targeted reconnaissance activities.

The organizationally unique identifier (OUI) contained in the first bytes of the BSSID identifies the equipment manufacturer. Threat actors can correlate exposed manufacturers with device-specific vulnerabilities.

BSSID-derived SSID by city (download)

Notably, we found that more than 30% of networks in all three cities reuse the MAC address as the SSID.

Default router configurations and ISP deployments

We performed wireless infrastructure profiling to identify the most common wireless equipment manufacturers and ISP deployments across the three locations.

Large-scale ISP deployments frequently use standardized wireless configurations and vendor-specific hardware platforms. Identifying dominant manufacturers and ISP naming conventions can provide insight into infrastructure and deployment practices facilitating the mapping of standardized attack surfaces.

The following figure shows the distribution of the most commonly used manufacturers.

Most frequently observed wireless equipment manufacturers (download)

The manufacturer analysis revealed a strong concentration of wireless infrastructure among a limited number of vendors. Across the three locations, Huawei Technologies, MediaTek-based devices, and other manufacturers’ equipment that is distributed through ISP channels represented a significant portion of the detected deployments. Mexico City had the most diverse infrastructure, while Monterrey and Guadalajara had a greater concentration of wireless equipment known as SOHO (small office/home office) or residential-grade hardware. The widespread presence of standard vendor platforms may facilitate infrastructure fingerprinting and large-scale targeting of known device-specific vulnerabilities.

Most frequently observed wireless equipment manufacturers across the three cities (download)

ISP deployments frequently exhibited standardized configuration patterns and recurring manufacturer identifiers. Our ISP deployment analysis revealed a high concentration of access points associated with major residential internet providers. Deployments associated with Infinitum, Totalplay and Izzi represented a substantial portion of the detected wireless infrastructure across all locations. These findings suggest a high degree of deployment standardization across networks associated with major residential internet providers. This observation was supported by the repeated presence of ISP-associated SSIDs such as “Infinitum”, “Totalplay”, and “Izzi”, combined with manufacturer identifiers frequently associated with consumer equipment, including Huawei, ZTE and other residential wireless equipment vendors.

It is important to note that, for this analysis, ISPs were primarily inferred from SSID naming conventions and manufacturer fingerprint data. A significant portion of the detected wireless networks fell into the “UNKNOWN/CUSTOM” category. This classification includes custom hotspots and networks whose naming conventions did not expose identifiable ISP-associated patterns. The findings suggest that many users and organizations (as we saw previously, approximately 66%) use custom network names, limiting direct provider attribution.

The following figure illustrates the distribution of ISP-associated wireless deployments in general.

Most frequently observed ISPs (download)

To better understand this distribution, we took the most frequently observed ISPs by city.

Most frequently observed ISPs across the three cities (download)

Frequency and signal characteristics

We also analyzed wireless signal characteristics to evaluate coverage quality, signal strength, and frequency band utilization in the three cities. In dense urban environments, signal quality and frequency spectrum distribution can affect wireless reliability, client connectivity, roaming performance, and overall network efficiency.

Signal quality analysis revealed that a substantial portion of the detected access points operated under weak or very weak signal conditions. Monterrey had the highest percentage of very weak signals, with approximately 50% of detected deployments. Similar patterns were observed in Guadalajara and Mexico City, suggesting high-density wireless environments with overlapping coverage areas. Only a limited percentage of networks were classified within the very good or excellent signal categories across the three locations.

Signal quality distribution by city (download)

Signal stability analysis revealed that most detected wireless deployments exhibited stable beacon transmission behavior. More than 96% of the detected access points across all locations were classified as stable, while only a small percentage exhibited unstable or indeterminate signal behavior.

These findings imply that the majority of the wireless infrastructure observed during the assessment corresponded to permanently deployed access points rather than transient or intermittent wireless devices.

Signal stability status (download)

Frequency band analysis revealed the strong prevalence of 2.4 GHz wireless deployments across the three locations. More than 95% of the detected wireless networks operated within the 2.4 GHz spectrum, while only a small percentage of deployments were classified under the unknown or non-standard frequency categories. This uneven distribution reflects the continued prevalence of legacy-compatible wireless infrastructure and SOHO deployments.

Frequency band utilization (download)

These findings are consistent with dense urban wireless environments with large numbers of access points in restricted spectrum allocations.

Channel congestion and spectrum usage

Next, we analyzed wireless channel utilization to evaluate frequency spectrum congestion and channel allocation patterns across the three cities. Our analysis focused on the 2.4 GHz spectrum, where channel overlap and high access point density commonly produce interference and degraded wireless performance. In densely populated wireless environments, an excessive concentration of access points on a limited number of channels can lead to co-channel interference, packet collisions, reduced throughput, and degraded network stability.

Spectrum congestion analysis revealed that the 2.4 GHz band consistently experienced elevated congestion levels across the three cities. The detailed results showed a strong concentration of deployments on channels 11, 6 and 1, which are traditionally recommended as non-overlapping channels within the 2.4 GHz spectrum. Channel 11 was the most utilized channel, accounting for 25.2% of the detected access points, followed by channel 6 with 22.5% and channel 1 with 19.5%. This distribution indicates that most wireless deployments adhere to standard channel allocation practices for 2.4 GHz Wi-Fi environments.

The following figure illustrates the overall distribution of the most frequently utilized wireless channels.

Most utilized wireless channels (download)

To further assess wireless spectrum saturation, the detected access points were grouped according to channel congestion levels: VERY_HIGH, HIGH, UNKNOWN, MEDIUM, LOW and NONE.

Mexico City had the highest proportion of heavily congested wireless channels, with approximately 7% of detected access points operating under HIGH congestion conditions. Guadalajara followed with nearly 5% of deployments categorized as HIGH congestion, while Monterrey had the lowest percentage at approximately 3.29%.

These findings suggest that wireless spectrum saturation increases proportionally with urban infrastructure density and access point concentration. Despite the presence of congested deployments, most detected access points were categorized as LOW or MEDIUM congestion, suggesting severe spectrum saturation was localized rather than uniformly distributed.

Channel congestion by city (download)

A thorough analysis of individual channel utilization revealed that channels 11, 6 and 1 consistently experienced the highest congestion levels across the three cities, which correlates with our previous findings. These channels accounted for the majority of VERY_HIGH congestion classifications, particularly within the 2.4 GHz band.

In Mexico City, channel 11 alone accounted for more than 25% of detected deployments and consistently exhibited VERY_HIGH congestion levels.

This behavior reflects the limited availability of non-overlapping channels within the 2.4 GHz spectrum and the widespread reliance on default wireless configurations.

Most congested channels by city (download)

Overall, the channel utilization analysis showed that wireless deployments are concentrated heavily within the traditional, non-overlapping 2.4 GHz channels. While this strategy reduces adjacent-channel interference, excessive access point density on the same channels can still produce significant co-channel contention and poor wireless performance in high-density urban environments.

Wireless security configurations

The next thing we evaluated was the security posture of the detected wireless networks. We analyzed the wireless security configurations advertised by access points in each of the locations.

Overall security configuration distribution

The analysis revealed that WPA2 was the dominant wireless authentication mechanism across the three cities. Mexico City had the highest WPA2 adoption rate at 81.19%, followed by Monterrey at 79.19% and Guadalajara at 77.59%.

The study found that every 6th open access point (17%) was unsafe, namely 16.5% in Mexico City, 18.5% in Guadalajara, and 17.2% in Monterrey. Open wireless deployments were consistently present across all locations, ranging between 10% and 12% of detected access points. These findings show that despite the widespread deployment of modern wireless security standards, encryption adoption remains incomplete.

Distribution of wireless authentication mechanisms across the three locations (download)

To simplify the interpretation of wireless security posture, we grouped detected networks into four categories:

  • Secure (WPA2/WPA3)
  • Insecure (Open/WEP)
  • Weak (WPA)
  • Unknown

Across the three locations, secure networks comprised most of detected deployments, accounting for approximately 82% of all access points. However, insecure open networks still account for between 10% and 12% of detected wireless infrastructure, consistent with our previous findings. It is important to mention that networks within the unknown category are not considered secure.

Mexico City had the highest percentage of secure deployments at 83.54%, while Guadalajara had the highest percentage of insecure open networks at 12.46%. Although Monterrey had the lowest percentage of insecure networks, open deployments still accounted for more than 10% of the detected access points.

Wireless security posture grouping across the three locations (download)

Although modern WPA2/WPA3 encryption standards dominate current wireless deployments, the continued presence of open and legacy WPA deployments indicates that insecure wireless configurations remain relevant from an operational standpoint. These networks may expose users to passive traffic interception, unauthorized monitoring, rogue access point attacks, and credential harvesting techniques.

WPS-enabled networks

We also analyzed Wi-Fi Protected Setup (WPS) in all the locations to evaluate additional attack surfaces. WPS is a standard feature on wireless routers that enables devices such as printers, repeaters or mobile phones to connect to a secure Wi-Fi network without manually entering a long password, typically through a PIN-based enrolled mechanism. Although WPA2 and WPA3 provide strong encryption mechanisms, the presence of WPS can introduce security weaknesses due to inherently vulnerable PIN-based enrollment methods.

By combining detections from the three locations, we found that 55% of all detected access points did not advertise WPS capabilities, leaving 45% of deployments vulnerable to WPS-based abuse. These results suggest that, despite the adoption of modern encryption standards, a significant portion of wireless infrastructure continues to expose legacy convenience features.

During the analysis, we found that Mexico City had the highest proportion of WPS-enabled networks, with 46.61% of the detected access points advertising WPS capabilities. Guadalajara was second with 43.45%, while Monterrey had the lowest proportion at 40.93%.

The percentage of detected access points advertising WPS capabilities across the three locations (download)

Almost half of the detected wireless networks in each city continued to advertise WPS, indicating that WPS prevalence is consistently high across the three cities.

Secure networks with WPS enabled

In many cases, networks classified as secure because of WPA2/WPA3 encryption still had WPS functionality enabled, which effectively increased the available attack surface.

To further assess the relationship between encryption strength and WPS exposure, we conducted a secondary analysis of secure networks (WPA2/WPA3) only. The results showed that around half of all secure deployments still exposed WPS, with the following breakdown for each city:

  • Mexico City: 53.7%
  • Guadalajara: 50.9%
  • Monterrey: 47.5%

The proportion of secure networks with WPS enabled across the three locations (download)

These findings indicate that encryption strength alone is not enough to evaluate wireless security posture because additional protocol features, such as WPS, may still expose exploitable attack vectors.

Additional security considerations

Overall, travelers operating within dense public environments are exposed not only to insecure wireless infrastructure but also to various risks associated with digital interactions. These risks include many threats, from public USB charging systems and phishing QR codes to proximity-based protocols and exposure to shared public devices, such as interactive totems or kiosks. One particular point that should be taken into account in light of our research is the issue of rogue wireless deployments.

Rogue access points are not necessarily malicious; they may be set up accidentally by misconfiguring router settings. An entry point for potential compromise might be caused by various misconfigurations, from a weak password to an insecure protocol. However, attackers deploy such unauthorized hotspots with malicious intent to infiltrate a network. Threat actors may deploy rogue access points posing as legitimate public wireless networks in airports, hotels, cafés and tourist areas. These deployments are called “evil twins” and can trick users into connecting to attacker-controlled infrastructure capable of intercepting traffic, harvesting credentials, or performing man-in-the-middle attacks. Further risk lies in the potential compromise of local network devices or even malware distribution. Such threats complement our findings, underscoring the importance of implementing traffic encryption, using a security solution and exercising extreme caution while browsing via public networks.

Conclusion

The wardriving assessment conducted in Mexico City, Guadalajara, and Monterrey revealed that modern wireless infrastructure continues to present multiple forms of operational exposure despite the widespread adoption of WPA2 and WPA3 security standards. The analysis demonstrated that wireless environments are highly standardized in all the locations, with recurring ISP deployments, default SSID naming conventions, homogeneous manufacturer distribution, and predictable channel allocation practices observed in all three cities.

Although most of the detected networks were classified as secure under WPA2/WPA3 authentication mechanisms, a significant proportion were exposing additional attack surfaces through enabled WPS functionality, default configurations, sequential SSID structures, and infrastructure metadata disclosure. This demonstrates that encryption strength alone is insufficient for evaluating the overall security posture of wireless infrastructure. Additionally, the prevalence of open networks and legacy wireless configurations indicates that insecure deployments are still operationally relevant in all the locations.

The results also showed that wireless infrastructure is heavily concentrated within the 2.4 GHz spectrum, particularly around channels 11, 6, and 1. This leads to elevated congestion and increased co-channel interference in densely populated urban environments.

SSID analysis further revealed that publicly broadcast wireless identifiers frequently expose valuable operational information about ISPs, equipment manufacturers, deployment templates, organizational ownership, and user-defined naming practices. The identification of default ISP naming conventions, sequential SSID structures, and BSSID-derived SSIDs demonstrated that many deployments prioritize operational convenience and simplicity over exposure minimization and privacy.

The scope of the threats stemming from vulnerable wireless configurations poses serious digital exposure risks for users. The widespread presence of standard deployments, predictable SSID naming and publicly exposed infrastructure identifiers can facilitate passive reconnaissance, infrastructure fingerprinting and opportunistic targeting.

Recommendations

To minimize the risks of wireless-based exposure and the attack surface related to hotspot infrastructure, we recommend taking the following measures:

  • Disable WPS functionality on wireless routers whenever possible, particularly within WPA2/WPA3 deployments.
  • Avoid using default SSID naming conventions that disclose ISP providers, router manufacturers, or deployment templates.
  • Refrain from using personal, organizational, or location-based identifiers in wireless network names.
  • Avoid configuring SSID using BSSID or naming conventions derived from MAC addresses, as these may expose hardware fingerprinting information.
  • Promote migration toward modern WPA3-capable infrastructure while removing legacy wireless protocols when operationally feasible.
  • Reduce wireless congestion by optimizing channel allocation strategies and minimizing excessive dependence on the 2.4 GHz spectrum.
  • Encourage adoption of 5 GHz and newer wireless technologies to reduce interference and improve spectrum efficiency.

The findings presented in this assessment emphasize the importance of combining strong wireless encryption standards, secure deployment practices, exposure minimization strategies, and user awareness to enhance the overall security posture of wireless environments.

  • ✇Securelist
  • IT threat evolution in Q1 2026. Non-mobile statistics AMR
    IT threat evolution in Q1 2026. Non-mobile statistics IT threat evolution in Q1 2026. Mobile statistics The statistics in this report are based on detection verdicts returned by Kaspersky products unless otherwise stated. The information was provided by Kaspersky users who consented to sharing statistical data. Quarterly figures In Q1 2026: Kaspersky products blocked more than 343 million attacks that originated with various online resources. Web Anti-Virus responded to 50 million unique links.
     

IT threat evolution in Q1 2026. Non-mobile statistics

Por:AMR
18 de Maio de 2026, 09:00

IT threat evolution in Q1 2026. Non-mobile statistics
IT threat evolution in Q1 2026. Mobile statistics

The statistics in this report are based on detection verdicts returned by Kaspersky products unless otherwise stated. The information was provided by Kaspersky users who consented to sharing statistical data.

Quarterly figures

In Q1 2026:

  • Kaspersky products blocked more than 343 million attacks that originated with various online resources.
  • Web Anti-Virus responded to 50 million unique links.
  • File Anti-Virus blocked nearly 15 million malicious and potentially unwanted objects.
  • 2938 new ransomware variants were detected.
  • More than 77,000 users experienced ransomware attacks.
  • 14% of all ransomware victims whose data was published on threat actors’ data leak sites (DLS) were victims of Clop.
  • More than 260,000 users were targeted by miners.

Ransomware

Quarterly trends and highlights

Law enforcement success

In January 2026, it was reported that the FBI had seized the domains of the RAMP cybercrime forum, a major platform used extensively by ransomware developers to advertise their RaaS programs and to recruit affiliates. There has been no official statement from the FBI, nor is it clear if RAMP servers were seized. In a post on an external website, a RAMP moderator mentioned law enforcement agencies gaining control over the forum. The takedown disrupted a key element of the RaaS ecosystem, creating ripple effects for ransomware operators, affiliates, and initial access brokers.

A man suspected of links to the Phobos group was apprehended in Poland. He was charged with the creation, acquisition, and distribution of software designed for unlawfully obtaining information, including data that facilitates unauthorized access to information stored within a computer system.

In March, a Phobos ransomware administrator pleaded guilty to the creation and distribution of the Trojan, which had been used in international attacks dating back to at least November 2020.

In March, the U.S. Department of Justice charged a man who had acted as a negotiator for ransomware groups. The company he worked for specializes in cyberincident investigations. The prosecution alleges the suspect colluded with the BlackCat threat actor to share privileged insights into the ongoing progress of negotiations. Additionally, the suspect is alleged to have had a prior direct role in BlackCat attacks, serving as an affiliate for the RaaS operation.

In a separate development this March, a U.S. court sentenced an initial access broker associated with the Yanluowang ransomware group to 81 months of imprisonment. According to the U.S. Department of Justice, the convict facilitated dozens of ransomware attacks across the United States, resulting in over $9 million in actual loss and more than $24 million in intended loss.

Vulnerabilities and attacks

The Interlock group has been heavily exploiting the CVE-2026-20131 zero-day vulnerability in Cisco Secure FMC firewall management software since at least January 26, 2026. The vulnerability enabled arbitrary Java code execution with root privileges on the affected device. This campaign demonstrates the ongoing reliance on zero-day vulnerabilities for initial access, a focus on network appliances as high-value entry points, and the rapid weaponization of new vulnerabilities within the ransomware ecosystem.

The most prolific groups

This section highlights the most prolific ransomware gangs by number of victims added to each group’s DLS. This quarter, the Clop ransomware (14.42%) returned to the top of the rankings, displacing Qilin (12.34%), which had held the leading position in the previous reporting period. Following closely is a new threat actor, The Gentlemen (9.25%). Emerging no later than July 2025, the group had already surpassed the activity levels of mainstays such as Akira (7.25%) and INC Ransom (6.13%).

Number of each group’s victims according to its DLS as a percentage of all groups’ victims published on all the DLSs under review during the reporting period (download)

Number of new variants

In Q1 2026, Kaspersky solutions detected six new ransomware families and 2938 new modifications. Volumes have returned to Q3 2025 levels following a surge in Q4 2025.

Number of new ransomware modifications, Q1 2025 — Q1 2026 (download)

Number of users attacked by ransomware Trojans

Throughout Q1, our solutions protected 77,319 unique users from ransomware. Ransomware activity was highest in March, with 35,056 unique users encountering such attacks during the month.

Number of unique users attacked by ransomware Trojans, Q1 2026 (download)

Attack geography

TOP 10 countries and territories attacked by ransomware Trojans

Country/territory* %**
1 Pakistan 0.79
2 South Korea 0.64
3 China 0.52
4 Tajikistan 0.40
5 Libya 0.38
6 Turkmenistan 0.36
7 Iraq 0.35
8 Bangladesh 0.33
9 Rwanda 0.30
10 Cameroon 0.28

* Excluded are countries and territories with relatively few (under 50,000) Kaspersky users.
** Unique users whose computers were attacked by ransomware Trojans as a percentage of all unique users of Kaspersky products in the country/territory.

TOP 10 most common families of ransomware Trojans

Name Verdict %*
1 (generic verdict) Trojan-Ransom.Win32.Gen 33.90
2 (generic verdict) Trojan-Ransom.Win32.Crypren 6.38
3 WannaCry Trojan-Ransom.Win32.Wanna 5.87
4 (generic verdict) Trojan-Ransom.Win32.Encoder 4.68
5 (generic verdict) Trojan-Ransom.Win32.Agent 3.80
6 LockBit Trojan-Ransom.Win32.Lockbit 2.80
7 (generic verdict) Trojan-Ransom.Win32.Phny 1.99
8 (generic verdict) Trojan-Ransom.MSIL.Agent 1.96
9 (generic verdict) Trojan-Ransom.Python.Agent 1.93
10 (generic verdict) Trojan-Ransom.Win32.Crypmod 1.89

* Unique Kaspersky users attacked by the specific ransomware Trojan family as a percentage of all unique users attacked by this type of threat.

Miners

Number of new variants

In Q1 2026, Kaspersky solutions detected 3485 new modifications of miners.

Number of new miner modifications, Q1 2026 (download)

Number of users attacked by miners

In Q1, we detected attacks using miner programs on the computers of 260,588 unique Kaspersky users worldwide.

Number of unique users attacked by miners, Q1 2026 (download)

Attack geography

TOP 10 countries and territories attacked by miners

Country/territory* %**
1 Senegal 3.19
2 Turkmenistan 3.06
3 Mali 2.63
4 Tanzania 1.62
5 Bangladesh 1.06
6 Ethiopia 0.95
7 Panama 0.88
8 Afghanistan 0.79
9 Kazakhstan 0.77
10 Bolivia 0.75

* Excluded are countries and territories with relatively few (under 50,000) Kaspersky users.
** Unique users whose computers were attacked by miners as a percentage of all unique users of Kaspersky products in the country/territory.

Attacks on macOS

In Q1 2026, Google uncovered a new cryptocurrency theft campaign. The scammers directed victims to a fraudulent video call, prompting them to execute malicious scripts under the guise of technical support fixes for connection problems.

In March, researchers with GTIG and iVerify reported the discovery of an in-the-wild exploit chain targeting both iOS and macOS devices. The exploit kit was apparently marketed on the dark web, providing threat actors with a suite of spyware capabilities alongside specialized cryptocurrency exfiltration modules. The exploit was delivered via drive-by downloads when victims visited various compromised websites. Our analysis confirmed that the toolkit included an updated version of a component previously identified in the Operation Triangulation attack chain.

Devices running macOS were similarly impacted by the high-profile supply chain attack targeting the Axios npm package, a widely used HTTP client for JavaScript. The installation of the infected package led to the deployment of a backdoor on macOS devices.

TOP 20 threats to macOS

Unique users* who encountered this malware as a percentage of all attacked users of Kaspersky security solutions for macOS (download)

* Data for the previous quarter may differ slightly from previously published data due to some verdicts being retrospectively revised.

The share of PasivRobber spyware attacks is beginning to decline, giving way to more traditional adware and Monitor-class software capable of tracking user activity. The popular Amos stealer also maintains its presence within the TOP 20.

Geography of threats to macOS

TOP 10 countries and territories by share of attacked users

Country/territory %* Q4 2025 %* Q1 2026
China 1.28 1.97
France 1.18 1.07
Brazil 1.13 0.98
Mexico 0.72 0.52
Germany 0.71 0.45
The Netherlands 0.62 0.75
Hong Kong 0.49 0.53
India 0.42 0.48
Russian Federation 0.34 0.37
Thailand 0.24 0.27

* Unique users who encountered threats to macOS as a percentage of all unique Kaspersky users in the country/territory.

IoT threat statistics

This section presents statistics on attacks targeting Kaspersky IoT honeypots. The geographic data on attack sources is based on the IP addresses of attacking devices.

In Q1 2026, the share of devices attacking Kaspersky honeypots via the SSH protocol saw a significant increase compared to the previous reporting period.

Distribution of attacked services by number of unique IP addresses of attacking devices (download)

The distribution of attacks between Telnet and SSH maintained the ratio observed in Q4 2025.

Distribution of attackers’ sessions in Kaspersky honeypots (download)

TOP 10 threats delivered to IoT devices

Share of each threat delivered to an infected device as a result of a successful attack, out of the total number of threats delivered (download)

The primary shifts in the IoT threat distribution are linked to the activity of various Mirai botnet variants, although members of this family continue to account for the majority of the list. Furthermore, a new variant, Mirai.kl, surfaced in the rankings. We also observed a significant decline in NyaDrop botnet activity during Q1.

Attacks on IoT honeypots

The United States, the Netherlands, and Germany accounted for the highest proportions of SSH-based attacks during this period.

Country/territory Q4 2025 Q1 2026
United States 16.10% 23.74%
The Netherlands 15.78% 17.57%
Germany 12.07% 10.34%
Panama 7.72% 6.34%
India 5.32% 6.05%
Romania 4.05% 5.82%
Australia 1.62% 4.61%
Vietnam 4.21% 3.50%
Russian Federation 3.79% 2.35%
Sweden 2.25% 2.09%

China continues to account for the largest proportion of Telnet attacks, though there was a marked increase in activity originating from Pakistan.

Country/territory Q4 2025 Q1 2026
China 53.64% 39.54%
Pakistan 14.27% 27.31%
Russian Federation 8.20% 8.25%
Indonesia 8.58% 6.71%
India 4.85% 4.66%
Brazil 0.06% 3.30%
Argentina 0.02% 2.51%
Nigeria 1.22% 1.38%
Thailand 0.01% 0.55%
Sweden 0.54% 0.55%

Attacks via web resources

The statistics in this section are based on detection verdicts by Web Anti-Virus, which protects users when suspicious objects are downloaded from malicious or infected web pages. These malicious pages are purposefully created by cybercriminals. Websites that host user-generated content, such as message boards, as well as compromised legitimate sites, can become infected.

TOP 10 countries and territories that served as sources of web-based attacks

The following statistics show the distribution by country/territory of the sources of internet attacks blocked by Kaspersky products on user computers (web pages redirecting to exploits, sites containing exploits and other malicious programs, botnet C&C centers, and so on). One or more web-based attacks could originate from each unique host.

To determine the geographic source of web attacks, we matched the domain name with the real IP address where the domain is hosted, then identified the geographic location of that IP address (GeoIP).

In Q1 2026, Kaspersky solutions blocked 343,823,407 attacks launched from internet resources worldwide. Web Anti-Virus was triggered by 49,983,611 unique URLs.

Web-based attacks by country/territory, Q1 2026 (download)

Countries and territories where users faced the greatest risk of online infection

To assess the risk of malware infection via the internet for users’ computers in different countries and territories, we calculated the share of Kaspersky users in each location on whose computers Web Anti-Virus was triggered during the reporting period. The resulting data provides an indication of the aggressiveness of the environment in which computers operate in different countries and territories.

This ranked list includes only attacks by malicious objects classified as Malware. Our calculations leave out Web Anti-Virus detections of potentially dangerous or unwanted programs, such as RiskTool or adware.

Country/territory* %**
1 Venezuela 9.33
2 Hungary 8.16
3 Italy 7.58
4 Tajikistan 7.48
5 India 7.21
6 Greece 7.13
7 Portugal 7.10
8 France 7.05
9 Belgium 6.83
10 Slovakia 6.80
11 Vietnam 6.62
12 Bosnia and Herzegovina 6.57
13 Canada 6.56
14 Serbia 6.50
15 Tunisia 6.36
16 Qatar 6.01
17 Spain 5.95
18 Germany 5.95
19 Sri Lanka 5.89
20 Brazil 5.88

* Excluded are countries and territories with relatively few (under 10,000) Kaspersky users.
** Unique users targeted by web-based Malware attacks as a percentage of all unique users of Kaspersky products in the country/territory.

On average during the quarter, 4.73% of users’ computers worldwide were subjected to at least one Malware web attack.

Local threats

Statistics on local infections of user computers are an important indicator. They include objects that penetrated the target computer by infecting files or removable media, or initially made their way onto the computer in non-open form. Examples of the latter are programs in complex installers and encrypted files.

Data in this section is based on analyzing statistics produced by anti-virus scans of files on the hard drive at the moment they were created or accessed, and the results of scanning removable storage media. The statistics are based on detection verdicts from the On-Access Scan (OAS) and On-Demand Scan (ODS) modules of File Anti-Virus and include detections of malicious programs located on user computers or removable media connected to the computers, such as flash drives, camera memory cards, phones, or external hard drives.

In Q1 2026, our File Anti-Virus detected 15,831,319 malicious and potentially unwanted objects.

Countries and territories where users faced the highest risk of local infection

For each country and territory, we calculated the percentage of Kaspersky users whose computers had the File Anti-Virus triggered at least once during the reporting period. This statistic reflects the level of personal computer infection in different countries and territories around the world.

Note that this ranked list includes only attacks by malicious objects classified as Malware. Our calculations leave out File Anti-Virus detections of potentially dangerous or unwanted programs, such as RiskTool or adware.

Country/territory* %**
1 Turkmenistan 47.96
2 Tajikistan 31.48
3 Cuba 31.03
4 Yemen 29.59
5 Afghanistan 28.47
6 Burundi 26.93
7 Uzbekistan 24.81
8 Syria 23.08
9 Nicaragua 21.97
10 Cameroon 21.60
11 China 21.09
12 Mozambique 21.02
13 Algeria 20.64
14 Democratic Republic of the Congo 20.63
15 Bangladesh 20.44
16 Mali 20.35
17 Republic of the Congo 20.23
18 Madagascar 20.00
19 Belarus 19.78
20 Tanzania 19.52

* Excluded are countries and territories with relatively few (under 10,000) Kaspersky users.
** Unique users on whose computers local Malware threats were blocked, as a percentage of all unique users of Kaspersky products in the country/territory.

On average worldwide, Malware local threats were detected at least once on 11.55% of users’ computers during Q1.

Russia scored 11.92% in these rankings.

  • ✇Securelist
  • Websites with an undefined trust level: avoiding the trap Lama Saqqour · Anna Larkina
    Executive summary A suspicious website is a web resource that cannot be definitively classified as phishing, but whose activities are unsafe. Such sites manipulate users, tricking them into voluntarily transferring money for non-existent services, signing up for hidden subscriptions, or disclosing personal data through carefully crafted terms of service. These include fake online stores, dubious crypto exchanges, investment platforms, and services with paid subscriptions. Kaspersky has introduc
     

Websites with an undefined trust level: avoiding the trap

6 de Maio de 2026, 06:30

Executive summary

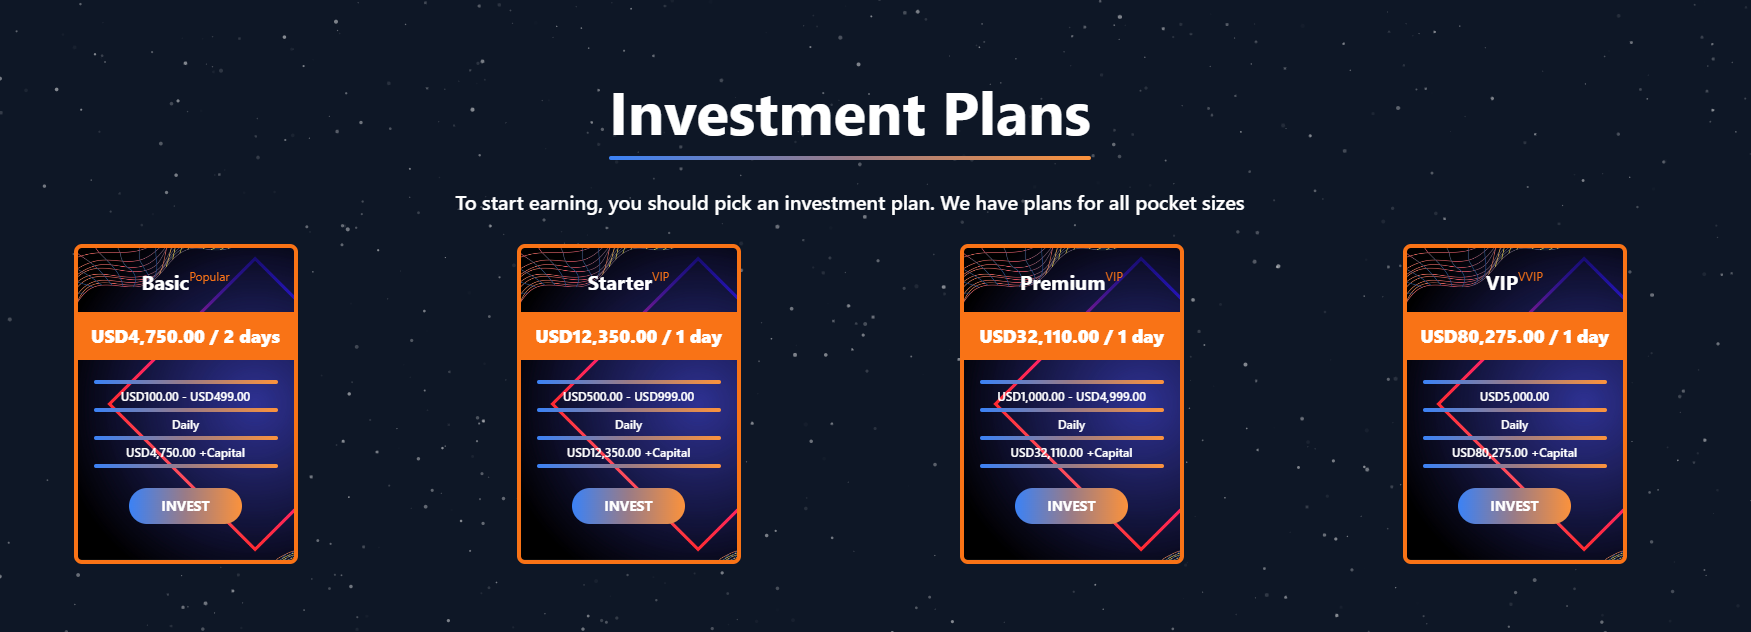
  • A suspicious website is a web resource that cannot be definitively classified as phishing, but whose activities are unsafe. Such sites manipulate users, tricking them into voluntarily transferring money for non-existent services, signing up for hidden subscriptions, or disclosing personal data through carefully crafted terms of service. These include fake online stores, dubious crypto exchanges, investment platforms, and services with paid subscriptions.
  • Kaspersky has introduced a new web filtering category, “Sites with an undefined trust level,” into its security products (Kaspersky Premium, Android and iOS apps, etc.). The system analyzes the domain name and age, IP address reputation, DNS configuration, HTTP security headers, and SSL certificate to automatically detect suspicious resources.
  • According to Kaspersky data for January 2026, the most widespread global threat is fake browser extensions that mimic security products — they were detected in 9 out of 10 regions analyzed worldwide. Such extensions intercept browser data, track user activity, hijack search queries, and inject ads.
  • Kaspersky’s regional statistics reveal the specific nature of these threats: in Africa, over 90% of the top 10 suspicious websites are online trading scam platforms; in Latin America, fake betting services predominate; in Russia, fake binary options brokers and “educational platforms” with fraudulent subscriptions lead the way; in CIS countries — crypto scams and bots for inflating engagement.
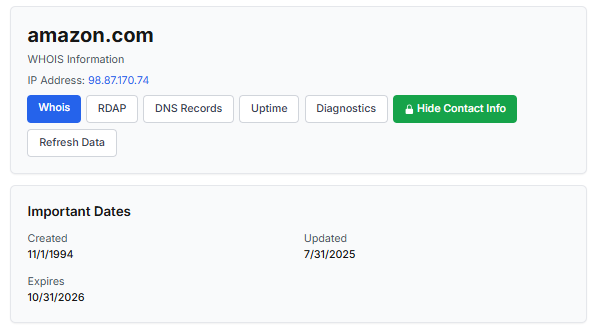
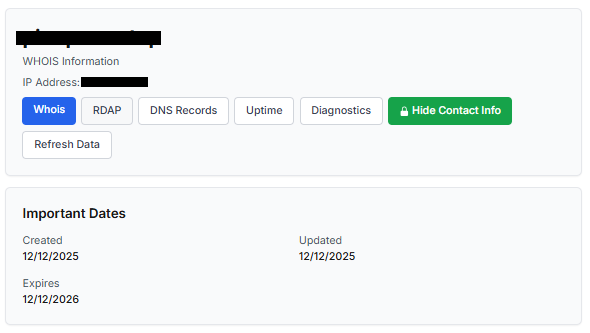
  • Key indicators of a suspicious website to check: a strange domain name with numbers or random characters, cheap top-level domains (.xyz, .top, .shop), a recently registered domain (less than 6 months old according to WHOIS data), unrealistic promises (“100% guaranteed income,” “up to 300% profit”), lack of company contact information, and payments only via cryptocurrency or irreversible bank transfers.

Introduction

The online landscape is filled with various traps lying in wait for users. One such threat involves websites that can’t be strictly classified as phishing, yet whose activities are inherently unsafe. These sites often operate on the fringes of the law, even if they aren’t directly violating it. Sometimes they use a cleverly crafted Terms of Service document as a loophole. These agreements might include clauses such as no-refund policies or forced automatic subscription renewals.

Fake online stores, dubious financial platforms, and various online services that mimic legitimate business operations are all categorized as suspicious. Unlike actual phishing sites, which aim to steal sensitive data like banking credentials or passwords, these suspicious sites represent a far more cunning trap. Their goal is manipulation: tricking the victim into willingly paying for non-existent goods and services or signing them up for a subscription that’s nearly impossible to cancel. Beyond financial gain, these sketchy websites may also hunt for personal data to sell later on the dark web.

Our solutions categorize them as having an “undefined trust level”. This article explains what these sites look like, how to identify them, and what you can do to stay safe.

The dangers of shady websites

One of the biggest risks associated with making a purchase from an untrusted website that seems to be an online store is the financial loss and falling victim to fraud. Fake shops will entice you with attractive deals to get you hooked. After you pay, you may never receive what you paid for, or you may receive some cheap piece of unusable junk instead of the item you ordered. Investment or “guaranteed income” programs are another type of classic scam — they promise rapid returns, and once they take your deposits, they disappear without a trace.

Visiting or buying from untrusted suspicious websites can expose you to various risks that go beyond a single bad purchase. Fraudulent websites often collect your personal information even if you do not end up making a purchase. By completing a form or signing up for a “free offer”, you may be providing the scammer with access to your information.

Personal data collection can happen in a fairly straightforward and obvious way — for instance, through a standard order delivery form. In this scenario, attackers end up with sensitive information like the user’s full name, shipping and billing addresses, phone number, email address, and, of course, payment details. As we’ve previously discussed, fraudsters sell this kind of information, and there’re countless ways it can be used down the line. For example, this data might be leveraged for spam campaigns or more serious threats like stalking or targeted attacks.

Common types of suspicious sites

Let’s take a closer look at the different types of shady sites out there and how interacting with them can lead to financial loss, data leaks, the unauthorized use of personal information, and other consequences.

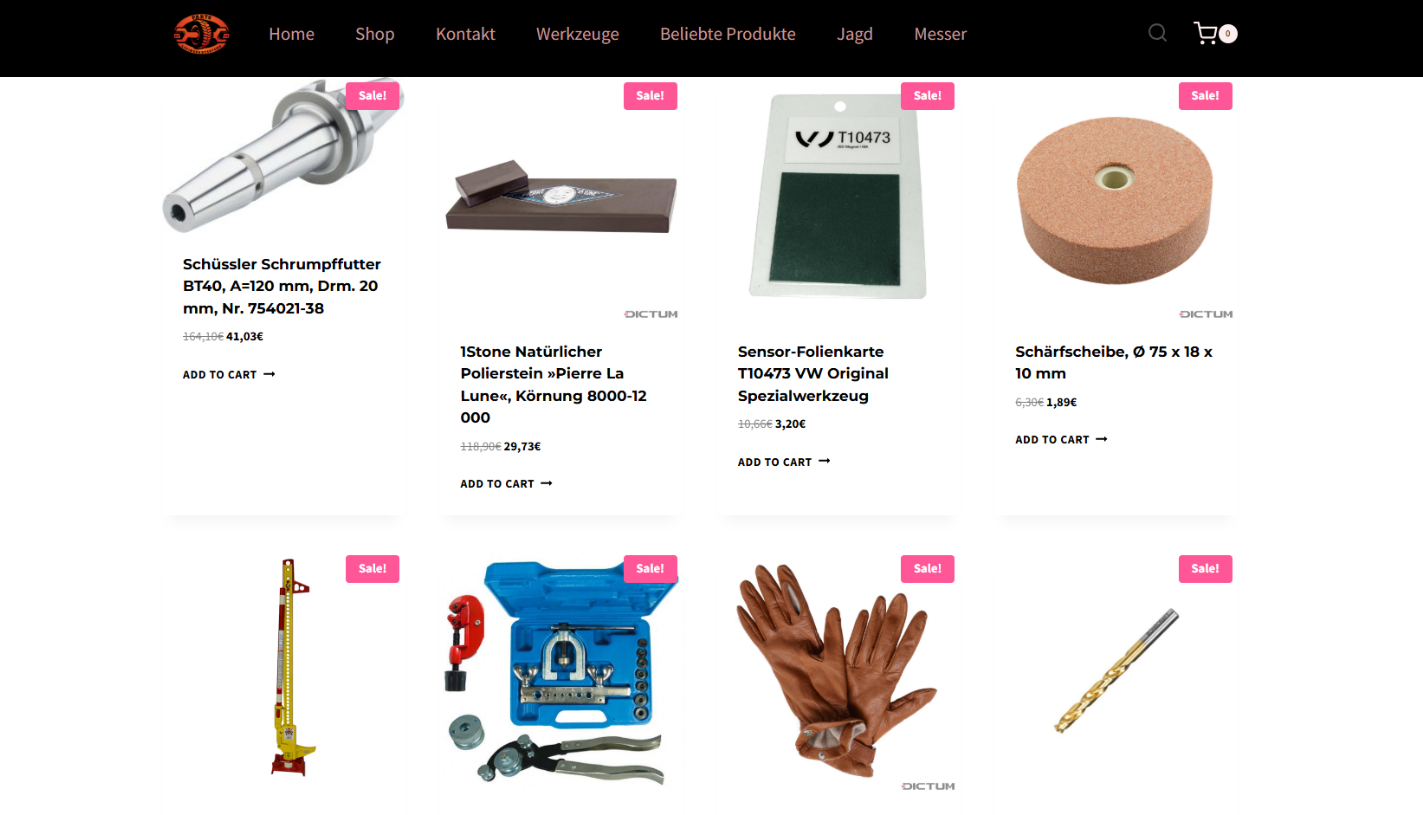
It’s worth noting that rogue websites can masquerade as legitimate ones in almost any industry. The first type of fraudulent site we’ll look at is fake online stores. These can appear as clones of real brand websites or as standalone stores. Usually, the scam follows one of two paths: the buyer either receives a counterfeit or poor-quality product, or they receive nothing at all. These sites lure victims in with suspiciously low prices and “exclusive” deals. Often, users are subjected to psychological pressure: the time to make a purchase decision is purposefully limited, provoking the victim, as with any other scam, into making an impulse purchase.

Another common type of shady site includes online exchanges and trading platforms. These primarily target cryptocurrency, as the lack of legislative regulation for digital currency in certain countries makes them a magnet for fraudsters. These suspicious sites often lure victims with supposedly favorable exchange rates or other enticing gimmicks. If the user attempts to exchange cryptocurrency, their tokens are gone for good. Beyond simple exchanges, rogue sites offer investment services and even display a fake balance growth to appear credible. However, withdrawing funds is impossible; when the victim tries to cash out, they’re prompted to pay some fee or fictional tax.

Subscription traps are also worth noting, offering everything from psychological tests to online video streaming platforms. The hallmark of these sites is that they deliberately withhold critical information, such as recurring charges, or hide the fact it even exists. Typically, the scheme works like this: a user is offered a subscription for a nominal fee, like $1. While that seems attractive, the next charge – perhaps only a week later – might be as much as $50. This information is intentionally obscured, buried in fine print or tucked away in the Terms of Service where it’s harder to find. Legitimate services always clearly disclose subscription terms and provide an easy way to cancel before a trial period ends. Scam services, on the other hand, do everything possible to distract the user from the actual terms of use and subscription.

Shady sites can also masquerade as providers of mediation services, such as legal or real estate assistance. In reality, the service is either never delivered or provided in a stripped-down, incomplete form. For example, a user might be prompted to pay for a service that’s normally provided for free. The danger here lies not only in losing money for non-existent services but also in the significant risk of exposing personal data, such as ID details, taxpayer identification numbers, social security numbers, or driver’s license information. Once in the hands of attackers, this data can become a tool for executing further scams or targeted attacks.

On the whole, suspicious sites are fairly difficult to distinguish from legitimate, trustworthy services. Masquerading as a legitimate business is the primary goal of these sites, and the fraudulent schemes they employ are not always obvious. Nevertheless, there are protective measures as well as certain indicators that can help you suspect a site is unsafe for purchases or financial transactions.

How to identify suspicious or fraudulent websites

Despite the increasingly convincing attempts to create fake shops, the majority of them still lack the quality of real online stores, and there are many signs that may give them away. Some of these signs can be caught by the eye while others require a bit of technical investigation. By combining visual inspection, technical checks, and trusted online tools, you can protect yourself from financial loss or data theft.

Visual and manual clues

You don’t need to be a cybersecurity expert to catch many red flags just by observing the site’s domain, visuals, language and behavior. For instance, scam sites often have strange or randomly generated names, filled with numbers, underscores, hyphens, or meaningless words, like best-shop43.com. In addition, such vague top-level domains as .xyz, .top, or .shop are also frequently used in scams because they’re cheap and easy to register.

Furthermore, most fake stores sites look unprofessional, with poor visuals, pixelated images, mismatched fonts, or copied templates. Many fraudulent websites borrow layouts or logos from other brands or free templates, which makes them appear generic and sketchy.

Another major giveaway lies in the content itself. Be aware of persuasive language, unrealistic promises, or emotional triggers such as No KYC, Risk-free returns, 100% guaranteed income, Up to 300% profit, or Passive income with zero effort. Unrealistic deals are another red flag. If the products are listed at extremely low prices, continuous countdown timers, and “limited time only” messages that are often used to pressure you into making a quick purchase, it’s a clear tell of a fraudulent website.

Legitimate businesses always provide verifiable contact details, such as a physical address, company name, and customer support. On the contrary, scam sites hide this information. You may also notice the non-functioning pages, broken or suspicious links leading to unrelated external sites which indicate poor maintenance or malicious intent.

Another important signal is the website’s social media presence. Legitimate online businesses usually maintain at least one active social media account to promote their products and communicate with customers. In most cases, these businesses have long-established social media accounts with harmonized posting history and engagement from real users, consistency between the brand website and social media profiles (same name, logo, and links). The links to social media profiles from the website are usually direct. In contrast, fraudulent or deceptive websites often lack any meaningful social media presence or display signs of superficial or artificial activity. This may include missing social media accounts altogether, social media icons that lead to non-existent, inactive, or unrelated pages, or recently created profiles with very few posts and minimal user engagement. In some cases, comment sections are disabled or dominated by spam and automated content, suggesting an attempt to avoid public interaction rather than engage with customers.

Lastly, the payment options offered by the site can also tell a lot about its legitimacy. Be extremely cautious if a website only accepts cryptocurrency, wire transfers, or third-party P2P payments. These payment methods are irreversible and are preferred by scammers. Legitimate e-commerce platforms typically offer secure and reversible payment options, such as credit cards or trusted payment gateways that include buyer protection policies.

However, the absence or existence of any of these factors alone does not necessarily indicate malicious intent. It should be evaluated in combination with technical, linguistic, and behavioral indicators, rather than treated as a standalone signal of legitimacy.

Technical indicators to check

Looking into technical signs can reveal whether a website is trustworthy or potentially fraudulent.

One of the first things to check is the domain age. Scam websites are often short-lived, appearing only for a few weeks or months before disappearing once users start reporting them. To check when the domain was created, use a WHOIS lookup. If it’s less than six months old, be cautious — especially for e-commerce or investment sites, where legitimacy and trust take time to build.

Let’s take a look at the registration details for the popular online marketplace Amazon. As we can see from the WHOIS information, it was registered in 1994.

Meanwhile, a reported suspicious online store was created a couple of months ago.

Legitimate websites usually operate on stable hosting platforms and remain on the same IP addresses or networks for long periods. In contrast, fraudulent websites often move between servers (in most cases using a cheap shared hosting service) or reuse infrastructure already associated with abuse. Checking the IP address reputation can reveal if the website or the hosting server has previously been linked to suspicious activities. Even if the website looks legitimate, a poor IP reputation can expose it.

In addition to that, looking at the infrastructure behavior over time can reveal patterns about its legitimacy. Websites associated with fraudulent activity often show short lifespans, sudden spikes in activity, or rapid appearance and disappearance, which indicates a coordinated campaign rather than a legitimate business.

Another important clue is hidden ownership. When the WHOIS details show “Redacted for Privacy” or leaves the organization name blank, it may indicate that the website owner is deliberately hiding their identity.

We should point out that while this can raise suspicion during investigations, hidden WHOIS data is not inherently malicious. Many legitimate businesses use privacy protection services for valid reasons. These may include protection from spam and phishing after public email addresses are taken from WHOIS databases, personal safety for small business owners, and brand protection to prevent competitors or malicious actors from targeting the registrant. This means that some businesses can use services like WHOIS Privacy Protection, Domains By Proxy, or PrivacyGuardian.org to remove the WHOIS data while still operating transparently on their websites through clear contact details, customer support channels, and legal pages (e.g. terms of use).

Therefore, hidden ownership should be treated as a contextual risk indicator, not a standalone proof of fraud. It becomes more suspicious when combined with other signals such as newly registered domains, and lack of legal information.

Next, you can check the security headers of the website. Legitimate websites are usually well maintained and include several key HTTP headers for protection. Some examples include:

  • Content-Security-Policy (CSP) provides strong defense against cross-site scripting (XSS) attacks by defining which scripts are allowed to run on the site and blocking any malicious JavaScript that could steal login data or inject fake forms.
  • HTTP Strict-Transport-Security (HSTS) forces browsers to connect to the site only over HTTPS. It ensures all communication is encrypted and prevents redirecting users to an insecure (HTTP) version of the site.
  • X-Frame-Options prevents clickjacking, which is a type of attack where a legitimate-looking button or link on a malicious page secretly performs another action in the background.
  • X-Content-Type-Options blocks MIME-type attacks by preventing browsers from misinterpreting file types.
  • Referrer-Policy controls how much information about your previous browsing (referrer URLs) is shared with other sites.

These headers form the “digital hygiene” of a website. Their absence doesn’t always mean a site is malicious, but it does suggest a lack of security awareness or professional maintenance — both strong reasons to be cautious.

You should also check the SSL certificate. Scam sites may use self-signed or short-lived SSL certificates. You can inspect this by clicking the padlock icon in your browser’s address bar — if it says “not secure” or the certificate authority seems unfamiliar, that’s a red flag.

You can check the security headers and the SSL certificate by sending an HTTP request programmatically or by using some online service.

Another indicator that provides insight into how well a website is done and managed is DNS configurations. Legitimate businesses typically use reliable DNS providers and maintain consistent DNS records. Missing the name server NS or mail exchange MX records may indicate poor DNS configuration. In addition to NS and MX, reputable sites also configure SPF and DMARC records to protect their brand from email spoofing and phishing. Something scam website developers won’t bother with because they don’t intend to build a long-standing reputation.

You can check the configurations of DNS records either programmatically or by using an online service.

Another recommendation is to pay attention to website behavior. If there are frequent redirects, pop-up ads, or background requests to unknown domains, this may indicate unsafe scripting or tracking.

How to protect yourself

Tools and databases for detecting suspicious websites

We at Kaspersky have built an intelligent system for detecting suspicious web resources and added this new type of protection into many of our products, including Kaspersky Premium, Kaspersky for Android and iOS, and others. Our detection model is based on many factors, including but not limited to the following:

  • domain name and age,
  • IP reputation,
  • stability of the infrastructure used,
  • DNS configurations,
  • HTTP security headers,
  • digital identity and popularity of the web resource.

Kaspersky has been certified as a provider of effective protective technology for fake shop detection.

When a user tries to visit a site flagged as having an undefined trust level, our solutions show a warning to stop the visitor from becoming a victim of personal data leaks, financial losses or a bad purchase:

This component is on by default.

Moreover, there are several online tools and databases that can help assess a website’s legitimacy:

  • ScamAdviser analyzes trust based on WHOIS, server location, and web reputation.
  • APIVoid provides risk scoring using DNS, IP, and domain reputation databases.
  • National government databases often maintain official lists of fraudulent or blacklisted domains.

Preventive measures

To protect yourself from such threats, it might a good idea to take some additional preventive measures. Always double-check the URL and domain name, especially when you are about to click a link or make a payment. Make sure the site uses HTTPS and has a trusted certificate.

You can use standard browser tools to verify site security. For example, in Google Chrome, clicking the site information button (the lock or settings icon in the address bar) displays details about the connection security and the site’s certificate.

In the Security section, you can check whether the site supports HTTPS – it should say “Connection is secure” – and view the site’s digital certificate.

Additionally, keep reliable security software with real-time protection running on your device to stop you from accessing dangerous websites. Do not download any files or enter your personal information on websites that look unprofessional or suspicious. And finally, remember the golden rule: if a deal seems too good to be true, it often is.

If you realize that you’re on a scam website, it’s important to perform certain post-incident actions immediately. First, contact your bank or payment provider as soon as possible to block the transaction or card. Then, change your passwords for the services which might have been compromised, and run a full antivirus scan on your device to detect and remove any potential threats. Lastly, consider reporting the website to the cybercrime agency in your country or to the consumer protection agency. Sharing your experience online by leaving a review or warning will give notice to potential customers alike.

By staying careful and taking quick actions, you can significantly reduce the chances of being a target and help make the internet a safer place for everyone.

An overview of detection statistics for sites with an undefined trust level

To illustrate the types of suspicious sites prevalent in various regions around the world, we analyzed anonymized detection data from Kaspersky solutions for the “websites with an undefined trust level” category in January 2026. For each region, we identified the 10 most frequently encountered sites and calculated the share of each within that list. To maintain privacy, specific domains are not listed directly; instead, they’re described based on their functionality and characteristics.

Most visited suspicious sites

First, let’s examine the sites that appear across multiple regions, indicating a high prevalence.

In 9 out of the 10 regions analyzed, we encountered a suspicious image processing platform (*a*o*.com). This site positions itself as a photo editing tool, but in reality, it serves as an intermediary server for uploading images used in phishing and other campaigns. By interacting with such a site, users risk exposing personal data under the guise of uploading images or falling victim to a phishing attack.

Percentage of the *a*o*.com domain detections by region, January 2026 (download)

This site has the largest share of detections in the Russian Federation, where it ranks first in the TOP 10 with a 40.80% share. It is also prevalent in Latin American countries (21.70%) and the CIS (14.64%), while it’s least common in Canada at 0.24%.

The next site appeared in 7 regions. It consists of a landing page for a fake antivirus solution presented as a browser extension (*n*s*.com). This extension redirects the user to a fake search engine page allowing it to collect data and track user activity, specifically search queries.

Percentage of the *n*s*.com domain detections by region, January 2026 (download)

This site is most frequently detected in South Asia, with a share of 33.31%. Its presence in Canada and Oceania is roughly equal (15.47% and 15.09%, respectively). We recorded the lowest number of detections in Africa, at 2.99%.

Another suspicious browser extension appeared in the TOP 10 in 6 out of the 10 regions. It’s a fake privacy-enhancing tool hosted at *w*a*.com. Instead of providing the advertised privacy features, this extension carries a high risk of intercepting browser data. It can modify browser settings, harvest user data, and swap the default search engine for a fake one. Furthermore, it maintains full control over all browser traffic.

Percentage of the *w*a*.com domain detections by region, January 2026 (download)

This “service” has its largest share, 22.25%, in the Middle East and North Africa, and is also quite common in Canada (16.26%). It’s least frequently encountered in Latin America (5.38%) and East Asia (4.02%).

The site *o*r*.com appeared in five regional rankings. It’s a fake security service promising to provide online safety by warning users about malicious sites and dangerous search queries. This extension has the potential to steal cookies (including session cookies), inject advertisements, spoof login forms, and harvest browser history and search queries. We noted that this site made the TOP 10 in Africa (0.59%), the MENA (Middle East and North Africa) region (4.57%), Europe (5.61%), Canada (7.21%), and Oceania (1.93%).

In 4 out of the 10 regions, we identified several other recurring sites. One of them (*n*p*.xyz) mimics a repository for creative AI image generation prompts while capturing browser data. The domain hosting this site exhibits several red flags: it was recently registered, and the owner’s information is hidden. This site reached the TOP 10 in Africa (0.51%), the MENA region (7.04%), Latin America (22.54%, ranking first in that region), and South Asia (5.91%).

The second service (*i*s*.com) positions itself as a tool for safe searching, protecting the browser from threats, and verifying extensions. However, this is a typical browser hijacker, much like the others mentioned above. It made the TOP 10 in South Asia (8.03%), Oceania (17.97%), Europe (3.90%), and Canada (14.35%).

The third site (*h*t*.com) poses as a private browsing extension. In reality, it’s another potentially unwanted application designed for browser hijacking: it modifies settings, steals sensitive data (cookies, browser history, and queries), and can redirect the user to phishing pages. Users have specifically noted the difficulty involved in removing the extension. This site appears in the TOP 10 for the MENA region (10.17%), Canada (7.06%), Europe (3.81%), and Oceania (2.81%).

Another domain (*o*t*.com) that reached the TOP 10 in four regions is a service mimicking a browser extension for safe searching and web browsing. It’s dangerous because it injects ads and steals user data. It’s important to note that such extensions can be installed without explicit user consent – for example, via links embedded in other software. This service holds the number one spot in two regions: Canada (25.72%) and Oceania (30.92%), while also appearing in the TOP 10 for East Asia (8.01%) and Africa (0.88%).

Consequently, we can see that the majority of suspicious sites detected by our solutions worldwide are browser hijackers masquerading as security products. Nevertheless, other categories of sites also appear in the TOP 10.

Next, we’ll examine each region individually, focusing on descriptions of domains not previously covered. For clarity, the sites mentioned above will be marked as [MULTI-REGION], while those appearing in only two or three regions will include the names of those specific areas. We’ll observe several regional overlaps and similarities, allowing us to determine which types of suspicious sites are popular both within specific regions and globally.

Africa

Distribution of the TOP 10 suspicious websites in Africa, January 2026 (download)

The three most prevalent domains in African countries are found exclusively in this region. All of them – *i*r*.world (60.27%), *m*a*.com (22.84%), and *e*p*.com (9.36%) – are potentially fraudulent online trading platforms suspected of using forged licenses. These sites employ classic scam schemes where it’s impossible to withdraw any alleged earnings. In fifth place is a domain we’ll also see in the European TOP 10, *r*e*.com (1.46%): a platform marketed as a tool for retail and semi-professional traders. It charges for services available elsewhere for free. Eighth place is held by a site that also appears in the Russian TOP 10: *a*c*.com (0.56%). This is a dubious AI tool that claims to offer free subscriptions to a premium graphics editor. In ninth place is a domain that also surfaces in the Canadian TOP 10: *u*e*.com (0.53%), a browser extension of the “web protection” variety that we’ve encountered previously.

In summary, the African region is dominated by financial scams within the online trading and brokerage sectors. These include fake platforms that make it impossible to withdraw funds and use fake licenses and classic schemes to steal users’ money. Additionally, Africa sees paid tools that duplicate free services and questionable AI-based subscriptions. The primary threat in this region is financial loss through fraudulent investment-themed sites.

MENA

Distribution of the TOP 10 suspicious websites in the Middle East and North Africa, January 2026 (download)

In the MENA region, the site *a*v*.su holds the top spot with a 28.64% share; notably, this site also appears in the TOP 10 for Russia. It markets itself as a tool for building custom VoIP-PBX systems. However, it has an extremely low trust rating and is frequently associated with phishing, and hidden redirects. Using this service carries significant risks, including data leaks, and financial loss.

Ranked seventh is *a*r*.foundation (6.32%), an AI bot allegedly designed for trading, which we also identified in the TOP 10 for Oceania. This service has been flagged as an investment scam operating as a pyramid scheme with the hallmarks of a Ponzi scheme.

The ranking is rounded out by two domains not found in any other region. The first one, *l*e*.pro (4.42%), is a spoof of a popular betting service. The second, *p*r*.group (2.21%), is a clone of a well-known broker. Both sites are scams.

In the MENA region, the landscape is dominated by fake VoIP services as well as counterfeits of financial and betting platforms, which attackers use to conduct phishing attacks, and perform hidden redirects. A significant portion of suspicious sites consists of fake online privacy tools and browser hijackers masquerading as security extensions. Ponzi schemes and cryptocurrency scams are also prominent. The primary risks for the region are data theft, and financial loss.

Latin America

Distribution of the TOP 10 suspicious websites in Latin America, January 2026 (download)

In Latin America, we identified five popular suspicious sites specific to this region, which is unusual compared to other areas where more overlaps are typically observed. Ranking third with a share of 10.81% is the fake betting platform *b*e*.net. In fifth place is *r*e*.club, an illegitimate clone of a well-known bookmaker, with a share of 7.82%.

Further down the list of local threats are *a*a*.com.br (7.02%), a Brazilian Ponzi scam; *s*a*.com (5.07%), which offers dubious investment programs; and *t*r*.com (4.53%), a potentially dangerous trading platform.

In Latin America, the most-visited suspicious sites are betting-themed scams, including both clones of legitimate sites and those built from scratch. Also prevalent are Ponzi schemes, fake investment programs, and dubious online brokers. A significant portion of these sites consists of browser hijackers posing as crypto platforms and AI bots. The primary threats in Latin American countries include financial loss through gambling and Ponzi schemes, as well as the theft of NFTs and other tokens.

East Asia

Distribution of the TOP 10 suspicious websites in East Asia, January 2026 (download)

In the East Asian TOP 10, we see the highest concentration of domains that are absent from other regional rankings.

In first place, with an 18.77% share, is the fake broker *r*x*.com, which can be used to steal personal data or funds. Second place is held by a crypto-gaming site (16.44%) that we previously encountered in the Latin American TOP 10. Visitors to this site risk losing NFTs and other tokens. In third place is the domain *u*h*.net (11.61%), used for redirects, which can hijack sessions. Following this is *s*m*.com (9.98%), a domain typically used as a browser-hijacking server and for phishing attacks, serving as a link in an infection chain.

Rounding out the local threats in East Asia are the following domains: *e*v*.com (9.37%), utilized in drive-by attacks; *a*k*.com (9.16%), an API-like domain associated with suspicious scripts and extensions; and *b*l*.com (4.38%), a domain potentially used for redirects.

East Asia has a high concentration of region-specific fake brokers, crypto gaming platforms, and NFT marketplaces. The primary threats for this region include the loss of financial data, NFTs, and other tokens, as well as session hijacking.

South Asia

Distribution of the TOP 10 suspicious websites in South Asia, January 2026 (download)

In South Asian countries, we also observe a concentration of local suspicious sites specific to the region.

The second most popular site in the region is *a*s*.com (12.01%), a poor-reputation, high-risk microloan service typical of South Asia. By interacting with these sites, users risk not only losing significant funds but also compromising their overall security. Following this are *v*n*.com with a 9.47% share and *l*f*.com with 8.65%. These domains are employed in various fraudulent schemes, ranging from phishing to spam.

The TOP 10 also includes *s*o*.com (4.80%), a free video downloading service associated with a high risk of infection. The final site we analyzed in the South Asia region is *c*o*.site (1.89%), a pseudo-tool for local SEO optimization that carries the danger of data loss and a high risk of financial fraud through subscription sign-ups.

In summary, the region is dominated by fake antivirus extensions, microloan services, dubious video downloaders, and counterfeit SEO tools. The primary risks for South Asia include financial fraud, phishing and spam distribution, and data theft.

CIS

When analyzing statistics for suspicious sites in CIS countries, we treat Russia as a separate region due to the unique characteristics of its online space which are not found in any other CIS member states. However, we’ve placed these two regions in the same section, as we’ve observed overlaps between them that are not seen in other parts of the world.

Distribution of the TOP 10 suspicious websites in the CIS, January 2026 (download)

The top two sites in the CIS TOP 10 also appear in the Russian TOP 10. The domain *r*a*.bar, which ranks first in the CIS (39.50%), holds the second spot in Russia (15.93%) and is a fake trading site. It’s worth noting that sites in the .bar domain zone are frequently used for scams. In second place in the CIS (15.29%) and sixth in Russia (3.75%) is the domain *p*o*.ru, which is often associated with bots for inflating follower counts and automating community management.

Domains from fourth to eighth place are specific only to the CIS region and don’t appear in the Russian TOP 10. These sites include:

  • *a*e*.online (8.42%): an online image editor that carries risks of data harvesting
  • *n*a*.io (6.51%): a high-risk cryptocurrency trading platform
  • *e*r*.com (3.72%): a site promising free cryptocurrency and posing the risk of compromising visitors’ private keys and digital wallets
  • *s*o*.ltd (3.70%): a domain with an extremely low trust rating
  • *s*.gg (3.49%): a scam site masquerading as a play-to-earn blockchain game

The ranking concludes with sites that overlap with the Russian region. *a*.consulting (2.42%) is a fake clone of a binary options site, and *a*.lol (2.32%) is a domain suspected of dubious activity.

The CIS landscape is dominated by fake trading platforms (particularly crypto exchanges), promises of easy profits, play-to-earn scams, and dubious investment projects. We also observe many bots for inflating social metrics and automation. The primary threat in the CIS is the theft of private keys, digital wallets, and funds through investment schemes and lures involving online promotion.

Distribution of the TOP 10 suspicious websites in Russia, January 2026 (download)

The Russian TOP 10 includes three unique domains not found in the rankings of other regions. The first, *n*m*.top (7.84%), is an imitator of a well-known binary options broker. This suspicious site was recently registered and has a tellingly low rating on domain verification services. The second, *t*e*.ru (3.25%), claims to be an educational platform and has a dubious subscription system with a high probability of fraud involving difficulties in canceling subscriptions. The third site, *e*e*.org (3.14%), positions itself as a tool for a popular media platform, but it’s actually a scam that fails to provide its stated services.

Overall, the Russian landscape is characterized by fake binary options brokers and sketchy sites with fraudulent subscriptions posing as e-learning platforms. There are also frequent instances of sites spoofing well-known legitimate services. The primary risks in Russia are scams related to the knowledge business sector, as well as the theft of money and personal data.

Europe

Distribution of the TOP 10 suspicious websites in Europe, January 2026 (download)

In the European region, we’ve found two unique domains. The first of these, *c*r*.org, has been identified as part of a chain for massive phishing and spam attacks. It accounts for a 16.08% share of the TOP 10. The second site, *o*n*.de, is an unofficial reseller with a poor reputation and a high likelihood of fraud. This domain ranks second to last in our statistics with a 5.95% share.

Among the sites not previously covered, the European TOP 10 includes one site that also appears in the Oceania TOP 10: *o*i*.com (6.61%). This is a classic cryptocurrency scam promising passive income.

A significant portion of suspicious sites in Europe consists of intermediary sites for phishing and spam, fake security extensions, and crypto scams. Unofficial sales services and paid trading tools are also on the list. The primary threats in the European region include session hijacking, data theft, spam, and investment fraud.

Canada

Distribution of the TOP 10 suspicious websites in Canada, January 2026 (download)

Canada has been designated as a separate region to illustrate prevailing trends within North America. The first four positions in the Canadian TOP 10 are held by multiregional domains discussed previously. In fifth place is *t*c*.com (10.88%), which also appears in the TOP 10 rankings for Oceania and South Asia. This is yet another browser extension masquerading as a security solution. Occupying the final spot is the domain *e*w*.com (0.17%), which is unique to the Canadian market. This site operates a dropshipping scam, offering products at prices significantly below market value. Customers typically either never receive their orders or get low-quality counterfeits.

The landscape of dubious websites in Canada is largely defined by fraudulent extensions capable of hijacking browser data, tracking user activity, spoofing search queries, harvesting cookies, and injecting ads. This is further compounded by dropshipping schemes involving counterfeit goods. The primary risks for users in Canada include data theft and financial loss from purchasing substandard products.

Oceania

Distribution of the TOP 10 suspicious websites in Oceania, January 2026 (download)

The final region under consideration is Oceania. Notably, we didn’t identify a single domain unique to this region. Every site appearing in the TOP 10 represents a global threat that’s already been detailed in previous sections. To summarize the findings for this region: the primary threats consist of fake security extensions and privacy products designed for browser hijacking, tracking user activity, displaying advertisements, and stealing data. There’s a minimal presence of crypto Ponzi schemes in this area. The main risk for users in Oceania is the loss of privacy and confidentiality through unwanted apps.

Conclusion

Suspicious websites are particularly dangerous because they often masquerade as legitimate sites with high levels of persuasiveness. They mimic online stores, subscription-based streaming platforms, repair firms, and various other services. Unlike standard phishing sites, they employ more sophisticated manipulations to deceive users, tricking them into voluntarily handing over their personal data and transferring funds.

By examining the TOP 10 suspicious sites across the world’s major regions, we can draw several conclusions. On average, the most prevalent threats globally are fraudulent extensions masquerading as security solutions and privacy services. Their true purpose is to hijack browser data, track user activity, and display ads. We also frequently encounter phishing platforms for image processing and financial scams involving trading, cryptocurrency, betting, and microloans. Our statistics demonstrate that these sites not only employ classic fraudulent schemes centered on easy money but also adapt to contemporary trends targeting younger audiences and specific regional characteristics. The primary risks for users interacting with these sites are a combination of privacy threats and financial loss.

To help protect users from these shady sites, we’ve introduced the category of “websites with an undefined trust level” as part of the web filtering features in our solutions. However, it’s important to note that user awareness and individual responsibility play a significant role in ensuring safe web browsing. It’s essential for users to be able to recognize suspicious sites and remain vigilant toward any that appear untrustworthy.

  • ✇Securelist
  • “Legitimate” phishing: how attackers weaponize Amazon SES to bypass email security Roman Dedenok
    Introduction The primary goal for attackers in a phishing campaign is to bypass email security and trick the potential victim into revealing their data. To achieve this, scammers employ a wide range of tactics, from redirect links to QR codes. Additionally, they heavily rely on legitimate sources for malicious email campaigns. Specifically, we’ve recently observed an uptick in phishing attacks leveraging Amazon SES. The dangers of Amazon SES abuse Amazon Simple Email Service (Amazon SES) is a cl
     

“Legitimate” phishing: how attackers weaponize Amazon SES to bypass email security

4 de Maio de 2026, 07:00

Introduction

The primary goal for attackers in a phishing campaign is to bypass email security and trick the potential victim into revealing their data. To achieve this, scammers employ a wide range of tactics, from redirect links to QR codes. Additionally, they heavily rely on legitimate sources for malicious email campaigns. Specifically, we’ve recently observed an uptick in phishing attacks leveraging Amazon SES.

The dangers of Amazon SES abuse

Amazon Simple Email Service (Amazon SES) is a cloud-based email platform designed for highly reliable transactional and marketing message delivery. It integrates seamlessly with other products in Amazon’s cloud ecosystem, AWS.

At first glance, it might seem like just another delivery channel for email phishing, but that isn’t the case. The insidious nature of Amazon SES attacks lies in the fact that attackers aren’t using suspicious or dangerous domains; instead, they are leveraging infrastructure that both users and security systems have grown to trust. These emails utilize SPF, DKIM, and DMARC authentication protocols, passing all standard provider checks, and almost always contain .amazonses.com in the Message-ID headers. Consequently, from a technical standpoint, every email sent via Amazon SES – even a phishing one – looks completely legitimate.

Phishing URLs can be masked with redirects: a user sees a link like amazonaws.com in the email and clicks it with confidence, only to be sent to a phishing site rather than a legitimate one. Amazon SES also allows for custom HTML templates, which attackers use to craft more convincing emails. Because this is legitimate infrastructure, the sender’s IP address won’t end up on reputation-based blocklists. Blocking it would restrict all incoming mail sent through Amazon SES. For major services, that kind of measure is ineffective, as it would significantly disrupt user workflows due to a massive number of false positives.

How compromise happens

In most cases, attackers gain access to Amazon SES through leaked IAM (AWS Identity and Access Management) access keys. Developers frequently leave these keys exposed in public GitHub repositories, ENV files, Docker images, configuration backups, or even in publicly accessible S3 buckets. To hunt for these IAM keys, phishers use various tools, such as automated bots based on the open-source utility TruffleHog, which is designed for detecting leaked secrets. After verifying the key’s permissions and email sending limits, attackers are equipped to spread a massive volume of phishing messages.

Examples of phishing with Amazon SES

In early 2026, one of the most common themes in phishing emails sent with Amazon SES was fake notifications from electronic signature services.

Phishing email imitating a Docusign notification

Phishing email imitating a Docusign notification

The email’s technical headers confirm that it was sent with Amazon SES. At first glance, it all looks legitimate enough.

Phishing email headers

Phishing email headers

In these emails, the victim is typically asked to click a link to review and sign a specific document.

Phishing email with a "document"

Phishing email with a “document”

Upon clicking the link, the user is directed to a sign-in form hosted on amazonaws.com. This can easily mislead the victim, convincing them that what they’re doing is safe.

Phishing sign-in form

Phishing sign-in form

The resulting form is, of course, a phishing page, and any data entered into it goes directly to the attackers.

Amazon SES and BEC

However, Amazon SES is used for more than just standard phishing; it’s also a vehicle for a very sophisticated type of BEC campaigns. In one case we investigated, a fraudulent email appeared to contain a series of messages exchanged between an employee of the target organization and a service provider about an outstanding invoice. The email was sent as if from that employee to the company’s finance department, requesting urgent payment.

BEC email featuring a fake conversation between an employee and a vendor

BEC email featuring a fake conversation between an employee and a vendor

The PDF attachments didn’t contain any malicious phishing URLs or QR codes, only payment details and supporting documentation.

Forged financial documents

Forged financial documents

Naturally, the email didn’t originate with the employee, but with an attacker impersonating them. The entire thread quoted within the email was actually fabricated, with the messages formatted to appear as a legitimate forwarded thread to a cursory glance. This type of attack aims to lower the user’s guard and trick them into transferring funds to the scammers’ account.

Takeaways

Phishing via Amazon SES experienced an uptick in January 2026 and has remained relatively steady through Q1. By weaponizing this service, attackers avoid the effort of building dubious domains and mail infrastructure from scratch. Instead, they hijack existing access keys to gain the ability to blast out thousands of phishing emails. These messages pass email authentication, originate from IP addresses that are unlikely to be blocklisted, and contain links to phishing forms that look entirely legitimate.

Since these Amazon SES phishing attacks stem from compromised or leaked AWS credentials, prioritizing the security of these accounts is critical. To mitigate these risks, we recommend following these guidelines:

  • Implement the principle of least privilege when configuring IAM access keys, granting elevated permissions only to users who require them for specific tasks.
  • Transition from IAM access keys to roles when configuring AWS; these are profiles with specific permissions that can be assigned to one or several users.
  • Enable multi-factor authentication, an ever-relevant step.
  • Configure IP-based access restrictions.
  • Set up automated key rotation and run regular security audits.
  • Use the AWS Key Management Service to encrypt data with unique cryptographic keys and manage them from a centralized location.

We recommend that users remain vigilant when handling email. Do not determine whether an email is safe based solely on the From field. If you receive unexpected documents via email, a prudent precaution is to verify the request with the sender through a different communication channel. Always carefully inspect where links in the body of an email actually lead. Additionally, robust email security solutions can provide an essential layer of protection for both corporate and personal correspondence.

  • ✇Securelist
  • Financial cyberthreats in 2025 and the outlook for 2026 Olga Altukhova · Oleg Kupreev · Polina Tretyak
    In 2025, the financial cyberthreat landscape continued to evolve. While traditional PC banking malware declined in relative prevalence, this shift was offset by the rapid growth of credential theft by infostealers. Attackers increasingly relied on aggregation and reuse of stolen data, rather than developing entirely new malware capabilities. To describe the financial threat landscape in 2025, we analyzed anonymized data on malicious activities detected on the devices of Kaspersky security produc
     

Financial cyberthreats in 2025 and the outlook for 2026

8 de Abril de 2026, 06:00

In 2025, the financial cyberthreat landscape continued to evolve. While traditional PC banking malware declined in relative prevalence, this shift was offset by the rapid growth of credential theft by infostealers. Attackers increasingly relied on aggregation and reuse of stolen data, rather than developing entirely new malware capabilities.

To describe the financial threat landscape in 2025, we analyzed anonymized data on malicious activities detected on the devices of Kaspersky security product users and consensually provided to us through the Kaspersky Security Network (KSN), along with publicly available data and data on the dark web.

We analyzed the data for

  • financial phishing,
  • banking malware,
  • infostealers and the dark web.

Key findings

Phishing

Phishing activity in 2025 shifted toward e-commerce (14.17%) and digital services (16.15%), with attackers increasingly tailoring campaigns to regional trends and user behavior, making social engineering more targeted despite reduced focus on traditional banking lures.

Banking malware

Financial PC malware declined in prevalence but remained a persistent threat, with established families continuing to operate, while attackers increasingly prioritize credential access and indirect fraud over deploying complex banking Trojans. To the contrary, mobile banking malware continues growing, as we wrote in detail in our mobile malware report.

Infostealers and the dark web

Infostealers became a central driver of financial cybercrime, fueling a growing dark web economy where stolen credentials, payment data, and full identity profiles are traded at scale, enabling widespread and destructive fraud operations.

Financial phishing

In 2025, online fraudsters continued to lure users to phishing and scam pages that mimicked the websites of popular brands and financial organizations. Attackers leveraged increasingly convincing social engineering techniques and brand impersonation to exploit user trust. Rather than relying solely on volume, campaigns showed greater targeting and contextual adaptation, reflecting a maturation of phishing operations.

The distribution of top phishing categories in 2025 shows a clear shift toward digital platforms that aggregate multiple user activities, with web services (16.15%), online games (14.58%), and online stores (14.17%) leading globally. Compared to 2024, the rise of online games and the decline of social networks and banks indicate that attackers are increasingly targeting environments where users are more likely to take a risk or engage impulsively. Categories such as instant messaging apps and global internet portals remain significant phishing targets, reflecting their role as communication and access hubs that can be exploited for credential harvesting.

TOP 10 categories of organizations mimicked by phishing and scam pages that were blocked on home users’ devices, 2025 (download)

Regional patterns further reinforce the adaptive nature of phishing campaigns, showing that attackers closely align category targeting with local digital habits. For example, online stores dominate heavily in the Middle East.

TOP 10 categories of organizations mimicked by phishing and scam pages that were blocked on home users’ devices in the Middle East, 2025 (download)

Online games and instant messaging platforms feature more prominently in the CIS, suggesting a focus on younger or highly connected user bases.

TOP 10 categories of organizations mimicked by phishing and scam pages that were blocked on home users’ devices in the CIS, 2025 (download)

APAC demonstrates almost equal shares of online games and banks which signifies a combined approach targeting different users.

TOP 10 categories of organizations mimicked by phishing and scam pages that were blocked on home users’ devices in APAC, 2025 (download)

In Africa, a stronger emphasis on banks reflects the continued importance of traditional financial services. Most likely, this is due to the lower security level of the financial institutions in the region.

TOP 10 categories of organizations mimicked by phishing and scam pages that were blocked on home users’ devices in Africa, 2025 (download)

Whereas in LATAM, delivery companies appearing in the top categories indicate attackers exploiting the growth of e-commerce logistics.

TOP 10 categories of organizations mimicked by phishing and scam pages that were blocked on home users’ devices in Latin America, 2025 (download)

Europe presents a more balanced distribution across categories, pointing to diversified attack strategies.

TOP 10 categories of organizations mimicked by phishing and scam pages that were blocked on home users’ devices in Europe, 2025 (download)

Attackers actively localize their tactics to maximize relevance and effectiveness.

The distribution of financial phishing pages by category in 2025 reveals strong regional asymmetries that reflect both user behavior and attacker prioritization.

Globally, online stores dominated (48.45%), followed by banks (26.05%) and payment systems (25.50%). The decline in bank phishing may suggest that these services are becoming increasingly difficult to successfully impersonate, so fraudsters are turning to easier ways to access users’ finances.

However, this balance shifts significantly at the regional level.

In the Middle East, phishing is overwhelmingly concentrated on e-commerce (85.8%), indicating a heavy reliance on online retail lures, whereas in Africa, bank-related phishing leads (53.75%), which may indicate that user account security there is still insufficient. LATAM shows a more balanced distribution but with a higher share of online store targeting (46.30%), while APAC and Europe display a more even spread across all three categories, pointing to diversified attack strategies. These variations suggest that attackers are not operating uniformly but are instead adapting campaigns to regional digital habits, payment ecosystems, and trust patterns – maximizing effectiveness by aligning phishing content with the most commonly used financial services in each market.

Distribution of financial phishing pages by category and region, 2025 (download)

Online shopping scams

The distribution of organizations mimicked by phishing and scam pages in 2025 highlights a clear shift toward globally recognized digital service and e-commerce brands, with attackers prioritizing platforms that have large, active user bases and frequent payment interactions.

Netflix (28.42%) solidified its ranking as the most impersonated brand, followed by Apple (20.55%), Spotify (18.09%), and Amazon (17.85%). This reflects a move away from traditional retail-only targets toward subscription-based and ecosystem-driven services.

TOP 10 online shopping brands mimicked by phishing and scam pages, 2025 (download)

Regionally, this trend varies: Netflix dominates heavily in the Middle East, Apple leads in APAC, while Spotify ranks first across Europe, LATAM, and Africa. Although most of the top platforms are highly popular across different regions, we may suggest that the attackers tailor brand impersonation to regional popularity and user engagement.

Payment system phishing

Phishing campaigns are impersonating multiple payment ecosystems to maximize coverage. While PayPal was the most mimicked in 2024 with 37.53%, its share dropped to 14.10% in 2025. Mastercard, on the contrary, attracted cybercriminals’ attention, its share increasing from 30.54% to 33.45%, while Visa accounted for a significant 20.06% (last year, it wasn’t in the TOP 5), reinforcing the growing focus on widely used banking card networks. The continued presence of American Express (3.87%) and the increasing number of pages mimicking PayPay (11.72%) further highlight attacker experimentation and regional adaptation.

TOP 5 payment systems mimicked by phishing and scam pages, 2025 (download)

Financial malware

In 2025, the decline in users affected by financial PC malware continued. On the one hand, people continue to rely on mobile devices to manage their finances. On the other hand, some of the most prominent malware families that were initially designed as bankers had not used this functionality for years, so we excluded them from these statistics.

Changes in the number of unique users attacked by banking malware, by month, 2023–2025 (download)

Windows systems remained the primary platform targeted by attackers with financial malware. According to Kaspersky Security Bulletin, overall detections included 1,338,357 banking Trojan attacks globally from November 2024 to October 2025, though this number is also declining due to increasing focus on mobile vectors. Desktop threats continued to be distributed via traditional delivery methods like malicious emails, compromised websites, and droppers.

In 2025, Brazilian-origin families such as Grandoreiro (part of the Tetrade group) stood out for their constant activity and global reach. Despite a major law enforcement disruption in early 2024, Grandoreiro remained active in 2025, re-emerging with updated variants and continuing to operate. Other notable actors included Coyote and emerging families like Maverick, which abused WhatsApp for distribution while maintaining fileless techniques and overlaps with established Brazilian banking malware to steal credentials and enable fraudulent transactions on desktop banking platforms. Besides traditional bankers, other Brazilian malware families are worth mentioning, which specifically target relatively new and highly popular regional payment systems. One of the most prominent threats among these is GoPix Trojan focusing on the users of Brazilian Pix payment system. It is also capable of targeting local Boleto payment method, as well as stealing cryptocurrency.

There was also a surge in incidents in 2025 in which fraudsters targeted organizations through electronic document management (EDM) systems, for example, by substituting invoice details to trick victims into transferring funds. The Pure Trojan was most frequently encountered in such attacks. Attackers typically distribute it through targeted emails, using abbreviations of document names, software titles, or other accounting-related keywords in the headers of attached files. Globally in the corporate segment, Pure was detected 896 633 times over 2025, with over 64 thousand users attacked.

Contrary to PC banking malware, mobile banker attacks grew by 1.5 times in 2025 compared to the previous reporting period, which is consistent with their growth in 2024. They also saw a sharp surge in the number of unique installation packages. More statistics and trends on mobile banking malware can be found in our yearly mobile threat report.

Complementing traditional financial malware, infostealers played a significant role in enabling financial crime both on PCs and mobile devices by harvesting credentials, cookies, and autofill data from browsers and applications, which attackers then used for account takeovers or direct banking fraud. Kaspersky analyses pointed to a surge in infostealer detections (up by 59% globally on PCs), fueling credential-based attacks.

Financial cyberthreats on the dark web

The Kaspersky Digital Footprint Intelligence (DFI) team closely monitors infostealer activity on both PC and mobile devices to analyze emerging trends and assess the evolving tactics of cybercriminals.

Fraudsters especially target financial data such as payment cards, cryptocurrency wallets, login credentials and cookies for banking services, as well as documents stored on the victim’s device. The stolen data is collected in log files and shared on dark web resources, where they are bought, sold, or distributed freely and then used for financial fraud.

With access to financial data, fraudsters can gain control of users’ bank accounts and payment cards, and withdraw funds. Compromised accounts and cards are also frequently used in subsequent activities, turning the victims into intermediaries in a fraud scheme.

Compromised accounts

Kaspersky DFI found that in 2025, over one million online banking accounts (these are not Kaspersky product users) served by the world’s 100 largest banks fell victim to infostealers: their credentials were being freely shared on the dark web.

The countries with the highest median number of compromised accounts per bank were India, Spain, and Brazil.

The chart below shows the median number of compromised accounts per bank for the TOP 10 countries.

TOP 10 countries with the highest compromised account median (download)

Compromised payment cards

Seventy-four percent of payment cards that were compromised by infostealer malware, published on dark web resources and identified by the Digital Footprint Intelligence team in 2025, remained valid as of March 2026. This means that attackers could still use the cards that had been stolen months or even years prior.

It should be noted that the number of bank accounts and payment cards known to have been compromised by infostealers in 2025 will continue to rise, because fraudsters do not publish the log files immediately after the compromise but only after a delay of months or even years.

Data breaches

Regardless of the industry in which the target company operates, data breaches often expose users’ financial data, including payment card information, bank account details, transaction histories and other financial information. As a consequence, the compromised databases are sold and distributed on underground resources.

It should be noted that the threat is not limited to the exposure of financial information alone. Various identity documents and even seemingly public data, such as names, phone numbers and email addresses, can become a risk when they are published on the dark web. Such data attracts fraudsters’ attention and can be used in social engineering attacks to gain access to the user’s financial assets.

An example of a post offering a database

An example of a post offering a database

Sale of bank accounts and payment cards

The dark web often features services provided by stores that specialize in selling bank accounts and payment cards. Fraudsters typically obtain data for sale from a variety of sources, including infostealer logs and leaked databases, which are first repackaged and then combined.

Examples of a post (top) and a site (bottom) offering payment cards

Examples of a post (top) and a site (bottom) offering payment cards

Often, sellers offer complete victim profiles, referred to by fraudsters as “fullz”. These include not only bank accounts or payment cards but also identification documents, dates of birth, residential addresses, and other personal details. A full‑information package is usually more expensive than a payment card or a bank account alone.

Examples of a post (top) and a site (bottom) offering bank accounts

Examples of a post (top) and a site (bottom) offering bank accounts

Compiled databases

Fraudsters exploit various sources, including previously leaked databases, to compile new, thematic ones. Finance- and, in particular, cryptocurrency-related databases, are among the most popular. Compilations aimed at specific user groups, such as the elderly or wealthy people, are also of interest to cybercriminals.

Usually, thematic databases contain personal information about users, such as names, phone numbers, and email addresses. Fraudsters can use this data to launch social engineering attacks.

An example of a message offering compiled databases

An example of a message offering compiled databases

Creation of phishing websites

Phishing websites have become a powerful tool for the financial enrichment of fraudsters. Cybercriminals create fraudulent sites that masquerade as legitimate resources of companies operating in various industries. Gambling and retail sites remain among the most popular targets.

In order to obtain personal and financial information from unsuspecting users, adversaries seek out ways to create such phishing websites. Ready-made layouts and website copies are sold on the dark web and advertised as profitable tools. Moreover, fraudsters offer phishing website creation services.

Examples of posts offering creation of phishing websites

Examples of posts offering creation of phishing websites

Conclusion

The decline of traditional PC banking malware is not an indicator of reduced risk; rather, it highlights a redistribution of attacker effort toward more efficient methods targeting mobile devices, credential theft, and social engineering. Infostealers, in particular, are a force multiplier, enabling widespread compromise at scale.

Looking ahead to 2026, the financial threat landscape is expected to become even more data-driven and automated. Organizations must adapt by focusing on identity protection, real-time monitoring, and cross-channel threat intelligence, while users must remain vigilant against increasingly sophisticated and personalized attack techniques.

❌
❌