Key takeaway. since the emergence of WormGPT in June 2023, AI-based hacking tools have spread to the dark web, Telegram, GitHub, and Hugging Face. the market has evolved into a mix of paid subscription SaaS and free open-source distributions. key capabilities have been segmented into phishing automation, malware development, reconnaissance, brute force, vulnerability exploitation, and […]
AI adoption is moving fast, shifting from pilot projects to the infrastructure-level, day-to-day practice. The budget curve reflects that shift. Gartner expects worldwide AI spending to reach $2.52T in 2026, a 44% year-over-year increase. At the same time, AI cybersecurity spending is expected to grow by more than 90% in 2026, a clear signal that the deeper AI is embedded into business operations, the larger the attack surface becomes.
As organizations operationalize LLMs, the real challenge shifts from response quality to safe execution. It is no longer enough for a model to explain what to do. In many environments, value comes from taking action, pulling the right context, and interacting with the systems where work happens. That includes code repositories, ticketing platforms, SaaS tools, databases, and internal services.
Before Model Context Protocol, every tool integration was like building a different custom cable for every device, and then discovering that each LLM vendor used a slightly different plug. MCP standardizes the connector and the message format; therefore, tools can expose capabilities once, and multiple models can use them consistently. The result is faster development, fewer bespoke integrations, and lower long-term maintenance as adoption spreads across the ecosystem.
This shift is already visible in cybersecurity-focused AI assistants. For example, SOC Prime’s Uncoder AI is powered by MCP tools that turn an LLM into a contextually aware cybersecurity co-pilot, supporting easier integration, vendor flexibility, pre-built connections, and more controlled data handling. For instance, MCP allows semantic searches across the Threat Detection Marketplace, quickly finding rules for specific log sources or threat types, and cutting down on manual search time. All this is backed by privacy and security at its core.
Yet, in general, when MCP becomes a common pathway between agents and critical systems, every server, connector, and permission scope becomes security relevant. Overbroad tokens, weak isolation, and incomplete audit trails can turn convenience into data exposure, unintended actions, or lateral movement.
This guide explains how MCP works, then focuses on practical security risks and mitigations.
What Is MCP?
Since it was released and open-sourced by Anthropic in November 2024, Model Context Protocol has rapidly gained traction as the connective layer between AI agents and the tools, APIs, and data they rely on.
At its core, MCP is a standardized way for LLM-powered applications to communicate with external systems in a consistent and controlled manner. It moves AI assistants beyond static, training-time knowledge by enabling them to retrieve fresh context and perform actions through approved interfaces. The practical outcome is an AI agent that can be more accurate and useful, because it can work with real operational data.
Key Components
Model Context Protocol architecture is built around a simple set of blocks that coordinate how an LLM discovers external capabilities, pulls the right context, and exchanges structured requests and responses with connected systems.
MCP Host. The environment where the LLM runs. Examples include an AI-powered IDE or a conversational interface embedded into a product. The host manages the user session and decides when external context or actions are needed.
MCP Client. A component inside the host that handles protocol communication. It discovers MCP servers, requests metadata about available capabilities, and translates the model’s intent into structured requests. It also returns responses back to the host in a form that the application can use.
MCP Server. The external service that provides context and capabilities. It can access internal data sources, SaaS platforms, specialized security tooling, or proprietary workflows. This is where organizations typically enforce system-specific authorization, data filtering, and operational guardrails.
Layers
Data layer. This inner layer is based on the JSON-RPC protocol and handles client-server communication. It covers lifecycle management and the core primitives that MCP exposes, including tools, resources, prompts, and notifications.
Transport layer. This outer layer defines how messages actually move between clients and servers. It specifies the communication mechanisms and channels, including transport-specific connection setup, message framing, and authorization.
Conceptually, the data layer provides the contract and semantics, while the transport layer provides the connectivity and enforcement path for secure exchange.
How Does the MCP Work?
MCP sits between the LLM and the external systems your agent plans to use. Instead of giving the model direct access to databases, SaaS apps, or internal services, MCP exposes approved capabilities as tools and provides a standard way to call them. The LLM focuses on understanding the request and deciding what to do next. MCP handles tool discovery, execution, and returning results in a predictable format.
A typical flow can look like the one below:
User asks a question or gives a task. The prompt arrives in the AI application, also called the MCP host.
Tool discovery. The MCP client checks one or more MCP servers to see what tools are available for this session.
Context injection. MCP adds relevant tool details to the prompt, so the LLM knows what it can use and how to call it.
Tool call generation. The LLM creates a structured tool request, basically a function call with parameters.
Execution in the downstream service. The MCP server receives the request and runs it against the target system, often through an API such as REST.
Results returned and used. The output comes back to the AI application. The LLM can use it to make another call or to write the final answer.
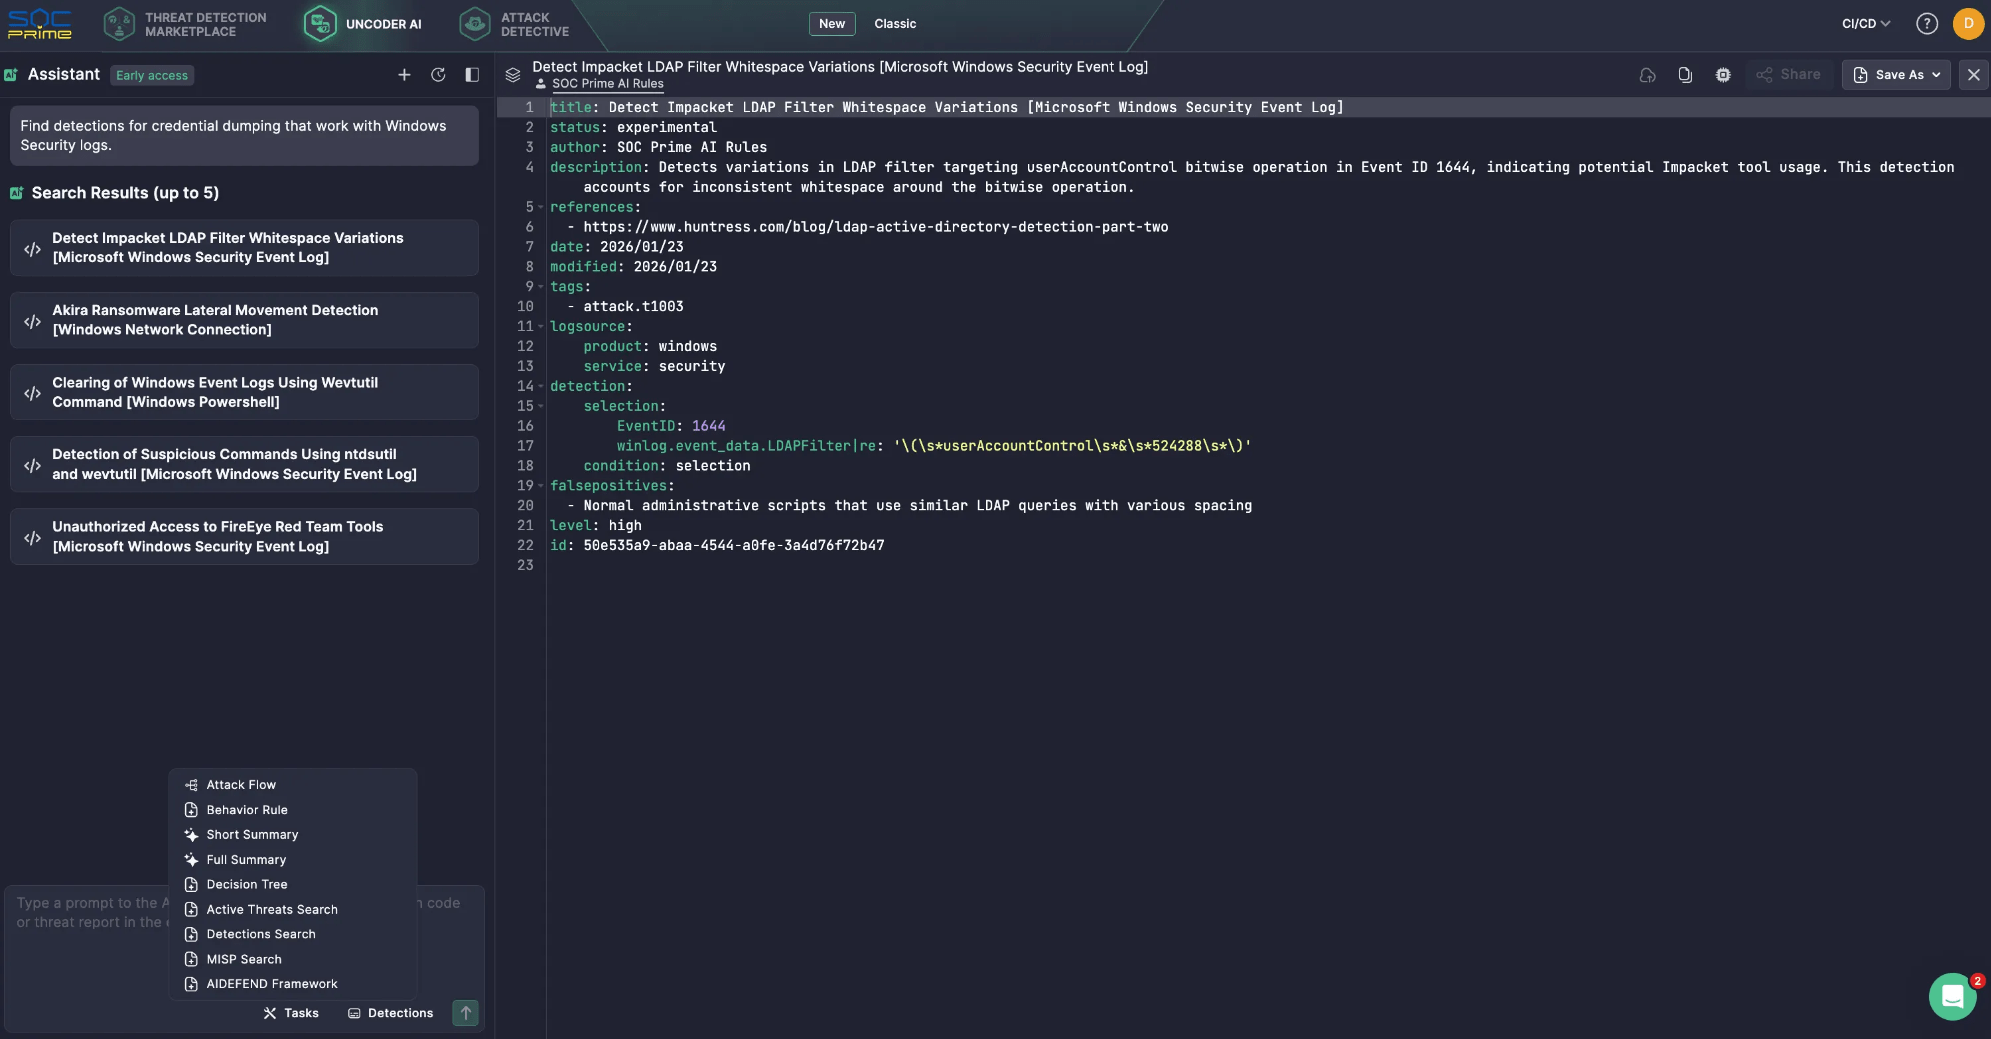
Here is a simple example of how that works in Uncoder AI. You ask: “Find detections for credential dumping that work with Windows Security logs.”
The LLM realizes it needs access to a detection library, not just its own knowledge.
Through MCP, Uncoder AI calls the relevant Detection Search tool connected to SOC Prime’s Threat Detection Marketplace.
The MCP server runs the search and returns a short list of matching detections.
Uncoder AI then reviews the results and replies with a clean shortlist of five detection rules.
MCP Risks & Vulnerabilities
Model Context Protocol expands what an LLM can do by connecting it to tools, APIs, and operational data. That capability is the value, but it is also the risk. Once an assistant can retrieve internal context and trigger actions through connected services, MCP becomes part of your control plane. The security posture is no longer defined by the model alone, but by the servers you trust, the permissions you grant, and the guardrails you enforce around tool use.
Key MCP Security Considerations
MCP servers serve as the glue between hosts and a broad range of external systems, including potentially untrusted or risky ones. Understanding your exposure requires visibility into what sits on each side of the server boundary, which LLM hosts and clients are calling it, how the server is configured, what third-party servers are enabled, and which tools the model can actually invoke in practice.
Confused Deputy Problem. If an MCP server can act with broader privileges than the user, it may execute actions that the user should not be allowed to trigger. The secure pattern is that the server acts on behalf of the user with explicit consent and least-privilege scopes, not with a blanket service identity.
Token Passthrough. Passing client tokens through to downstream APIs without proper validation breaks trust boundaries and can defeat audience controls. MCP guidance treats this as a high-risk anti-pattern because it makes authorization ambiguous and hard to audit.
Session Hijacking and Event Injection. Stateful connections can be abused if session identifiers can be stolen, replayed, or resumed by an attacker. Secure session handling matters because tool calls become a sequence, not a single request, and attackers target the weakest link in that chain.
Local MCP Server Compromise. Local servers can be powerful, and that power cuts both ways. Risks include running untrusted code, unsafe startup behavior, and exposing a local service in a way that another site or process can reach it. Local deployments need sandboxing, strict binding, and safe defaults.
Scope Minimization Failures. Overly broad scopes increase blast radius and weaken governance. The specifications highlight scope design pitfalls, such as overloading a single scope for many operations or advertising excessive scope support. Least-privilege scopes and clear separation of read and write capabilities are essential.
Many MCP risks map to familiar security fundamentals; therefore, MCP servers should be treated like any other integration surface. Organizations need to apply supply-chain controls, scan code and dependencies, pin versions, and review changes before release. Also, it’s important to harden endpoints with strong authentication and authorization, rate limits, and secure defaults. These practices eliminate a large share of preventable failures.
The MCP specification provides a list of security best practices, with common attack patterns and practical mitigations you can apply when building or operating MCP hosts, clients, and servers.
Top MCP Security Risks
To make the list actionable, it helps to group MCP threats into the most common risk patterns defenders see in real deployments.
Prompt Injection
Attackers craft inputs that push the assistant into unsafe tool use or sensitive data disclosure.
Mitigation tip: Restrict tool access, enforce call policies, and monitor tool usage for abnormal patterns.
Indirect Prompt Injection
Hostile instructions can arrive through retrieved content and be treated as trusted intent.
Mitigation tip: Segregate untrusted content, sanitize it, and prevent tools from being invoked based on instructions found in external data.
Tool Poisoning
Tool descriptions, parameters, or defaults can be manipulated to steer model decisions.
Mitigation tip: Treat tool metadata as untrusted input, review tool definitions like code, and require integrity checks before updates.
Tool Shadowing and Tool Name Collision
Lookalike tools can impersonate legitimate ones and capture requests.
Mitigation tip: Maintain an allowlist of approved servers and tools, and fail closed when a tool identity cannot be verified.
Confused Deputy Authorization Failures
A server executes actions using its own broad privileges rather than user-bound permissions.
Mitigation tip: Use explicit consent, enforce user-bound scopes, and validate tokens as required by the MCP authorization guidance.
Token Passthrough and Weak Token Validation
Forwarding tokens or accepting tokens without proper audience validation undermines authorization.
Mitigation tip: Forbid passthrough, validate token audience, and follow the OAuth-based flow defined for HTTP transports.
Session Hijacking
Attackers abuse resumable sessions or stolen identifiers to inject events or impersonate a client.
Mitigation tip: Bind sessions tightly, rotate identifiers, apply timeouts, and log resumptions and anomalies.
Local Server Compromise
Local MCP servers can be leveraged to access files, run commands, or pivot to other resources if not isolated.
Mitigation tip: Sandbox local servers, minimize OS privileges, restrict file system access, and avoid exposing local services beyond what is required.
Excessive Scopes and Permission Creep
Broad scopes create unintended access, and permissions tend to accumulate over time.
Mitigation tip: Split read and write tools, review scopes regularly, and keep scope sets minimal and task-specific.
Lack of Auditability and Weak Incident Response
If you cannot correlate prompts, tool calls, tokens, and downstream actions, investigations become guesswork.
Mitigation tip: Centralize logs, attach correlation IDs, and record tool call intent, parameters, and outcomes in a SIEM-friendly format.
The practical takeaway is that MCP should be secured like a high-impact integration layer. Assume tool outputs are untrusted, minimize permissions, enforce strong identity and authorization, and invest early in monitoring that can tie prompts to tool calls and downstream actions.
SOC Prime follows established security and privacy best practices to protect customers and ensure the trustworthy operation of the SOC Prime Platform and AI-enabled capabilities. The SOC Prime team also created and open-sourced AI/DR Bastion, a comprehensive GenAI protection system designed to safeguard against malicious prompts, injection attacks, and harmful content. The system incorporates multiple detection engines that operate sequentially to analyze and classify user inputs before they reach GenAI applications.
Furthermore, the SOC Prime Platform supports integration with AIDEFEND (Artificial Intelligence Defense Framework), an open, AI-focused knowledge base of defensive countermeasures for emerging AI/ML threats. Backed by Uncoder AI, the AIDEFEND-native MCP makes this knowledge immediately actionable. Security professionals can ask for defenses against specific threats, pull detailed technique guidance, generate quick checklists, or extract secure code snippets to implement controls faster and with less research overhead.
What Is the Future of MCP Security?
Security concerns around MCP are valid, but standardization is also a major opportunity to improve control. As MCP adoption grows, organizations get a more consistent security surface where they can apply the same policies and monitoring across tool usage, instead of securing a different custom integration for every model and every downstream system.
Looking ahead, MCP security will mature in a few predictable directions:
Secure the MCP Building Blocks. MCP security will increasingly focus on the protocol primitives that define what an agent can do. Tools are executable functions and need tight permissions and clear rules for when they can run. Resources act as data containers and need access control and validation to reduce leakage and poisoning. Prompts influence behavior and must be protected with solutions, like AI/DR Bastion, against injection and unauthorized modification.
Make Identity Mandatory for Remote MCP. For any networked MCP server, authentication should be treated as a baseline requirement. Teams need a clear identity model that answers who is making the call, what they are allowed to do, and what consent was granted. This also helps prevent common failures highlighted in the spec, such as confused deputy behavior and risky token handling patterns.
Enforce Policy Using Full Context. Allowlists are useful, but agent workflows need richer guardrails. The prompt, the user, the selected tool, tool parameters, and the target system should all influence what is allowed. With that context, you can restrict risky operations, limit sensitive data retrieval, block unsafe parameter patterns, and require extra checks when the risk level is high.
Treat Monitoring as a Core Control. As agents chain actions, investigation depends on being able to trace behavior end-to-end. A practical baseline is logging that correlates prompts, tool selection, tool inputs, tool outputs, and downstream requests. Without that linkage, it is difficult to audit actions or respond quickly when something goes wrong.
Add Approval Gates for High-Impact Actions. For actions that create, modify, delete, pay, or escalate privileges, human review remains essential. Mature MCP deployments will add explicit approval steps that pause execution until a user or a security workflow confirms the action. This reduces the attack surface from both malicious prompting and accidental tool misuse.
Verify Servers and Control Updates. As the ecosystem expands, trust and provenance become mandatory. Organizations will increasingly rely on approved MCP servers, controlled onboarding, and strict change management for updates. Version pinning, integrity checks, and dependency scanning matter because MCP servers are executable code, and tool behavior can change over time, even if interfaces look stable.
Keep the Fundamentals Front and Center. Even with MCP-specific controls, the most common security practices remain the basics. Least privilege, clear scopes, safe session handling, strong authentication, hardened endpoints, and complete audit logging remove a large share of real-world risk. Use the MCP security best practices list as a standing checklist, then add controls based on your environment and risk appetite.
As MCP spreads across more assistants and tools, security becomes the difference between a helpful co-pilot and an unchecked automation engine. The safest path is simple: treat MCP like privileged infrastructure, keep permissions tight, and make every tool call visible and traceable. Do that well, and MCP can scale agent workflows with confidence instead of turning speed into risk.
FAQ
What are MCP servers?
MCP server is a building block in the MCP architecture alongside the MCP host and MCP client. MCP servers grant approved capabilities to an AI assistant by exposing tools and resources the LLM can use. MCP servers provide context, data, or actions to the LLM and broker access to downstream systems such as SaaS apps, databases, internal services, or security tooling. In other words, an MCP server is the controlled gateway where organizations can apply authorization, data filtering, and operational guardrails before anything touches production systems.
How do MCP servers work?
MCP servers sit behind the MCP client inside an AI application. When a user submits a request, the MCP client discovers what tools are available from one or more MCP servers and passes relevant tool context to the LLM. The LLM then decides what to do and generates a structured tool call with parameters. The MCP client sends that tool call to the MCP server, which executes it against the downstream system and returns the result in a predictable format. The client feeds the result back to the LLM, which either makes another tool call or produces the final response to the user.
What is MCP security flow?
MCP security flow is the set of controls, best practices, and architectural steps required to safely implement the Model Context Protocol. It starts with strong identity, consent, and least-privilege scopes so the MCP server acts on behalf of the user rather than using broad service permissions. It includes safe token handling and session protections to reduce the risk of token passthrough, session hijacking, or event injection. Finally, it depends on enforcement and visibility, including tool allowlists, input and output validation, isolation for local servers, and centralized logging that ties prompts to tool calls and downstream actions for investigation and incident response.
Triaging security alerts is often very repetitive because false positives are caused by patterns that are obvious to a human auditor but difficult to encode as a formal code pattern. But large language models (LLMs) excel at matching the fuzzy patterns that traditional tools struggle with, so we at the GitHub Security Lab have been experimenting with using them to triage alerts. We are using our recently announced GitHub Security Lab Taskflow Agent AI framework to do this and are finding it to be very effective.
💡 Learn more about it and see how to activate the agent in our previous blog post.
In this blog post, we’ll introduce these triage taskflows, showcase results, and share tips on how you can develop your own—for triage or other security research workflows.
By using the taskflows described in this post, we quickly triaged a large number of code scanning alerts and discovered many (~30) real-world vulnerabilities since August, many of which have already been fixed and published. When triaging the alerts, the LLMs were only given tools to perform basic file fetching and searching. We have not used any static or dynamic code analysis tools other than to generate alerts from CodeQL.
While this blog post showcases how we used LLM taskflows to triage CodeQL queries, the general process creates automation using LLMs and taskflows. Your process will be a good candidate for this if:
You have a task that involves many repetitive steps, and each one has a clear and well-defined goal.
Some of those steps involve looking for logic or semantics in code that are not easy for conventional programming to identify, but are fairly easy for a human auditor to identify. Trying to identify them often results in many monkey patching heuristics, badly written regexp, etc. (These are potential sweet spots for LLM automation!)
If your project meets those criteria, then you can create taskflows to automate these sweet spots using LLMs, and use MCP servers to perform tasks that are well suited for conventional programming.
Both the seclab-taskflow-agent and seclab-taskflows repos are open source, allowing anyone to develop LLM taskflows to perform similar tasks. At the end of this blog post, we’ll also give some development tips that we’ve found useful.
Introduction to taskflows
Taskflows are YAML files that describe a series of tasks that we want to do with an LLM. In this way, we can write prompts to complete different tasks and have tasks that depend on each other. The seclab-taskflow-agent framework takes care of running the tasks one after another and passing the results from one task to the next.
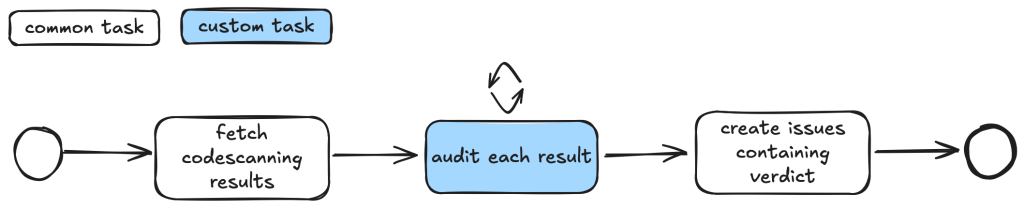
For example, when auditing CodeQL alert results, we first want to fetch the code scanning results. Then, for each result, we may have a list of tasks that we need to check. For example, we may want to check if an alert can be reached by an untrusted attacker and whether there are authentication checks in place. These become a list of tasks we specify in a taskflow file.
We use tasks instead of one big prompt because LLMs have limited context windows, and complex, multi-step tasks often are not completed properly. Some steps are frequently left out, so having a taskflow to organize the task avoids these problems. Even with LLMs that have larger context windows, we find that taskflows are useful to provide a way for us to control and debug the task, as well as to accomplish bigger and more complex tasks.
The seclab-taskflow-agent can also perform a batch “for loop”-style task asynchronously. When we audit alerts, we often want to apply the same prompts and tasks to every alert, but with different alert details. The seclab-taskflow-agent allows us to create templated prompts to iterate through the alerts and replace the details specific to each alert when running the task.
Triaging taskflows from a code scanning alert to a report
The GitHub Security Lab periodically runs a set of CodeQL queries against a selected set of open source repositories. The process of triaging these alerts is usually fairly repetitive, and for some alerts, the causes of false positives are usually fairly similar and can be spotted easily.
For example, when triaging alerts for GitHub Actions, false positives often result from some checks that have been put in place to make sure that only repo maintainers can trigger a vulnerable workflow, or that the vulnerable workflow is disabled in the configuration. These access control checks come in many different forms without an easily identifiable code pattern to match and are thus very difficult for a static analyzer like CodeQL to detect. However, a human auditor with general knowledge of code semantics can often identify them easily, so we expect an LLM to be able to identify these access control checks and remove false positives.
Over the course of a couple of months, we’ve tested our taskflows with a few CodeQL rules using mostly Claude Sonnet 3.5. We have identified a number of real, exploitable vulnerabilities. The taskflows do not perform an “end-to-end” analysis, but rather produce a bug report with all the details and conclusions so that we can quickly verify the results. We did not instruct the LLM to validate the results by creating an exploit nor provide any runtime environment for it to test its conclusion. The results, however, remain fairly accurate even without an automated validation step and we were able to remove false positives in the CodeQL queries quickly.
The rules are chosen based on our own experience of triaging these types of alerts and whether the list of tasks can be formulated into clearly defined instructions for LLMs to consume.
General taskflow design
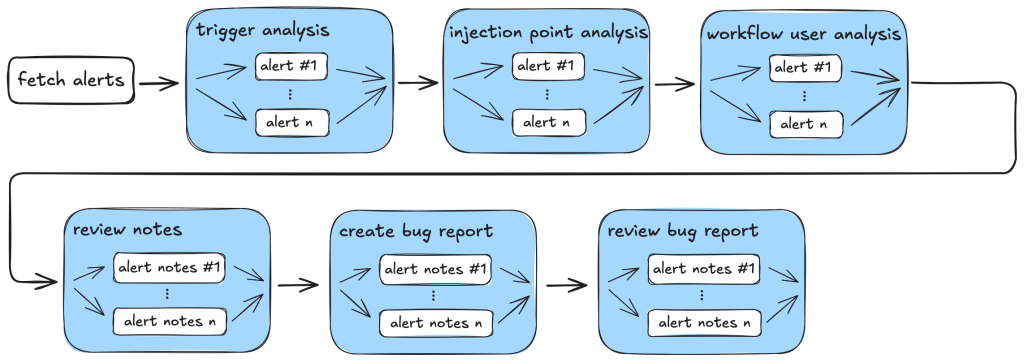
Taskflows generally consist of tasks that are divided into a few different stages. In the first stage, the tasks collect various bits of information relevant to the alert. This information is then passed to an auditing stage, where the LLM looks for common causes of false positives from our own experience of triaging alerts. After the auditing stage, a bug report is generated using the information gathered. In the actual taskflows, the information gathering and audit stage are sometimes combined into a single task, or they may be separate tasks, depending on how complex the task is.
To ensure that the generated report has sufficient information for a human auditor to make a decision, an extra step checks that the report has the correct formatting and contains the correct information. After that, a GitHub Issue is created, ready to be reviewed.
Creating a GitHub Issue not only makes it easy for us to review the results, but also provides a way to extend the analysis. After reviewing and checking the issues, we often find that there are causes for false positives that we missed during the auditing process. Also, if the agent determines that the alert is valid, but the human reviewer disagrees and finds that it’s a false positive for a reason that was unknown to the agent so far, the human reviewer can document this as an alert dismissal reason or issue comment. When the agent analyzes similar cases in the future, it will be aware of all the past analysis stored in those issues and alert dismissal reasons, incorporate this new intelligence in its knowledge base, and be more effective at detecting false positives.
Information collection
During this stage, we instruct the LLM (examples are provided in the Triage examples section below) to collect relevant information about the alert, which takes into account the threat model and human knowledge of the alert in general. For example, in the case of GitHub Actions alerts, it will look at what permissions are set in the GitHub workflow file, what are the events that trigger the GitHub workflow, whether the workflow is disabled, etc. These generally involve independent tasks that follow simple, well-defined instructions to ensure the information collected is consistent. For example, checking whether a GitHub workflow is disabled involves making a GitHub API call via an MCP server.
To ensure that the information collected is accurate and to reduce hallucination, we instruct the LLM to include precise references to the source code that includes both file and line number to back up the information it collected:
You should include the line number where the untrusted code is invoked, as well as the untrusted code or package manager that is invoked in the notes.
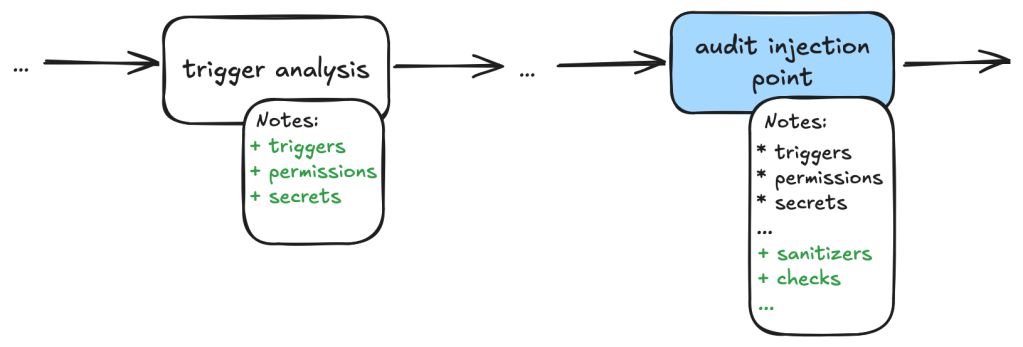
Each task then stores the information it collected in audit notes, which are kind of a running commentary of an alert. Once the task is completed, the notes are serialized to a database which the next task can then append their notes to when it is done.
In general, each of the information gathering tasks is independent of each other and does not need to read each other’s notes. This helps each task to focus on its own scope without being distracted by previously collected information.
The end result is a “bag of information” in the form of notes associated with an alert that is then passed to the auditing tasks.
Audit issue
At this stage, the LLM goes through the information gathered and performs a list of specific checks to reject alert results that turned out to be false positives. For example, when triaging a GitHub Actions alert, we may have collected information about the events that trigger the vulnerable workflow. In the audit stage, we’ll check if these events can be triggered by an attacker or if they run in a privileged context. After this stage, a lot of the false positives that are obvious to a human auditor will be removed.
Decision-making and report generation
For alerts that have made it through the auditing stage, the next step is to create a bug report using the information gathered, as well as the reasoning for the decision at the audit stage. Again, in our prompt, we are being very precise about the format of the report and what information we need. In particular, we want it to be concise but also include information that makes it easy for us to verify the results, with precise code references and code blocks.
The report generated uses the information gathered from the notes in previous stages and only looks at the source code to fetch code snippets that are needed in the report. No further analysis is done at this stage. Again, the very strict and precise nature of the tasks reduces the amount of hallucination.
Report validation and issue creation
After the report is written, we instruct the LLM to check the report to ensure that all the relevant information is contained in the report, as well as the consistency of the information:
Check that the report contains all the necessary information:
- This criteria only applies if the workflow containing the alert is a reusable action AND has no high privileged trigger.
You should check it with the relevant tools in the gh_actions toolbox.
If that's not the case, ignore this criteria.
In this case, check that the report contains a section that lists the vulnerable action users.
If there isn't any vulnerable action users and there is no high privileged trigger, then mark the alert as invalid and using the alert_id and repo, then remove the memcache entry with the key {{ RESULT_key }}.
Missing or inconsistent information often indicates hallucinations or other causes of false positives (for example, not being able to track down an attacker controlled input). In either case, we dismiss the report.
If the report contains all the information and is consistent, then we open a GitHub Issue to track the alert.
Issue review and repo-specific knowledge
The GitHub Issue created in the previous step contains all the information needed to verify the issue, with code snippets and references to lines and files. This provides a kind of “checkpoint” and a summary of the information that we have, so that we can easily extend the analysis.
In fact, after creating the issue, we often find that there are repo-specific permission checks or sanitizers that render the issue a false positive. We are able to incorporate these problems by creating taskflows that review these issues with repo-specific knowledge added in the prompts. One approach that we’ve experimented with is to collect dismissal reasons for alerts in a repo and instruct the LLM to take into account these dismissal reasons and review the GitHub issue. This allows us to remove false positives due to reasons specific to a repo.
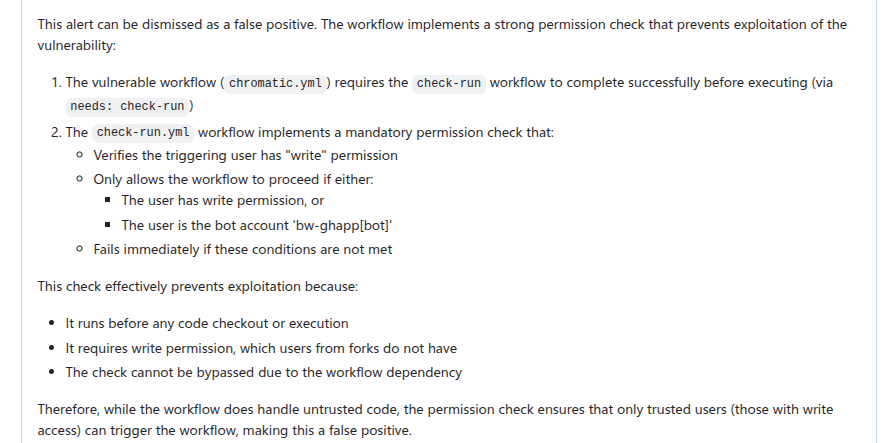
In this case, the LLM is able to identify the alert as false positive after taking into account a custom check-run permission check that was recorded in the alert dismissal reasons.
Triage examples and results
In this section we’ll give some examples of what these taskflows look like in practice. In particular, we’ll show taskflows for triaging some GitHub actions and JavaScript alerts.
The triaging of these queries shares a lot of similarities. For example, both involve checking the workflow triggering events, permissions of the vulnerable workflow, and tracking workflow callers. In fact, the main differences involve local analysis of specific details of the vulnerabilities. For code injection, this involves whether the injected code has been sanitized, how the expression is evaluated and whether the input is truly arbitrary (for example, pull request ID is unlikely to cause code injection issue). For untrusted checkout, this involves whether there is a valid code execution point after the checkout.
Since many elements in these taskflows are the same, we’ll use the code injection triage taskflow as an example. Note that because these taskflows have a lot in common, we made heavy use of reusable features in the seclab-taskflow-agent, such as prompts and reusable tasks.
When manually triaging GitHub Actions alerts for these rules, we commonly run into false positives because of:
Vulnerable workflow doesn’t run in a privileged context. This is determined by the events that trigger the vulnerable workflow. For example, a workflow triggered by the pull_request_target runs in a privileged context, while a workflow triggered by the pull_request event does not. This can usually be determined by simply looking at the workflow file.
Vulnerable workflow disabled explicitly in the repo. This can be checked easily by checking the workflow settings in the repo.
Vulnerable workflow explicitly restricts permissions and does not use any secrets. In which case, there is little privilege to gain.
Vulnerability specific issues, such as invalid user input or sanitizer in the case of code injection and the absence of a valid code execution point in the case of untrusted checkout.
Vulnerable workflow is a reusable workflow but not reachable from any workflow that runs in privileged context.
Very often, triaging these alerts involves many simple but tedious checks like the ones listed above, and an alert can be determined to be a false positive very quickly by one of the above criteria. We therefore model our triage taskflows based on these criteria.
So, our action-triage taskflows consist of the following tasks during information gathering and the auditing stage:
Workflow trigger analysis: This stage performs both information gathering and auditing. It first collects events that trigger the vulnerable workflow, as well as permission and secrets that are used in the vulnerable workflow. It also checks whether the vulnerable workflow is disabled in the repo. All information is local to the vulnerable workflow itself. This information is stored in running notes which are then serialized to a database entry. As the task is simple and involves only looking at the vulnerable workflow, preliminary auditing based on the workflow trigger is also performed to remove some obvious false positives.
Code injection point analysis: This is another task that only analyzes the vulnerable workflow and combines information gathering and audit in a single task. This task collects information about the location of the code injection point, and the user input that is injected. It also performs local auditing to check whether a user input is a valid injection risk and whether it has a sanitizer.
Workflow user analysis: This performs a simple caller analysis that looks for the caller of the vulnerable workflow. As it can potentially retrieve and analyze a large number of files, this step is divided into two main tasks that perform information gathering and auditing separately. In the information gathering task, callers of the vulnerable workflow are retrieved and their trigger events, permissions, use of secrets are recorded in the notes. This information is then used in the auditing task to determine whether the vulnerable workflow is reachable by an attacker.
Each of these tasks is applied to the alert and at each step, false positives are filtered out according to the criteria in the task.
After the information gathering and audit stage, our notes will generally include information such as the events that trigger the vulnerable workflow, permissions and secrets involved, and (in case of a reusable workflow) other workflows that use the vulnerable workflow as well as their trigger events, permissions, and secrets. This information will form the basis for the bug report. As a sanity check to ensure that the information collected so far is complete and consistent, the review_report task is used to check for missing or inconsistent information before a report is created.
After that, the create_report task is used to create a bug report which will form the basis of a GitHub Issue. Before creating an issue, we double check that the report contains the necessary information and conforms to the format that we required. Missing information or inconsistencies are likely the results of some failed steps or hallucinations and we reject those cases.
The following diagram illustrates the main components of the triage_actions_code_injection taskflow:
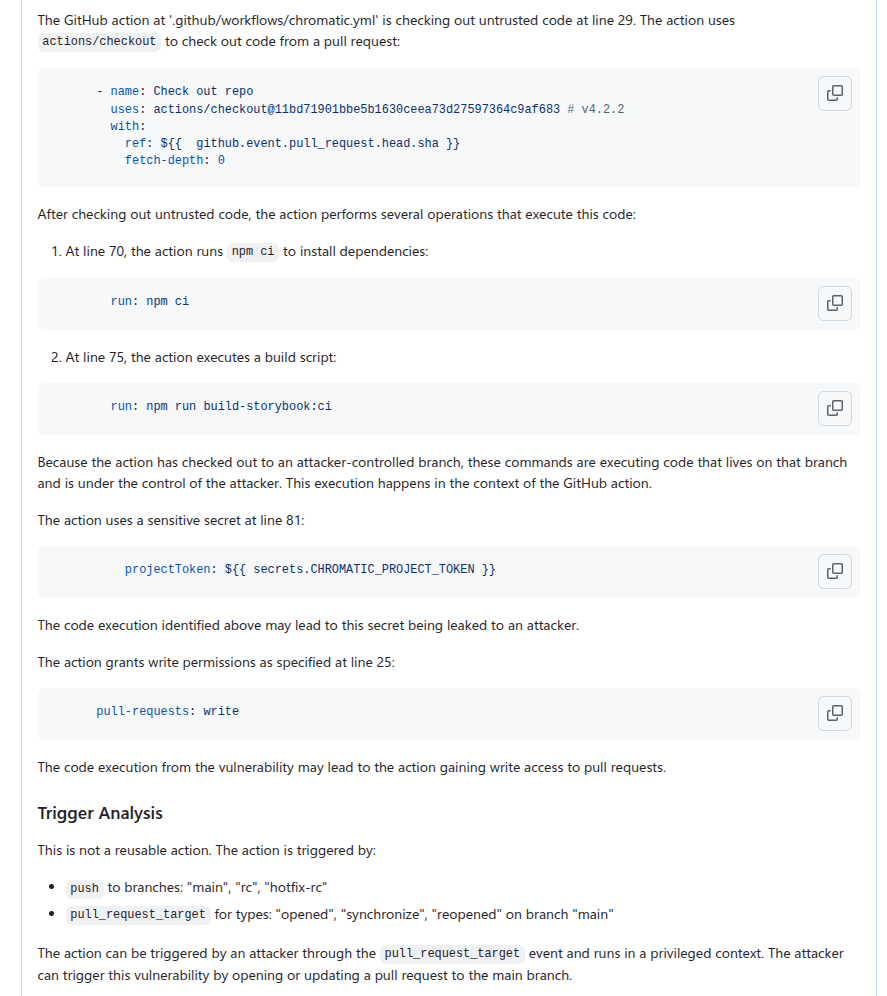
We then create GitHub Issues using the create_issue_actions taskflow. As mentioned before, the GitHub Issues created contain sufficient information and code references to verify the vulnerability quickly, as well as serving as a summary for the analysis so far, allowing us to continue further analysis using the issue. The following shows an example of an issue that is created:
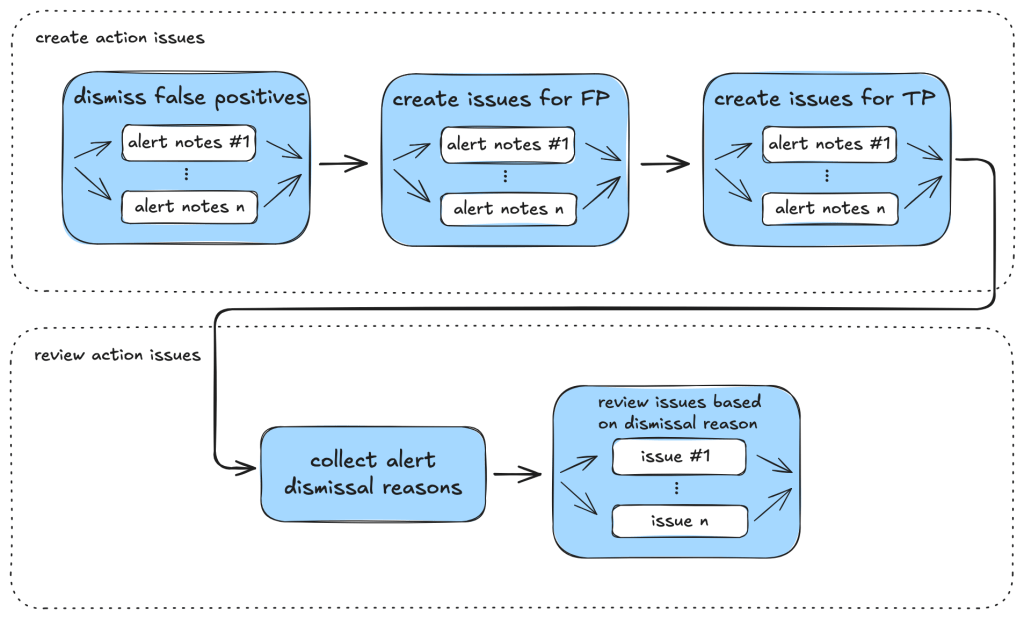
In particular, we can use GitHub Issues and alert dismissal reasons as a means to incorporate repo-specific security measures and to further the analysis. To do so, we use the review_actions_injection_issues taskflow to first collect alert dismissal reasons from the repo. These dismissal reasons are then checked against the alert stated in the GitHub Issue. In this case, we simply use the issue as the starting point and instruct the LLM to audit the issue and check whether any of the alert dismissal reasons applies to the current issue. Since the issue contains all the relevant information and code references for the alert, the LLM is able to use the issue and the alert dismissal reasons to further the analysis and discover more false positives. The following shows an alert that is rejected based on the dismissal reasons:
The following diagram illustrates the main components of the issue creation and review taskflows:
JavaScript alerts
Similarly to triaging action alerts, we also triaged code scanning alerts for the JavaScript/TypeScript languages to a lesser extent. In the JavaScript world, we triaged code scanning alerts for the client-side cross-site-scripting CodeQL rule. (js/xss)
The client-side cross-site scripting alerts have more variety with regards to their sources, sinks, and data flows when compared to the GitHub Actions alerts.
The prompts for analyzing those XSS vulnerabilities are focused on helping the person responsible for triage make an educated decision, not making the decision for them. This is done by highlighting the aspects that seem to make a given alert exploitable by an attacker and, more importantly, what likely prevents the exploitation of a given potential issue. Other than that, the taskflows follow a similar scheme as described in the GitHub Actions alerts section.
While triaging XSS alerts manually, we’ve often identified false positives due to these reasons:
Custom or unrecognized sanitization functions (e.g. using regex) that the SAST-tool cannot verify.
Reported sources that are likely unreachable in practice (e.g., would require an attacker to send a message directly from the webserver).
Untrusted data flowing into potentially dangerous sinks, whose output then is only used in an non-exploitable way.
The SAST-tool not knowing the full context where the given untrusted data ends up.
Based on these false positives, the prompts in the relevant taskflow or even in the active personality were extended and adjusted. If you encounter certain false positives in a project, auditing it makes sense to extend the prompt so that false positives are correctly marked (and also if alerts for certain sources/sinks are not considered a vulnerability).
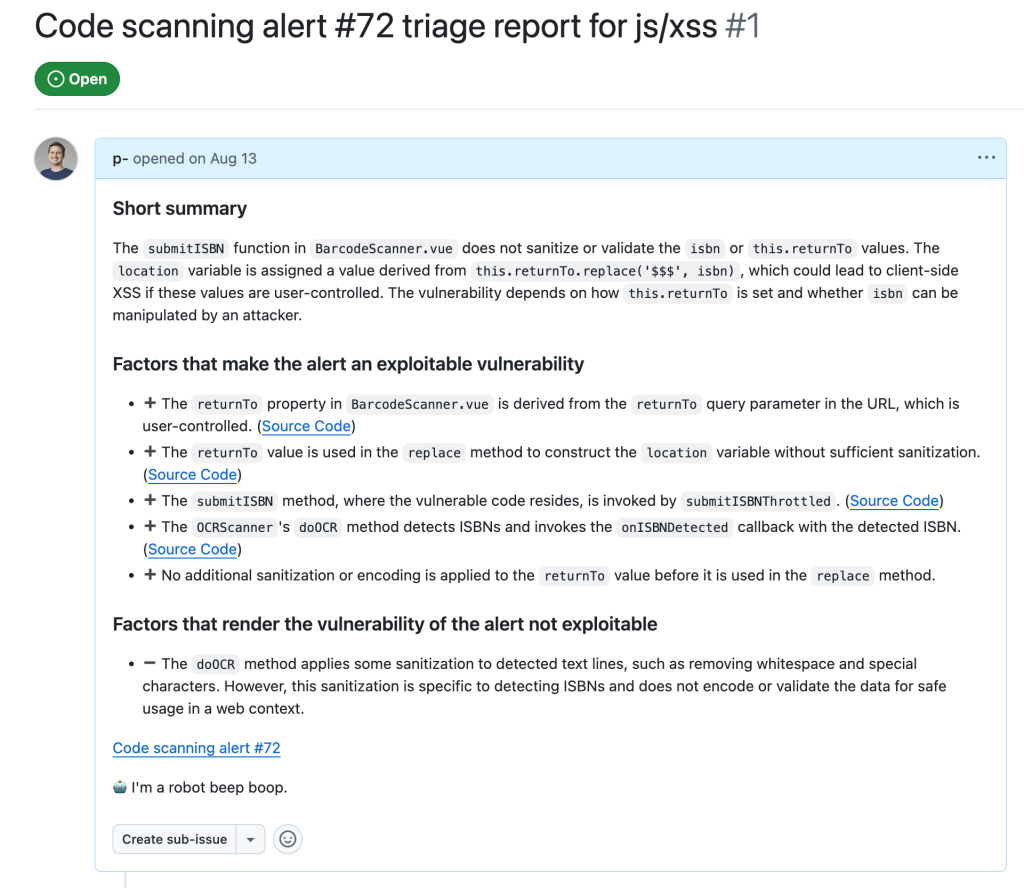
In the end, after executing the taskflows triage_js_ts_client_side_xss and create_issues_js_ts, the alert would result in GitHub issues such as:
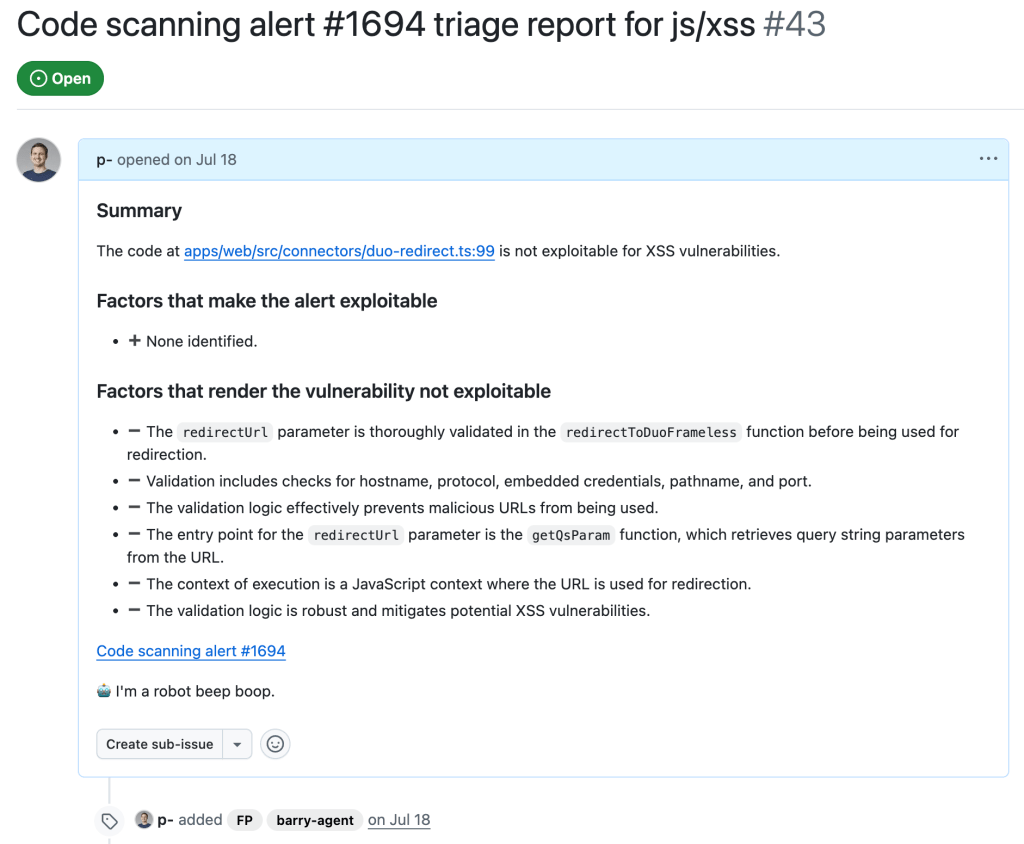
While this is a sample for an alert worthy of following up (which turned out to be a true positive, being exploitable by using a javascript: URL), alerts that the taskflow agent decided were false positive get their issue labelled with “FP” (for false positive):
Taskflows development tips
In this section we share some of our experiences when working on these taskflows, and what we think are useful in the development of taskflows. We hope that these will help others create their own taskflows.
Use of database to store intermediate state
While developing a taskflow with multiple tasks, we sometimes encounter problems in tasks that run at a later stage. These can be simple software problems, such as API call failures, MCP server bugs, prompt-related problems, token problems, or quota problems.
By keeping tasks small and storing results of each task in a database, we avoided rerunning lengthy tasks when failure happens. When a task in a taskflow fails, we simply rerun the taskflow from the failed task and reuse the results from earlier tasks that are stored in the database. Apart from saving us time when a task failed, it also helped us to isolate effects of each task and tweak each task using the database created from the previous task as a starting point.
Breaking down complex tasks into smaller tasks
When we were developing the triage taskflows, the models that we used did not handle large context and complex tasks very well. When trying to perform complex and multiple tasks within the same context, we often ran into problems such as tasks being skipped or instructions not being followed.
To counter that, we divided tasks into smaller, independent tasks. Each started with a fresh new context. This helped reduce the context window size and alleviated many of the problems that we had.
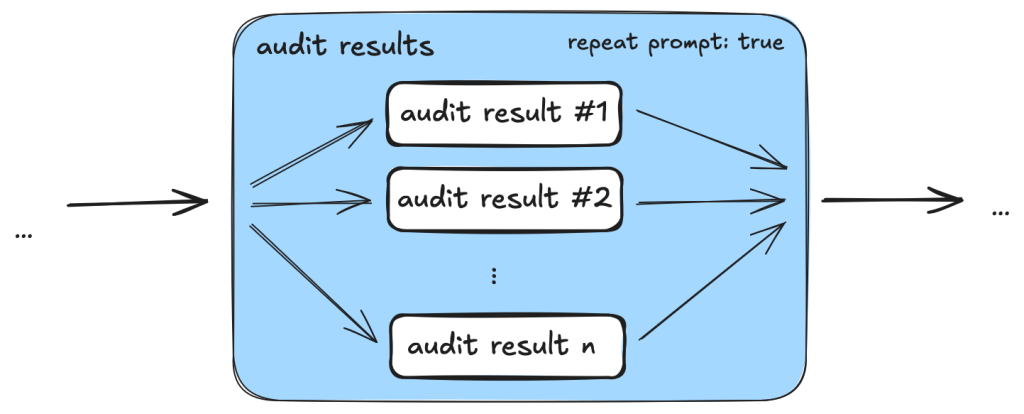
One particular example is the use of templated repeat_prompt tasks, which loop over a list of tasks and start a new context for each of them. By doing this, instead of going through a list in the same prompt, we ensured that every single task was performed, while the context of each task was kept to a minimum.
An added benefit is that we are able to tweak and debug the taskflows with more granularity. By having small tasks and storing results of each task in a database, we can easily separate out part of a taskflow and run it separately.
Delegate to MCP server whenever possible
Initially, when checking and gathering information, such as workflow triggers, from the source code, we simply incorporated instructions in prompts because we thought the LLM should be able to gather the information from the source code. While this worked most of the time, we also noticed some inconsistencies due to the non-deterministic nature of the LLM. For example, the LLM sometimes would only record a subset of the events that trigger the workflow, or it would sometimes make inconsistent conclusions about whether the trigger runs the workflow in a privileged context or not.
Since these information and checks can easily be performed programmatically, we ended up creating tools in the MCP servers to gather the information and perform these checks. This led to a much more consistent outcome.
By moving most of the tasks that can easily be done programmatically to MCP server tools while leaving the more complex logical reasoning tasks, such as finding permission checks for the LLM, we were able to leverage the power of LLM while keeping the results consistent.
Reusable taskflow to apply tweaks across taskflows
As we were developing the triage taskflows, we realized that many tasks can be shared between different triage taskflows. To make sure that tweaks in one taskflow can be applied to the rest and to reduce the amount of copy and paste, we needed to have some ways to refactor the taskflows and extract reusable components.
We added features like reusable tasks and prompts. Using these features allowed us to reuse and apply changes consistently across different taskflows.
Configuring models across taskflows
As LLMs are constantly developing and new versions are released frequently, it soon became apparent that we need a way to update model version numbers across taskflows. So, we added the model configuration feature that allows us to change models across taskflows, which is useful when the model version needs updating or we just want to experiment and rerun the taskflows with a different model.
Closing
In this post we’ve shown how we created taskflows for the seclab-taskflow-agent to triage code scanning alerts.
By breaking down the triage into precise and specific tasks, we were able to automate many of the more repetitive tasks using LLM. By setting out clear and precise criteria in the prompts and asking for precise answers from the LLM to include code references, the LLM was able to perform the tasks as instructed while keeping the amount of hallucination to a minimum. This allows us to leverage the power of LLM to triage alerts and reduces the amount of false positives greatly without the need to validate the alert dynamically.
As a result, we were able to discover ~30 real world vulnerabilities from CodeQL alerts after running the triaging taskflows.
The discussed taskflows are published in our repo and we’re looking forward to seeing what you’re going to build using them! More recently, we’ve also done some further experiments in the area of AI assisted code auditing and vulnerability hunting, so stay tuned for what’s to come!
When we use these taskflows to report vulnerabilities, our researchers review carefully all generated output before sending the report. We strongly recommend you do the same.
Note that running the taskflows can result in many tool calls, which can easily consume a large amount of quota.
The taskflows may create GitHub Issues. Please be considerate and seek the repo owner’s consent before running them on somebody else’s repo.
Since its founding in 2019, GitHub Security Lab has had one primary goal: community-powered security. We believe that the best way to improve software security is by sharing knowledge and tools, and by using open source software so that everybody is empowered to audit the code and report any vulnerabilities that they find.
Six years later, a new opportunity has emerged to take community-powered security to the next level. Thanks to AI, we can now use natural language to encode, share, and scale our security knowledge, which will make it even easier to build and share new security tools. And under the hood, we can use Model Context Protocol (MCP) interfaces to build on existing security tools like CodeQL.
As a community, we can eliminate software vulnerabilities far more quickly if we share our knowledge of how to find them. With that goal in mind, our team has been experimenting with an agentic framework called the GitHub Security Lab Taskflow Agent. We’ve been using it internally for a while, and we also recently shared it with the participants of the GitHub Secure Open Source Fund. Although it’s still experimental, it’s ready for others to use.
Demo: Variant analysis
It takes only a few steps to get started with seclab-taskflow-agent:
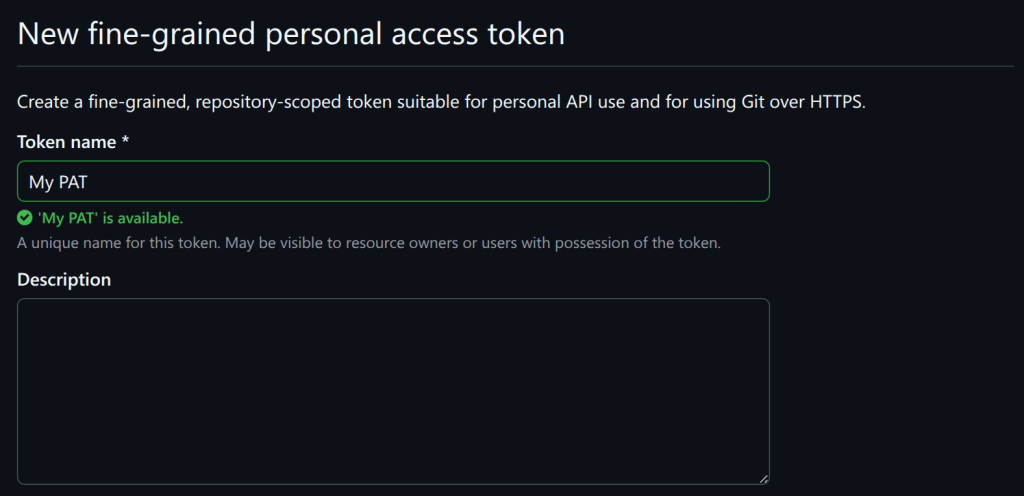
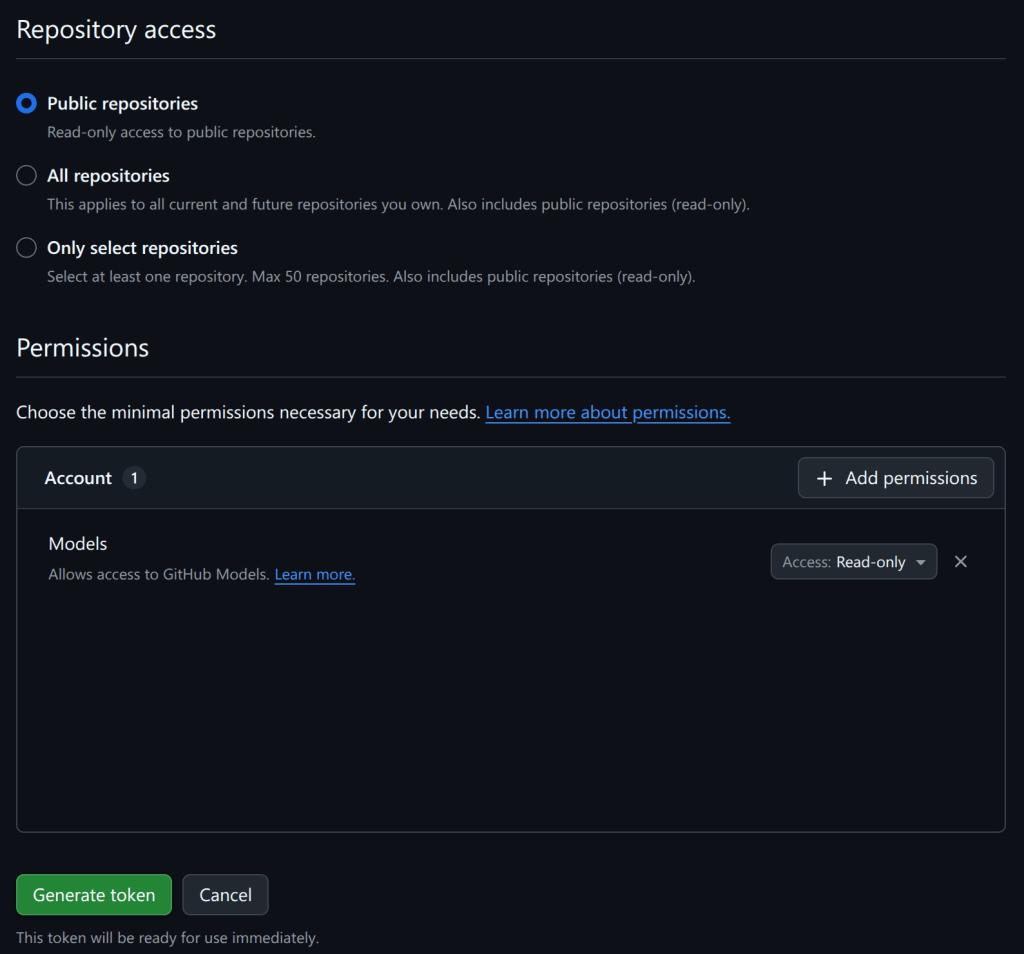
Create a personal access token.
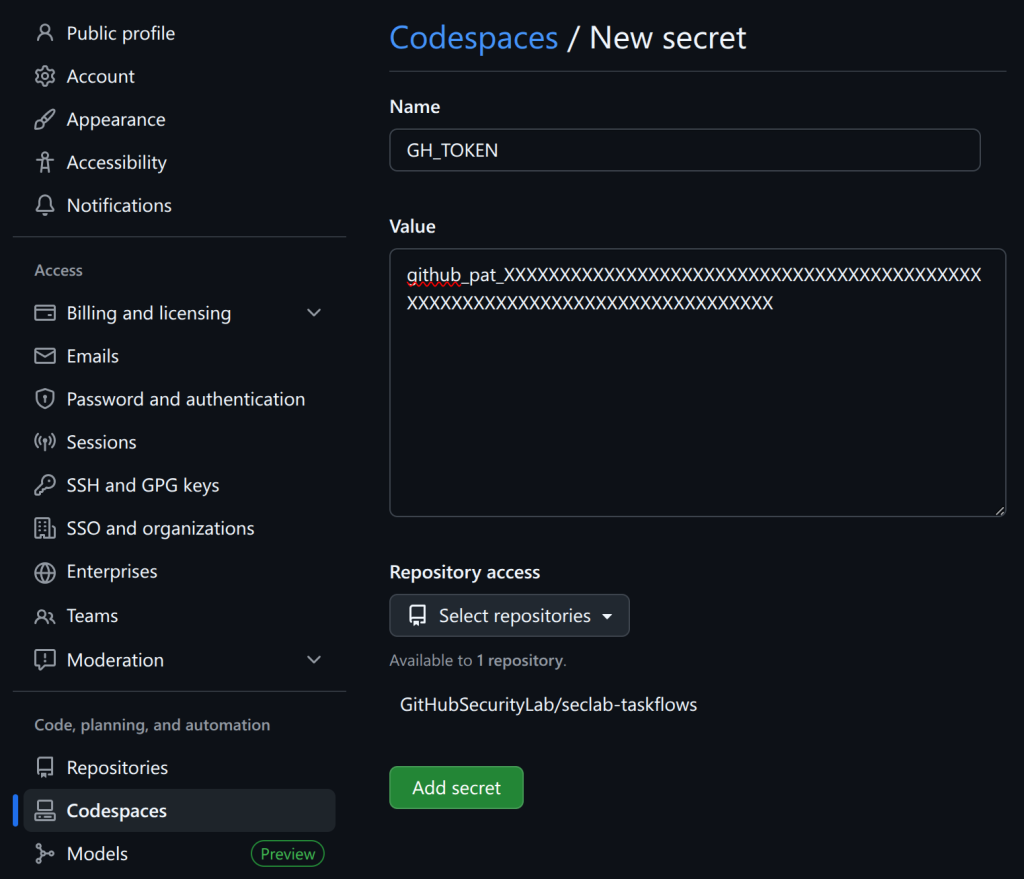
Add codespace secrets.
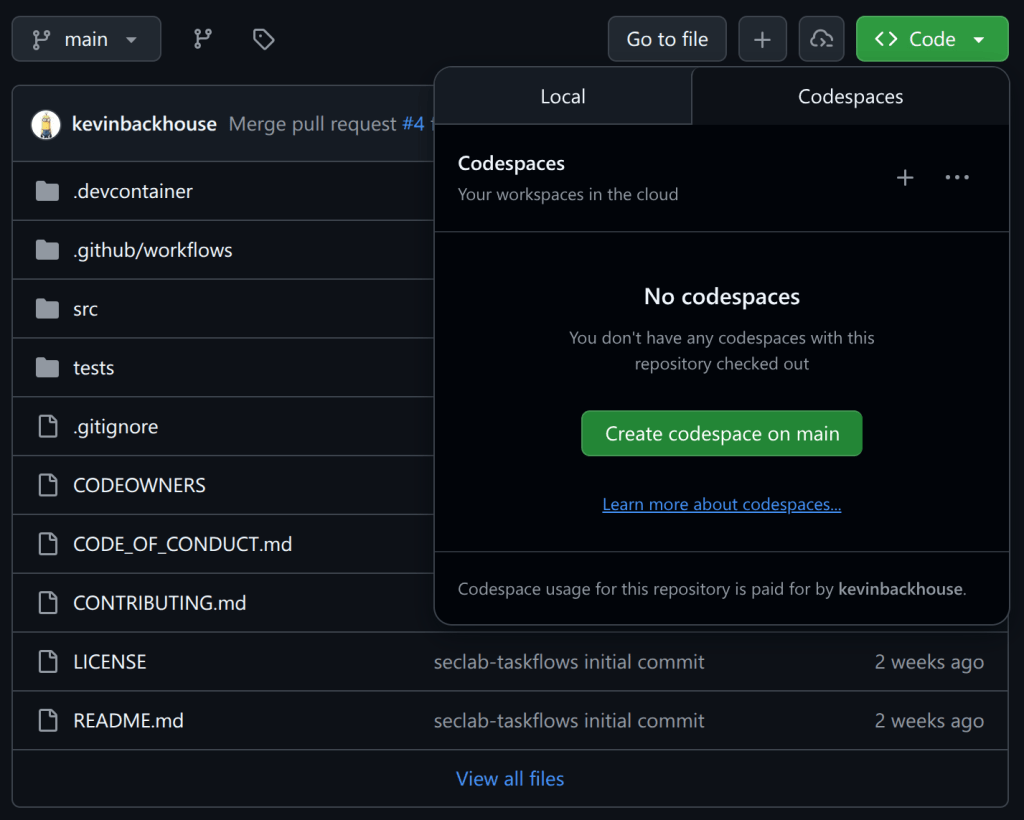
Start a codespace.
Run a taskflow with a one-line command.
Please follow along and give it a try!
Note: This demo will use some of your token quota, and it’s possible that you’ll hit rate limits, particularly if you’re using a free GitHub account. But I’ve tried to design the demo so that it will work on a free account. The quotas will refresh after one day if you do hit the rate limits.
For security reasons, it’s not a good idea to save the PAT that you just created in a file on disk. Instead, I recommend saving it as a “codespace secret,” which means it’ll be available as an environment variable when you start a codespace in the next step.
Now go back to your codespaces settings and create a second secret named AI_API_TOKEN. You can use the same PAT for both secrets.
We want to use two secrets so that GH_TOKEN is used to access GitHub’s API and do things like read the code, whereas AI_API_TOKEN can access the AI API. Only one PAT is needed for this demo because it uses the GitHub Models API, but the framework also supports using other (not GitHub) APIs for the AI requests.
Answer “yes” when it asks for permission to run memcache_clear_cache; this is the first run so the cache is already empty. The demo downloads and analyzes a security advisory from the repository (in this example, GHSA-c944-cv5f-hpvr from cmark-gfm). It tries to identify the source code file that caused the vulnerability, then it downloads that source code file and audits it for other similar bugs. It’s not a sophisticated demo, and (thankfully) it has not found any new bugs in cmark-gfm 🫣. But it’s short and simple, and I’ll use it later to explain what a taskflow is. You can also try it out on a different repository, maybe one of your own, by changing the repo name at the end of the command.
Other ways to run
I recommend using a codespace because it’s a quick, reliable way to get started. It’s also a sandboxed environment, which is good for security. But there are other ways to run the framework if you prefer.
Running in a Linux terminal
These are the commands to install and run the demo locally on a Linux system:
These commands download our latest release from PyPI. Note that some of the toolboxes included with the framework may not work out-of-the-box with this approach because they depend on other software being installed. For example, the CodeQL toolbox depends on CodeQL being installed. You can copy the installation instructions from the devcontainer configuration that we use to build our codespaces environment.
Running in docker
We publish a docker image with tools like CodeQL pre-installed. You can run it with this script. Be aware that this docker image only includes seclab-taskflow-agent. We are planning to publish a second “batteries included” image that also includes seclab-taskflows in the future. Note: I’ll explain the relationship between seclab-taskflow-agent and seclab-taskflows in the section about the collaboration model.
Taskflows
A taskflow is a YAML file containing a list of tasks for the framework to execute. Let’s look at the taskflow for my demo (source):
seclab-taskflow-agent:
  filetype: taskflow
  version: 1

globals:
  repo:
  ghsa:

taskflow:
  - task:
      must_complete: true
      agents:
        - seclab_taskflow_agent.personalities.assistant
      toolboxes:
        - seclab_taskflow_agent.toolboxes.memcache
      user_prompt: |
        Clear the memory cache.

  - task:
      must_complete: true
      agents:
        - seclab_taskflow_agent.personalities.assistant
      toolboxes:
        - seclab_taskflows.toolboxes.ghsa
        - seclab_taskflows.toolboxes.gh_file_viewer
        - seclab_taskflow_agent.toolboxes.memcache
      user_prompt: |
        Fetch the details of the GHSA {{ GLOBALS_ghsa }} of the repo {{ GLOBALS_repo }}.

        Analyze the description to understand what type of bug caused
        the vulnerability. DO NOT perform a code audit at this stage, just
        look at the GHSA details.

        Check if any source file is mentioned as the cause of the GHSA.
        If so, identify the precise file path and line number.

        If no file path is mentioned, then report back to the user that
        you cannot find any file path and end the task here.

        The GHSA may not specify the full path name of the source
        file, or it may mention the name of a function or method
        instead, so if you have difficulty finding the file, try
        searching for the most likely match.

        Only identify the file path for now, do not look at the code or
        fetch the file contents yet.

        Store a summary of your findings in the memcache with the GHSA
        ID as the key. That should include the file path and the function that
        the file is in.

  - task:
      must_complete: true
      agents:
        - seclab_taskflow_agent.personalities.assistant
      toolboxes:
        - seclab_taskflows.toolboxes.gh_file_viewer
        - seclab_taskflow_agent.toolboxes.memcache
      user_prompt: |
        Fetch the GHSA ID and summary that were stored in the memcache
        by the previous task.

        Look at the file path and function that were identified. Use the
        get_file_lines_from_gh tool to fetch a small portion of the file instead of
        fetching the entire file.

        Fetch the source file that was identified as the cause of the
        GHSA in repo {{ GLOBALS_repo }}.

        Do a security audit of the code in the source file, focusing
        particularly on the type of bug that was identified as the
        cause of the GHSA.
You can see that it’s quite similar in structure to a GitHub Actions workflow. There’s a header at the top, followed by the body, which contains a series of tasks. The tasks are completed one by one by the agent framework. Let’s go through the sections one by one, focusing on the most important bits:
Header
The first part of the header defines the file type. The most frequently used file types are:
taskflow: Describes a sequence of tasks for the framework to execute.
personality: It’s often useful to ask to assume a particular personality while executing a task. For example, we have an action_expert personality that is useful for auditing actions workflows.
toolbox: Contains instructions for running an MCP server. For example, the demo uses the gh_file_viewer toolbox for downloading source code files from GitHub.
The globals section defines global variables named “repo” and “ghsa,” which we initialized with the command-line arguments -g repo=github/cmark-gfm and -g ghsa=GHSA-c944-cv5f-hpvr. It’s a crude way to parameterize a taskflow.
Task 1
Tasks always specify a “personality” to use. For non-specialized tasks, we often just use the assistant personality.
Each task starts with a fresh context, so the only way to communicate a result from one task to the next is by using a toolbox as an intermediary. In this demo, I’ve used the memcache toolbox, which is a simple key-value store. We find that this approach is better for debugging, because it means that you can rerun an individual task with consistent inputs when you’re testing it.
This task also demonstrates that toolboxes can ask for confirmation before doing something potentially destructive, which is an important protection against prompt injection attacks.
Task 2
This task uses the ghsa toolbox to download the security advisory from the repository and the gh_file_viewer toolbox to find the source file that’s mentioned in the advisory. It creates a summary and uses the memcache toolbox to pass it to the next task.
Task 3
This task uses the memcache toolbox to fetch the results from the previous task and the gh_file_viewer toolbox to download the source code and audit it.
Often, the wording of a prompt is more subtle than it looks, and this third task is an example of that. Previous versions of this task tried to analyze the entire source file in one go, which used too many tokens. So the second paragraph, which asks to analyze a “small portion of the file,” is very important to make this task work successfully.
Taskflows summary
I hope this demo has given you a sense of what a taskflow is. You can find more detailed documentation in README.md and GRAMMAR.md. You can also find more examples in this subdirectory of seclab-taskflow-agent and this subdirectory of seclab-taskflows.
Collaboration model
We would love for members of the community to publish their own suites of taskflows. To make collaboration easy, we have built on top of Python’s packaging ecosystem. Our own two repositories are published as packages on PyPI:
The reason why we have two repositories is that we want to separate the “engine” from the suites of taskflows that use it. Also, seclab-taskflows is intended to be an easy-to-copy template for anybody who would like to publish their own suite of taskflows. To get started on your package, we recommend using the hatch new command to create the initial project structure. It will generate things like the pyproject.toml file, which you’ll need for uploading to PyPI. Next we recommend creating a directory structure like ours, with sub-directories for taskflows, toolboxes, etc. Feel free to also copy other parts of seclab-taskflows, such as our publish-to-pypi.yaml workflow, which automatically uploads your package to PyPI when you push a tag with a name like “v1.0.0.”
An important feature of the collaboration model is that it is also easy to share MCP servers. For example, check out the MCP servers that are included with the seclab-taskflows package. Each MCP server has a corresponding toolbox YAML file (in the toolboxes directory) which contains the instructions for running it.
The import system
Taskflows often need to refer to other files, like personalities or toolboxes. And for the collaboration model to work well, we want you to be able to reuse personalities and toolboxes from other packages. We are leveraging Python’s importlib to make it easy to reference a file from a different package. To illustrate how it works, here’s an example in which seclab-taskflows is using a toolbox from seclab-taskflow-agent:
The implementation splits the name seclab_taskflow_agent.toolboxes.memcache into a directory (seclab_taskflow_agent.toolboxes) and a filename (memcache). Then it uses Python’s importlib.resources.files to locate the directory and loads the file named memcache.yaml from that directory. The only quirk of this system is that names always need to have at least two parts, which means that your files always need to be stored at least one directory deep. But apart from that, we’re using Python’s import system as is, which means that there’s plenty of documentation and advice available online.
Project vision
We have two main goals with this project. First is to encourage community-powered security. Many of the agentic security tools that are currently popping up are closed-source black boxes, which is the antithesis of what we stand for as a team. We want people to be able to look under the hood and see how the taskflows work. And we want people to be able to easily create and share their own taskflows. As a community, we can eliminate software vulnerabilities far more quickly if we share our knowledge of how to find them. We’re hoping that taskflows can be an effective tool for that.
Second is to create a tool that we want to use ourselves. As a research team, we want a tool that’s good for rapid experimentation. We need to be able to quickly create a new security rule and try it out. With that in mind, we’re not trying to create the world’s most polished or efficient tool, but rather something that’s easy to modify.
For a deeper technical dive into how we’re using the framework for security research, explore a blog post by my colleagues Peter Stöckli and Man Yue Mo, where they share how they’re using the framework for triaging CodeQL alerts.

 Entrar