❌

Visualização de leitura

Pre-SIEM Detection for MSSPs

tl;dr

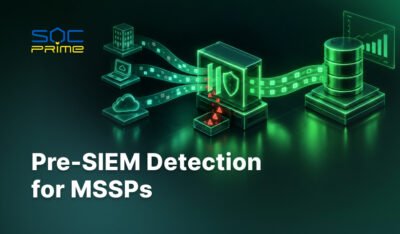
Prime Detect runs detection rules on your clients’ event streams before data reaches the SIEM. It applies Sigma rules to events in transit, tags each match with a severity and a MITRE ATT&CK technique, and links related matches into attack chains. In client testing, about 7% of telemetry was tagged.

MSSPs use Prime Detect to give every client the same 20,000+ detections regardless of which SIEM that client runs, to send less data into SIEMs they pay to operate, and to keep each client’s data inside its own pipeline. It works alongside the SIEMs you already run. It does not replace them.

Contact Sales

Why MSSPs are moving detection ahead of the SIEM

An MSSP’s detection coverage is usually set by whatever each client’s SIEM can hold. That creates three problems that grow with every client you add.

  • Uneven coverage. Clients run different SIEMs with different rule limits. The same threat can be caught for one client and missed for another, depending on the platform underneath.
  • Ingest cost. Where you operate the SIEM, every event ingested is a cost against your margin, whether it carries a threat signal or not.
  • Engineering load. Your detection engineers spend their time porting and tuning the same rules across platforms instead of building the detections clients actually pay for.

Prime Detect moves detection upstream. Rules run on events as they stream through the pipeline, before any SIEM ingests them. Coverage depends on the compute you assign, not on each client’s SIEM. You then decide, per client, what reaches the SIEM.

What Prime Detect does

Detection in the stream

  • Applies Sigma rules to events in transit, before SIEM ingest
  • Runs 20,000+ detection rules plus your own custom detections, with no fixed rule ceiling
  • Tags every match with a severity and a MITRE ATT&CK technique
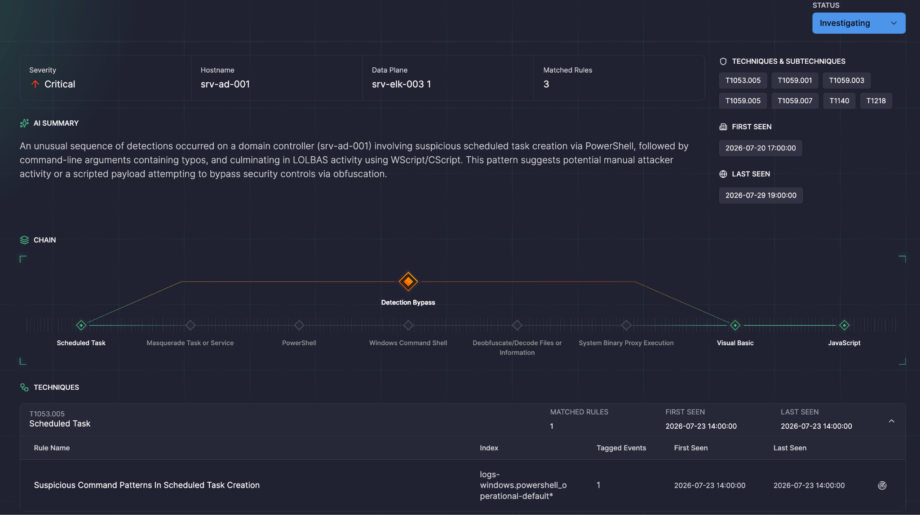
  • Links related matches into attack chains, so analysts see a sequence of activity instead of isolated alerts

Tagged telemetry you can route

  • Tags about 7% of telemetry, based on client testing
  • Sends tagged events to the SIEM and the rest to warm or cold storage, by your rules
  • Produces structured, ATT&CK-labeled events that AI triage and SOAR tools can use directly

Deployment and control

  • Runs on Kafka and Kubernetes you or your clients operate
  • Keeps data inside the pipeline, with no outbound connection required
  • Deploys air-gapped or in the cloud
  • Available open source or under an Enterprise license

How it fits with the SIEMs you already run

Prime Detect sits between the event pipeline and the SIEM. Nothing in the SIEM has to change, so it works across a mixed client base.
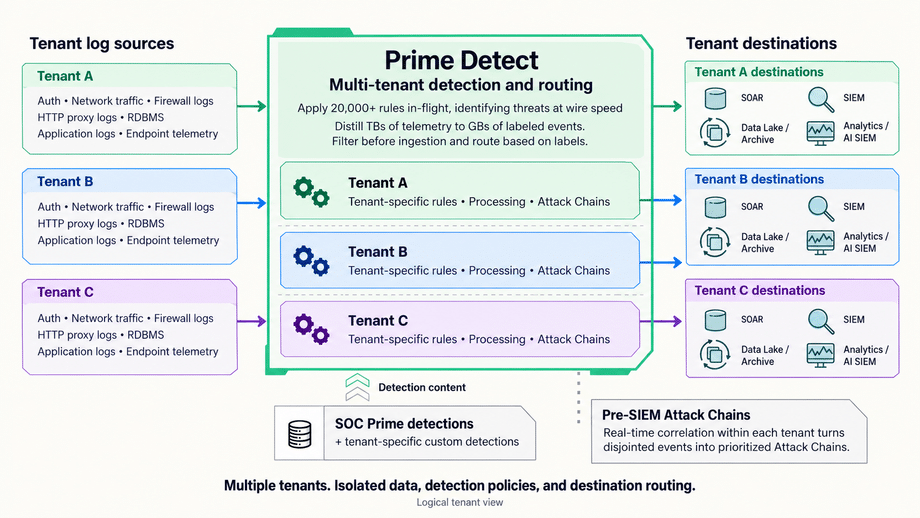
MSSPs typically deploy it in one of two ways:

  • Shared, multi-tenant: one Prime Detect deployment in your environment, with detections and routing set per tenant.
  • Per client: a deployment inside the client’s own infrastructure, for clients with strict data residency or air-gap requirements.

Rollout follows the same three steps either way:

  1. Forward everything to the SIEM as today, with Detect tags added to matched events.
  2. Add a SIEM index or dashboard that raises Detect-tagged events as high-priority alerts.
  3. Once tuned, route untagged events to warm or cold storage to cut ingest.

What Prime Detect does not do

  • It does not replace the SIEM for centralized logging, search, investigation, or retention.
  • It does not decide whether an incident is significant or reportable. Your incident process makes that call.
  • It does not make data transfer decisions for you. Where data goes, and under which agreement, stays with your firm and your clients.

NIS2, DORA, HIPAA, and GDPR: where Prime Detect fits

MSSPs carry their own obligations and inherit their clients’. NIS2 defines managed security service providers in Article 6(40) and lists them in Annex I, so many MSSPs are covered entities in their own right. Prime Detect supports the detection side of each rule below. It does not discharge any of them alone.

RuleWhat it requiresWhere Prime Detect fits
NIS2 Art. 23Early warning within 24 hours and incident notification within 72 hours of becoming aware of a significant incidentSurfaces chained activity earlier, so your team becomes aware sooner and has ATT&CK-mapped evidence for the notice
DORA Art. 28Financial entities stay fully responsible for DORA compliance when they use ICT service providersGives your financial clients a per-tenant record of what was detected, which they need to show oversight of you
HIPAA 45 CFR 164.312(b)Mechanisms that record and examine activity in systems containing ePHIExamines every event in the stream and records matches with severity and technique. Logging and retention stay in the SIEM
HIPAA 45 CFR 164.308(b), 164.314(a)Business associates report security incidents they become aware of to the covered entityTagged matches and attack chains give you the detail to report quickly and specifically
GDPR Ch. V (Arts. 44–49)Transfers of personal data outside the EU/EEA only under Chapter V conditions, including onward transfersRuns inside your or your client’s pipeline with no outbound connection, so detection itself adds no transfer

Sell coverage, not ingest

Most MSSPs price and staff around SIEM volume. That ties margin to how much data clients send, and ties coverage to which platform each client happens to run.

Prime Detect separates the two. Every client gets the same detection baseline. You send the SIEM only the events that matter. Each tenant gets an ATT&CK-mapped record of what you detected, which is the evidence regulated clients need to show oversight of their provider. Your engineers spend their time on the detections that set your service apart.

See it run. Watch Prime Detect work against a live event stream before you commit to a pilot. Request a demo, explore the live demo, or download the open source version to run it yourself.

FAQ

How can an MSSP keep detection capacity in step with client growth?

Take rule capacity out of each client’s SIEM. Prime Detect runs detections on the event stream, so coverage scales with the compute you assign, not with SIEM limits. Each new client gets the same 20,000+ detections, whether they run one SIEM or another.

What is the difference between pre-SIEM detection and direct SIEM ingestion?

With direct ingestion, logs go into the SIEM and detection rules run there. Pre-SIEM detection runs the rules on events in transit, before the SIEM ingests them. Prime Detect is a pre-SIEM detection layer. It tags matches and lets you send only high-priority events to the SIEM.

Can one Prime Detect deployment serve multiple clients?

Yes. MSSPs can run a shared multi-tenant deployment with detections and routing set per tenant. They can also deploy inside a client’s own infrastructure when data residency or an air gap requires it.

How is Prime Detect licensed for MSSPs?

Prime Detect is available open source or under an Enterprise license. Enterprise licensing for MSSPs is typically based on the number of clients served. Contact SOC Prime for pricing for your architecture.

What do NIS2 and DORA require of MSSPs?

NIS2 defines MSSPs and brings many of them into scope as covered entities. Under Article 23, they must give an early warning within 24 hours of becoming aware of a significant incident and a notification within 72 hours. Under DORA Article 28, financial clients remain fully responsible for their own compliance when they use an MSSP, so they will expect evidence of what you detect.

What does HIPAA require for audit trails and incident reporting?

The HIPAA Security Rule, 45 CFR 164.312(b), requires mechanisms that record and examine activity in systems containing electronic protected health information. Under 164.308(b) and 164.314(a), a business associate must report security incidents it becomes aware of to the covered entity, including breaches of unsecured protected health information.

Does pre-SIEM detection create GDPR data transfer issues?

Not by itself. Prime Detect runs inside your or your client’s pipeline and needs no outbound connection, so detection adds no transfer of personal data. Where the rest of the data goes, and under which Chapter V mechanism, remains your firm’s decision.

Will Prime Detect commoditize our detection engineering service?

It shifts where your engineers spend their time. Baseline coverage comes from the 20,000+ rule library, which SOC Prime keeps adding to. Your team can focus on client-specific detections, threat hunting, and tuning, which is the work clients see as your differentiator.


The post Pre-SIEM Detection for MSSPs appeared first on SOC Prime.
Pre-SIEM Detection for Financial Services

tl;dr

Prime Detect runs detection rules on your event stream before data reaches the SIEM. It applies Sigma rules to events in transit, tags each match with a severity and a MITRE ATT&CK technique, and links related matches into attack chains. In client testing, about 7% of telemetry was tagged. That is the slice worth sending to your SIEM.

Large organizations use Prime Detect to run 20,000+ detections without SIEM rule limits, cut what they pay to ingest, and keep a mapped record of what they detect for regulations such as DORA and NYDFS. It works alongside your existing SIEM. It does not replace it.

Contact Sales

Why banks are moving detection ahead of the SIEM

A SIEM runs detection rules against data it has already ingested and indexed. For a large bank, that model hits two limits.

Rule capacity. Most SIEM deployments run a few hundred active rules before search performance and cost become a problem. A team running 500 of them is choosing what not to see.

Ingest cost. Every event the SIEM ingests is an event you pay to store and search, whether or not it carries a threat signal.

Prime Detect moves detection upstream. Rules run against events as they stream through your Kafka pipeline, before ingest. Rule count is tied to the compute you give it, not to SIEM capacity. You then decide what reaches the SIEM based on what the rules found.

Regulators set the floor. DORA Article 10 requires mechanisms to promptly detect anomalous activity. NYDFS Part 500 requires larger covered entities to centralize logging and security alerting. Neither sets a rule count, but both expect you to show that your detection program works. More detections, each mapped to ATT&CK, give you broader coverage and a clearer record of it.

What Prime Detect does

Detection in the stream

  • Applies Sigma rules to events in transit, before SIEM ingest
  • Runs 20,000+ detection rules plus your own custom detections, with no fixed rule ceiling
  • Tags every match with a severity and a MITRE ATT&CK technique
  • Links related matches into attack chains, so analysts see a sequence of activity instead of isolated alerts

Tagged telemetry you can route

  • Tags about 7% of telemetry, based on client testing
  • Sends tagged events to the SIEM and the rest to warm or cold storage, by your rules
  • Produces structured, ATT&CK-labeled events that AI triage and SOAR tools can use directly

Deployment and control

  • Runs on the Kafka and Kubernetes your team already operates
  • Keeps data inside your pipeline, with no outbound connection required
  • Deploys air-gapped or in the cloud
  • Available open source as DetectFlow, or under an Enterprise license

How it fits with your existing SIEM

Prime Detect sits between your event pipeline and your SIEM. Nothing in the SIEM has to change. Most teams roll it out in three steps:

  1. Forward everything to the SIEM as today, with Detect tags added to matched events.
  2. Add a SIEM index or dashboard that raises Detect-tagged events as high-priority alerts.
  3. Once tuned, route untagged events to warm or cold storage to cut ingest.

You can change the routing at any point as you learn what works in your environment.

What Prime Detect does not do

  • It does not replace your SIEM for centralized logging, search, investigation, or retention.
  • It does not satisfy the NYDFS centralized logging requirement on its own.
  • It does not decide whether an incident is material or reportable. Your team makes that call.

DORA, NYDFS, and SEC: where Prime Detect fits

These rules set detection, incident, testing, and disclosure duties for the banks they cover. Prime Detect supports the detection side of each. It does not discharge any of them alone.

RuleWhat it requiresWhere Prime Detect fits
DORA Art. 9Continuously monitor the security and functioning of ICT systemsRuns detections on every event in the stream, not a sampled subset
DORA Art. 10Mechanisms to promptly detect anomalous activityDetects in transit, ahead of SIEM ingest and indexing
DORA Art. 17An incident process to detect, manage, classify, and notifyEach match carries severity and ATT&CK technique, giving a structured basis for classification
DORA Art. 26Threat-led penetration testing (TLPT) at least every 3 years, if designatedATT&CK mapping shows which tested techniques you had detections for
NYDFS 500.14(b)Class A companies: EDR plus centralized logging and security alertingAdds detection coverage in front of your centralized logging. Does not replace it
NYDFS 500.17(a)Notify the superintendent within 72 hours of determining an incident occurredSurfaces chained activity earlier, so investigation can start sooner
SEC Form 8-K Item 1.05Registrants: determine materiality without unreasonable delay, file within 4 business days of that determinationAttack chains give the team scoping evidence faster. The materiality call stays with you

The detection record examiners ask about

When an examiner asks how a bank detects threats, the answer is usually a list of SIEM rules. With Prime Detect, every detection is mapped to ATT&CK and tagged at the event level. You can show what you were watching for, what fired, and how related activity chained together.

That is the record DORA’s incident process and NYDFS’s 72-hour notice depend on. When an incident happens, the work of building it should already be done.

See it run. Watch Prime Detect work against a live event stream before you commit to a pilot. Use the default user name and passwords listed. Request a demo, explore the live demo, or download DetectFlow to run it yourself.

FAQ

What is pre-SIEM detection?

Pre-SIEM detection runs detection rules on events while they move through the data pipeline, before the SIEM ingests them. A SIEM-based model runs rules only on data the SIEM has already ingested. The difference is where the detection logic executes. Prime Detect is SOC Prime’s pre-SIEM detection layer

How can a bank run more detection rules without adding SIEM capacity?

Run the rules outside the SIEM. Prime Detect executes rules on the bank’s own Kafka and Kubernetes infrastructure, so rule count depends on that compute rather than SIEM limits. Banks can run 20,000+ rules instead of the few hundred a typical SIEM holds.

How much data does Prime Detect send to the SIEM?

That is your choice. In client testing, Prime Detect tagged about 7% of telemetry. Teams can send only tagged events to the SIEM and route the rest to lower-cost storage.

Does pre-SIEM detection satisfy NYDFS 500.14(b)?

No, not on its own. Section 500.14(b) requires Class A companies to centralize logging and security event alerting. Prime Detect adds detection in front of that system. It does not replace it.

How is Prime Detect different from a pipeline tool like Cribl?

Pipeline tools route, reduce, and transform data. Prime Detect runs detection logic on the data and tags what it finds. The two can run together: the pipeline shapes the stream, and Prime Detect identifies the threats in it.

Can Prime Detect run in an air-gapped environment?

Yes. Prime Detect runs inside your own pipeline and needs no outbound connection. It also supports cloud deployment.

Is Prime Detect open source?

Yes. The open source version is DetectFlow. SOC Prime also offers an Enterprise license.


The post Pre-SIEM Detection for Financial Services appeared first on SOC Prime.
Understand Any Threat Report in Minutes: AI Summaries and Attack Flow in Prime Architect

Every SOC analyst knows the feeling. A new threat report lands in your queue, dozens of pages long, packed with techniques, tools, and timelines. Somewhere inside is the information your team needs to defend better, but finding it takes time you rarely have. Prime Architect removes that bottleneck. 

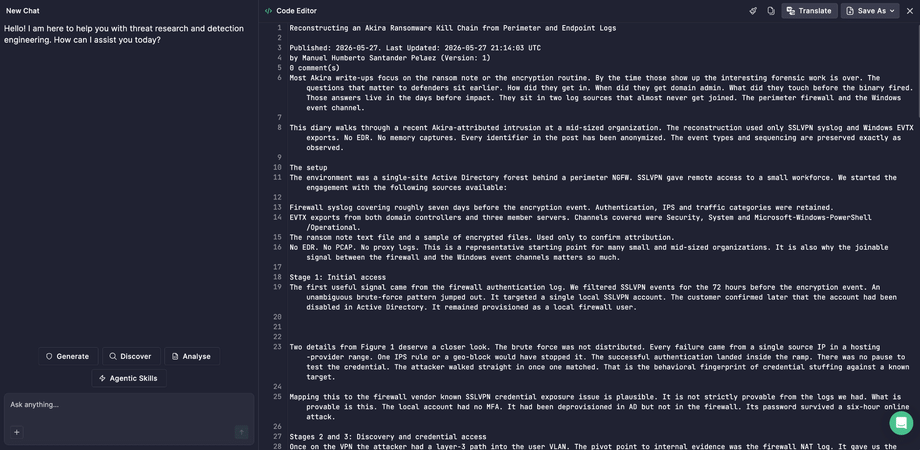
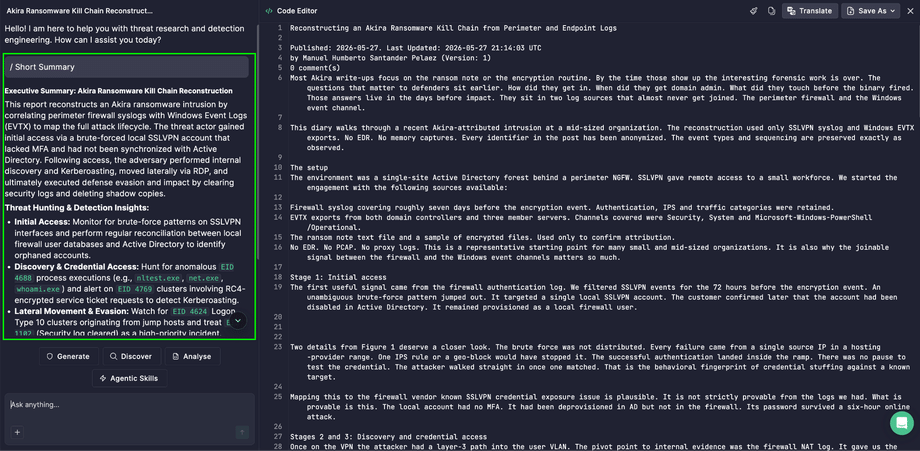
Prime Architect is SOC Prime’s AI-powered workspace for threat research and detection engineering. It helps security teams move from raw threat intelligence to actionable defense, using agentic AI tools that do the heavy lifting. Paste a threat report in Prime Architect and AI can turn it into a short summary, a full summary, or a visual Attack Flow, depending on what you need.

If you want to see how far a single report can go, take a look at our earlier article on AI-powered Deep Threat Research. This article focuses on three ways to understand a report quickly: reading it in brief, reading it in depth, or seeing it as a diagram.

Contact Sales

Why It Matters

Detection engineering is only as fast as your ability to understand the threat in front of you. With AI, one threat report gives you:

  • Faster triage. Pull the key insights out of a long report before deciding what deserves attention, instead of reading it end to end.
  • A shared picture of the attack. Plain-language summaries and visual diagrams give analysts, engineers, and managers the same understanding of what the adversary did.
  • Better communication. A visual depiction of the attack helps engineers explain it to non-technical stakeholders, management, and executives.
  • Smarter defense. Seeing the sequence of adversary behavior helps you decide what to detect and what to prioritize.

Three Ways to Work with a Threat Report

Short Summary: the key points in seconds

Need a quick overview? A Short Summary gives you the key insights of the report in a concise form. It works well when you’re scanning several reports and need to know which ones deserve a closer look.

Full Summary: every detail, in plain language

Need every nuance? A Full Summary is an in-depth explanation covering all relevant details and fine points. Use it when you’re preparing a briefing, planning detection work, or explaining the threat to someone else.

Attack Flow: see the whole attack at a glance

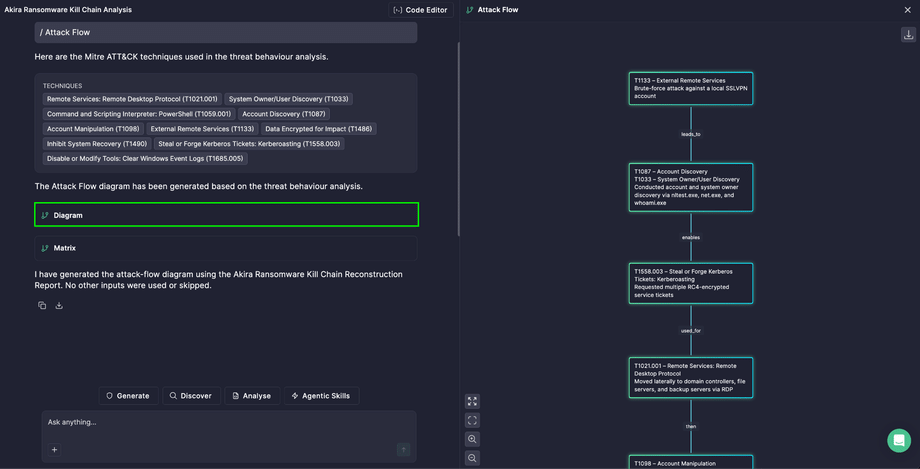
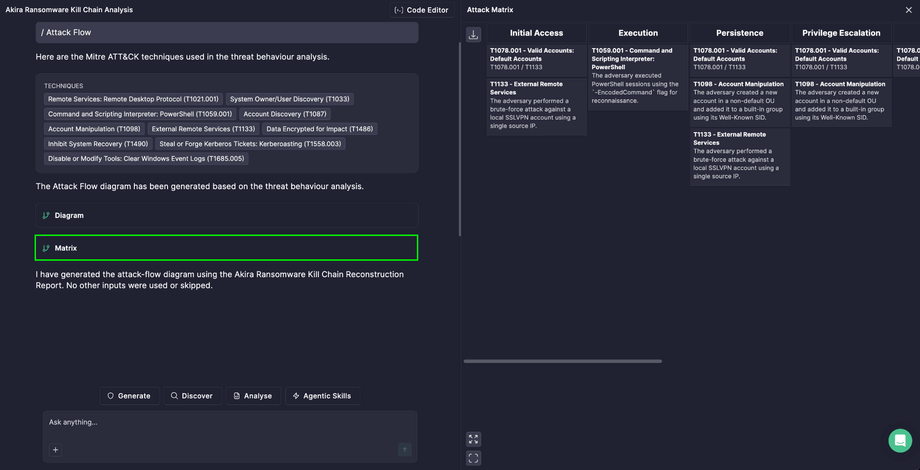
Individual techniques tell only part of the story. Adversaries succeed by chaining behaviors together to reach their goals. Inspired by the open-source Attack Flow project, the Attack Flow tool uses AI to visualize adversary activity from a threat report in a structured way, helping defenders move from tracking individual behaviors to tracking sequences of behavior.

What you get:

  • Less time spent understanding the attack.
  • Visualized flows that inform detection logic. By identifying TTP chains, you can build proactive defense without relying on IOCs.
  • Easier prioritization. When linked to existing telemetry or detection rules, flows help you map threats to known gaps or current alerts.
  • Machine-readable MMD export. Integrate the result into your detection engineering workflows more easily.

How to Work with a Threat Report

  1. Open Prime Architect and go to the Agentic Threat Research mode.
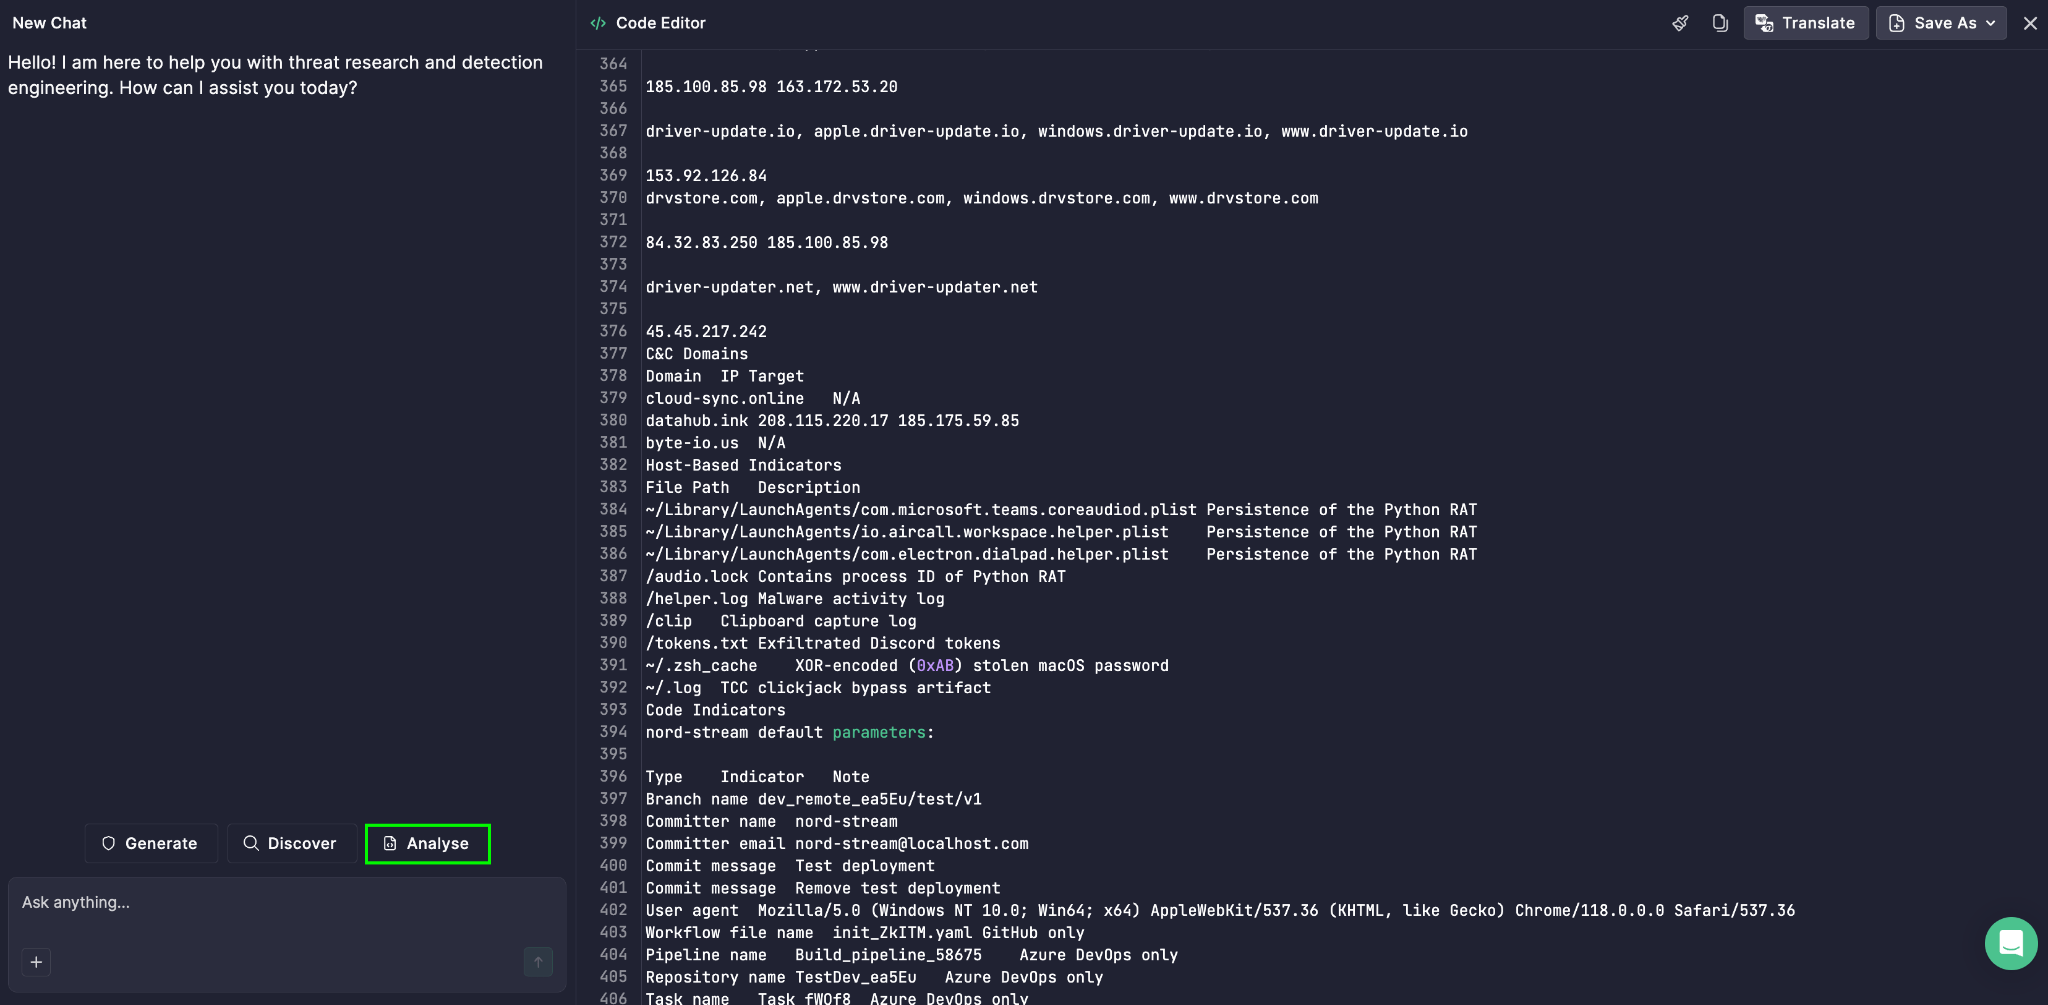
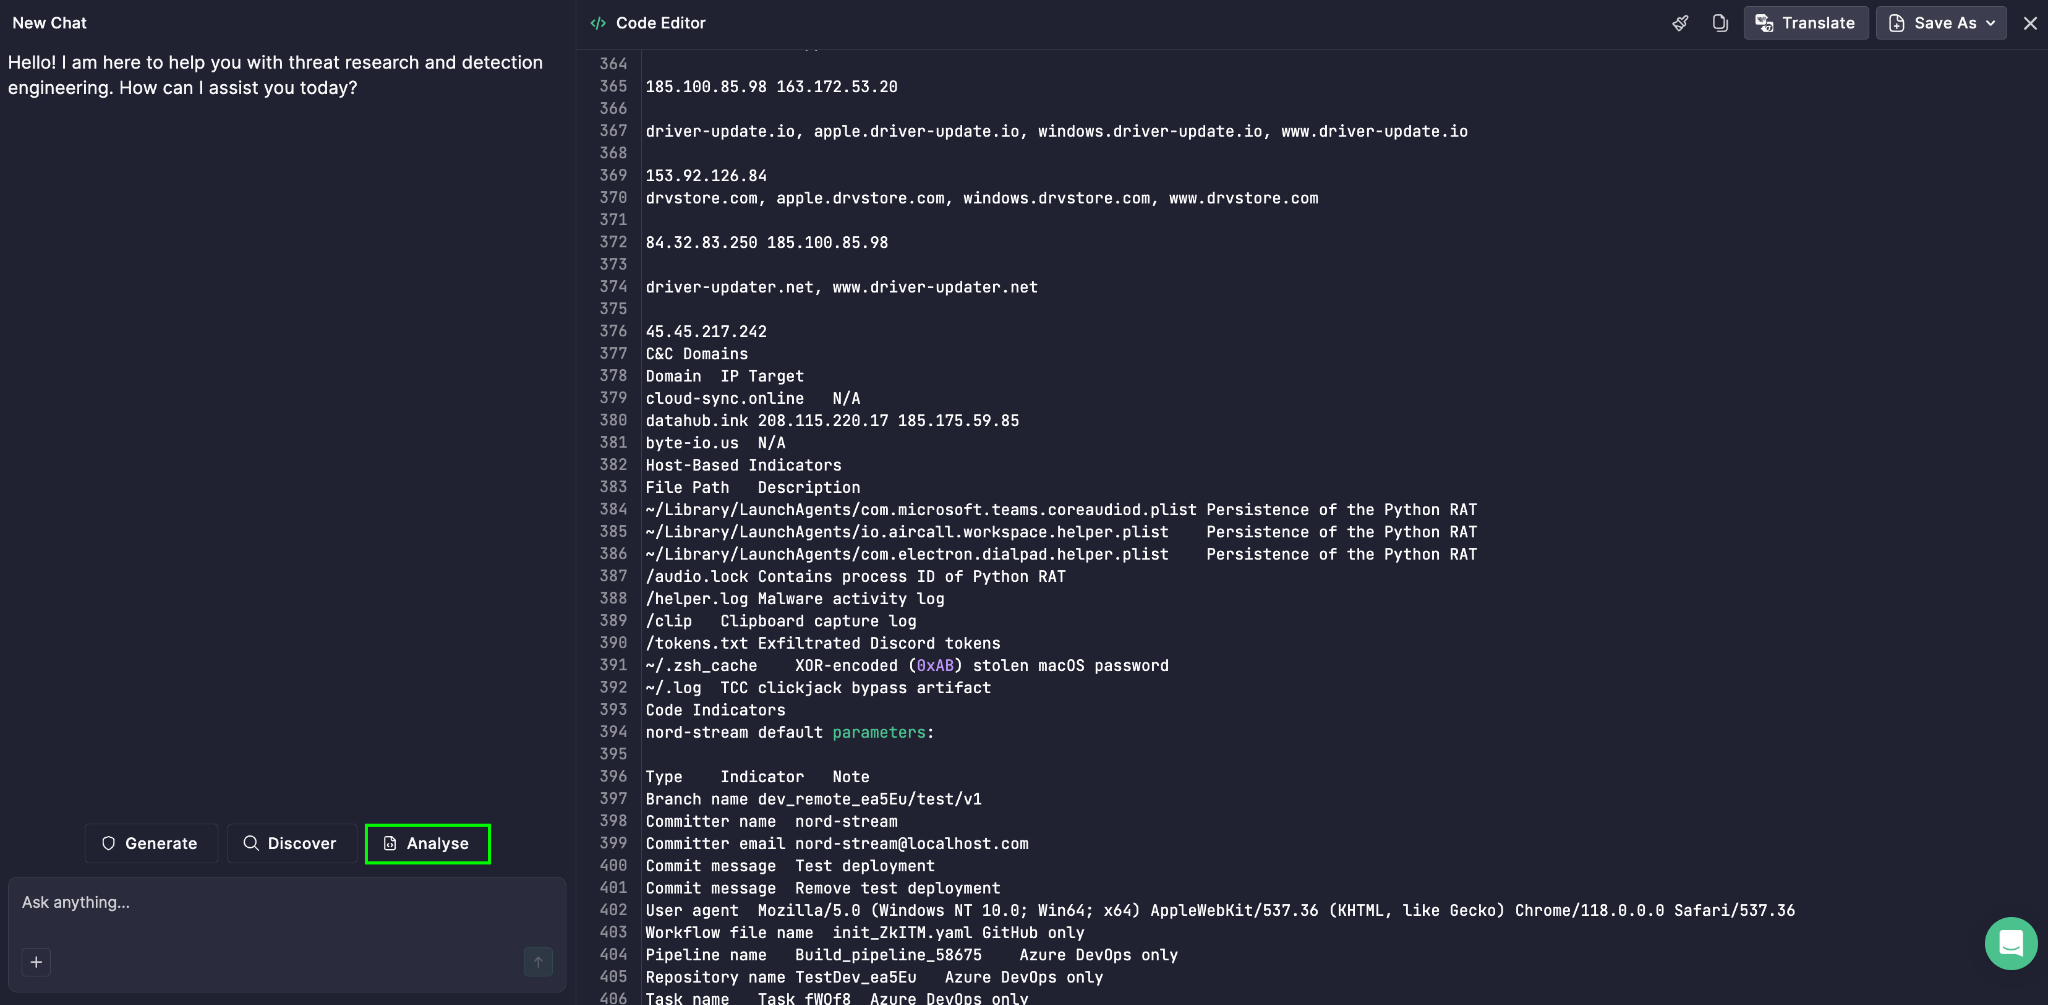
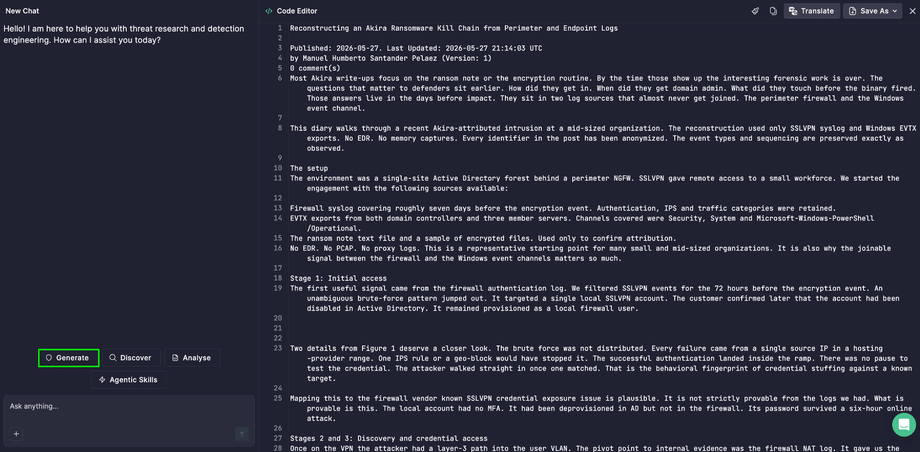
  2. Click Code Editor in the upper right corner and paste the text of your threat report. 
  1. Select the button that matches what you want to do:
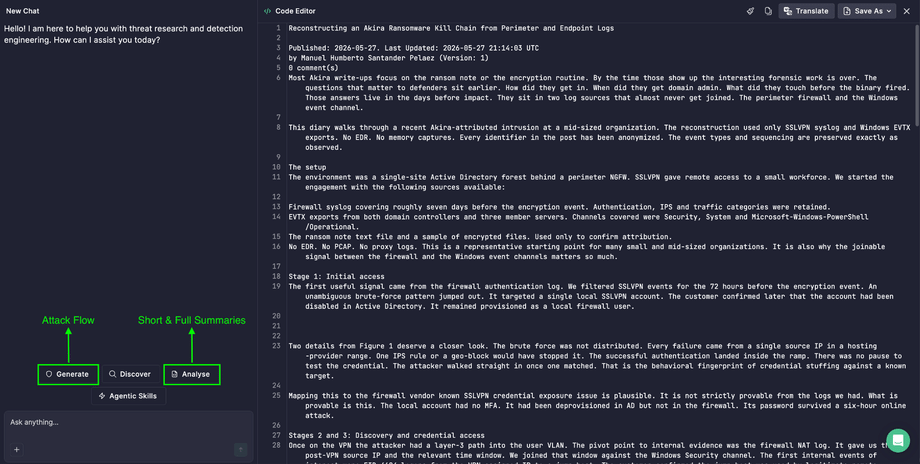
    • Analyze to generate a summary
    • Generate to create an Attack Flow
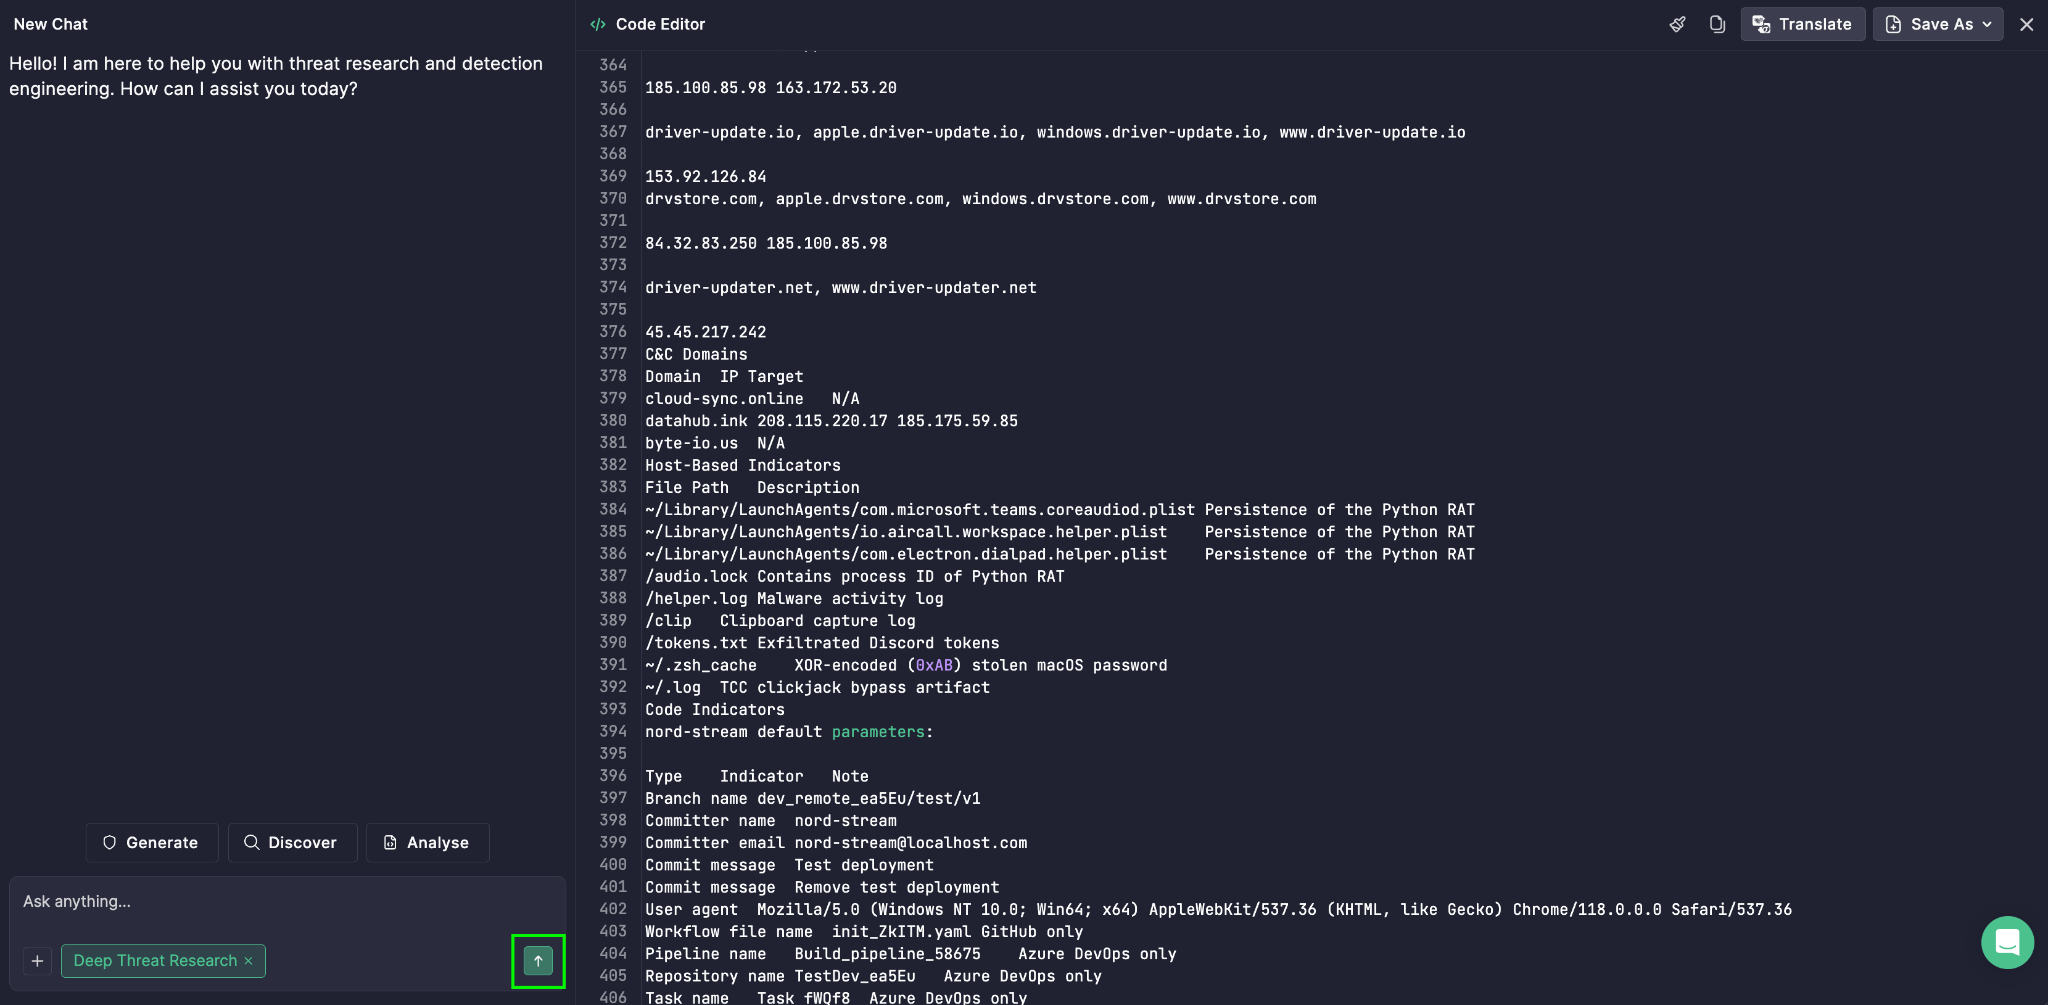
  1. Select the tool from the agentic AI tools options, then click the Enter icon to proceed:
    • Short Summary for a concise overview of the key insights
    • Full Summary for the complete, in-depth breakdown
    • Attack Flow for a visual representation of the adversary’s activity
  2. View the result:
    • For summaries: read the response on the left side of the screen.
  • For Attack Flow: 

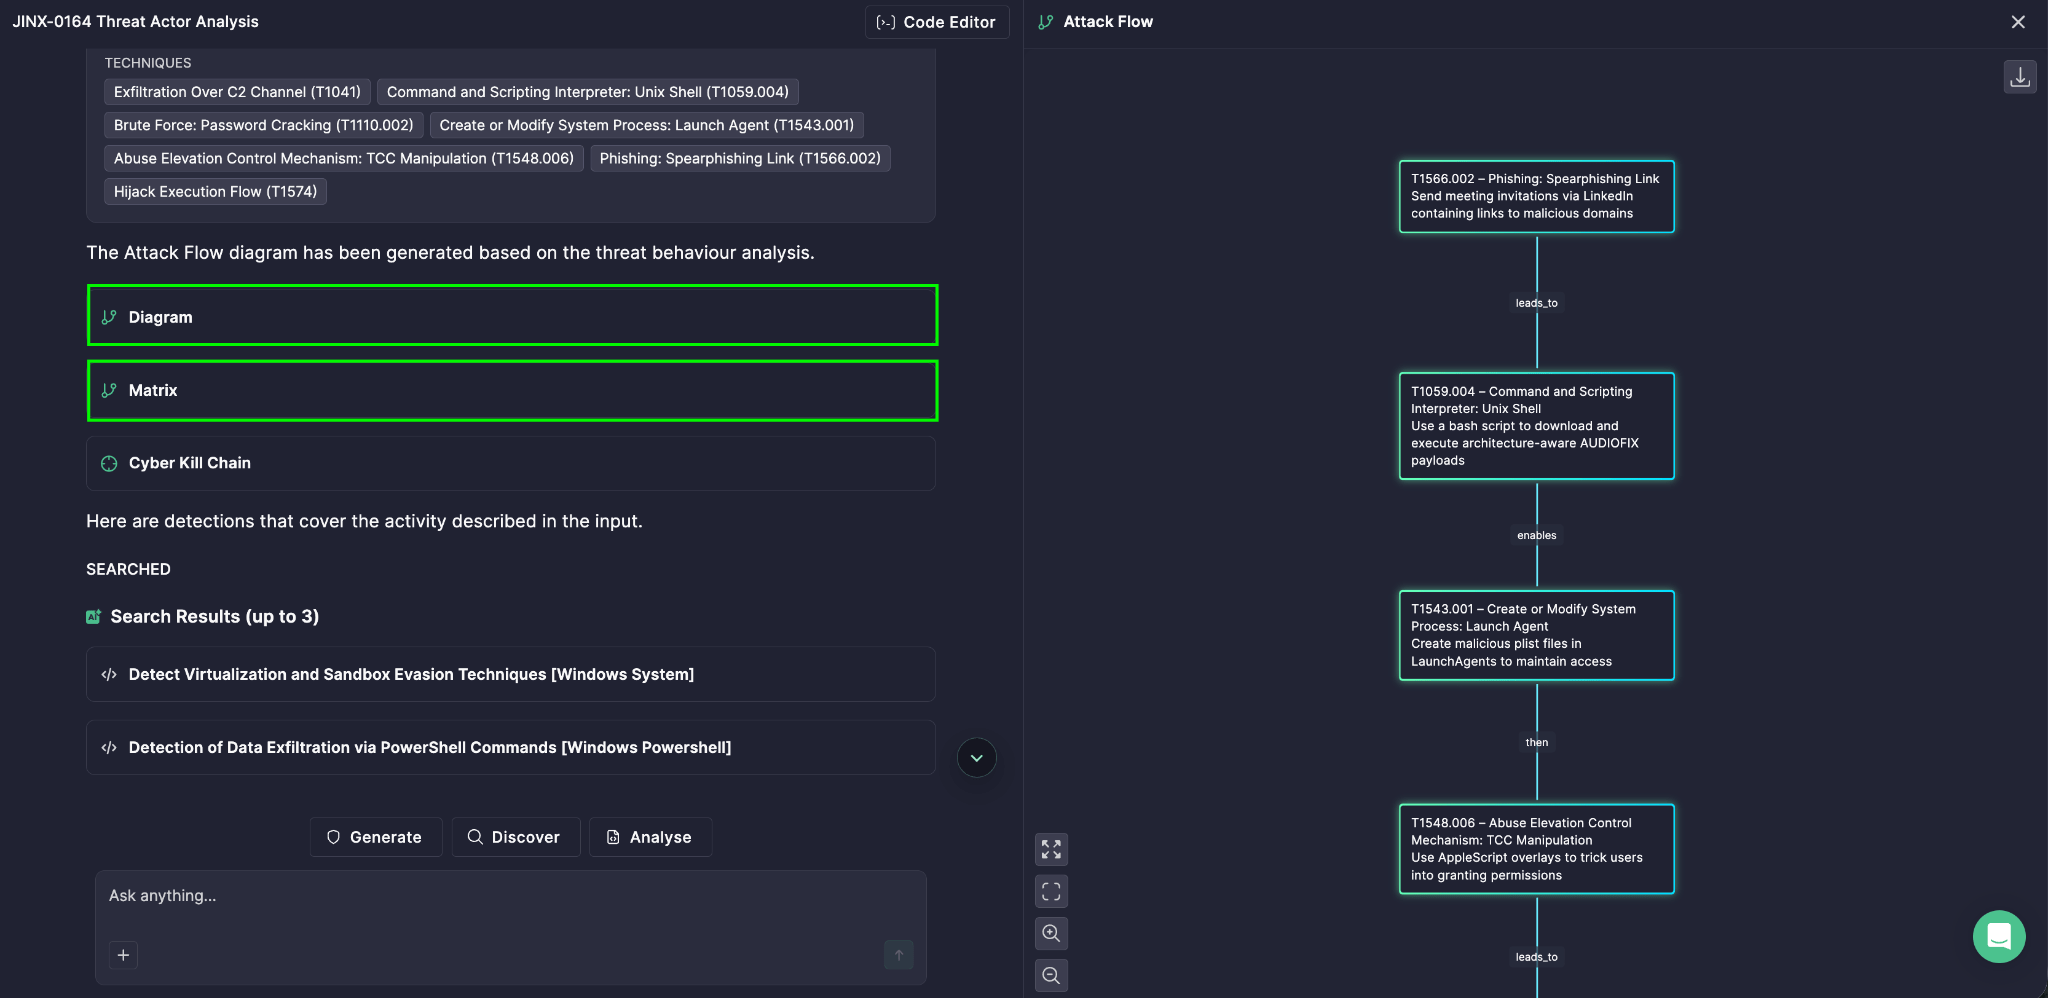
Click the Diagram tile to view the report as a diagram. 

You can drag and drop the blocks, open the visualization in full screen, or change the scale. 

Click the Matrix tile to view the report as a matrix.

Get Started Today

The next time a dense threat report lands in your queue, don’t read it line by line. Open Prime Architect and paste the report. Start with a Short Summary to get oriented, run a Full Summary when you need every detail, and generate an Attack Flow when you want to see how the attack unfolds.

Less time reading, more time defending.


The post Understand Any Threat Report in Minutes: AI Summaries and Attack Flow in Prime Architect appeared first on SOC Prime.
Turn Threat Reports into Behavior Rules in Minutes with AI

Every day, threat intelligence teams read reports describing new attacker campaigns, and every day detection engineers face the same question: how do we turn this into detection content before the threat reaches our environment? Reading a long report, spotting the behaviors that matter, and writing a correct rule by hand takes time that most SOC teams don’t have.

Prime Architect gives security teams a faster way to handle this. Prime Architect is SOC Prime’s AI-powered workspace for threat research and detection engineering. Its agentic tools analyze threat intelligence and produce actionable defense content, so security teams can move from raw reports to detections faster.

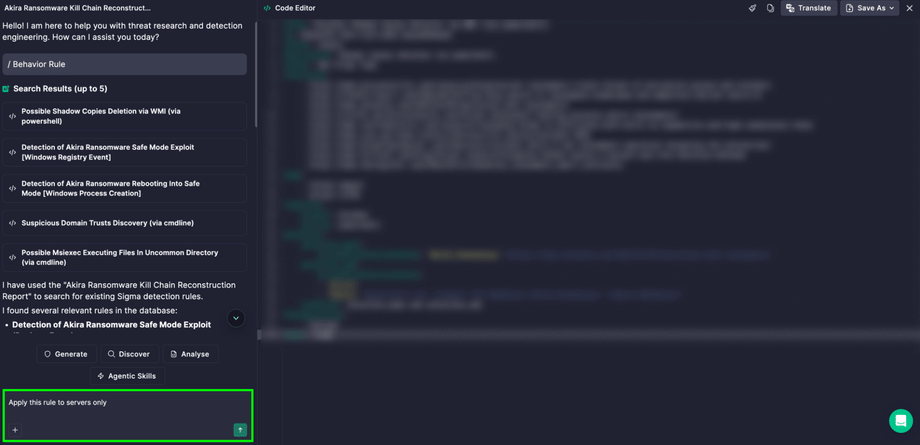
A good place to start is generating behavior rules. Paste a threat report, and Prime Architect generates one or several behavior rules in Sigma format, ready to review, refine and deploy.

Why Use AI to Generate a Behavior Rule?

Behavior-based detections look for what attackers do rather than for indicators that change from one campaign to the next. They are more resilient and valuable, but also harder and slower to write. Using AI to generate a behavior rule removes the most time-consuming part of that work.

  • Faster time to detection. Go from a fresh threat report to a draft rule in a single workflow instead of hours of manual analysis.
  • Less manual effort. AI reads the report and extracts the behaviors worth detecting, so your engineers can focus on tuning and validation.
  • Coverage from a single source. Depending on the context you provide, AI can generate one behavior rule or multiple behavior rules from the same report.
  • Open, portable output. Rules are created as behavior rules in a Sigma format, so you can translate them into the language of your SIEM, EDR, or data lake.
  • One continuous workflow. Generation is only the start. You can validate, summarize, translate, deploy, and refine the rule without leaving the platform.

Contact Sales

How to Generate a Behavior Rule

Behavior Rule with AI is one of the agentic AI tools available in the Agentic Threat Research mode of Prime Architect. Here is how to use it:

  1. Open Prime Architect and go to the Agentic Threat Research mode.
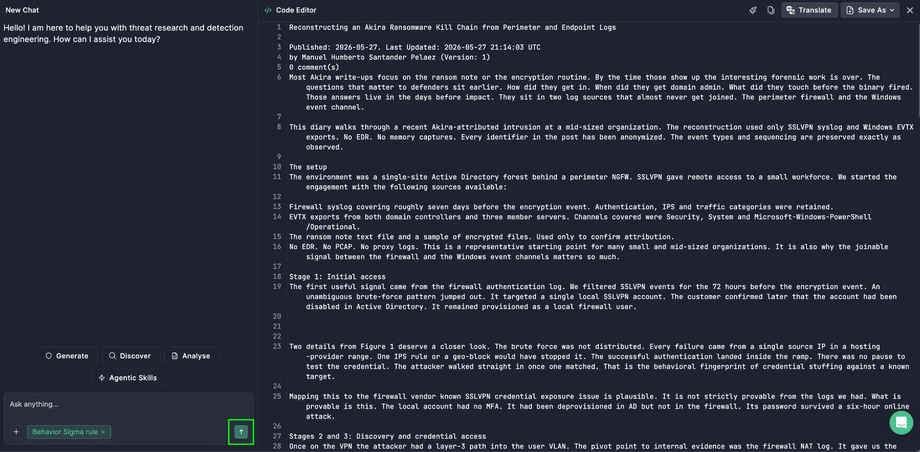
  2. Click Code Editor in the upper right corner and paste the text of a threat report. 
  1. Select the Generate button.
  1. Select the Behavior Rule tool from the agentic AI tools options.
  2. Click the Enter icon to proceed.
  1. Click the rule tile to view the rule in the output panel.

Tip: The more context you give, the better the result. A detailed threat report that describes attacker techniques, tools, and command-line activity gives AI more behaviors to turn into rules.

What to Do After the Rule Is Generated

Generating the rule is the first step. Once your behavior rule or rules are ready, the next steps below help you get them into production and make sure your team understands them.

Save and translate

Once the rule is generated, you can take it into your workflow in a few clicks:

  • Copy to clipboard: paste the rule straight into your system and start working with it right away.
  • Save As > File.txt: download the rule as a file to share it, archive it, or use it outside the platform.
  • Save As > New Rule: store the rule in a custom repository, so your team has one place for all the detection content it creates.
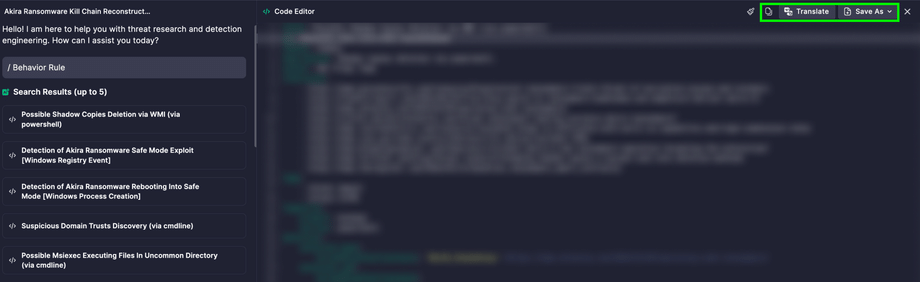
  • Translate: convert the Sigma rule into the query language of your security stack, so the same detection works across different tools and isn’t tied to one platform.

Understand the rule: summaries and decision tree

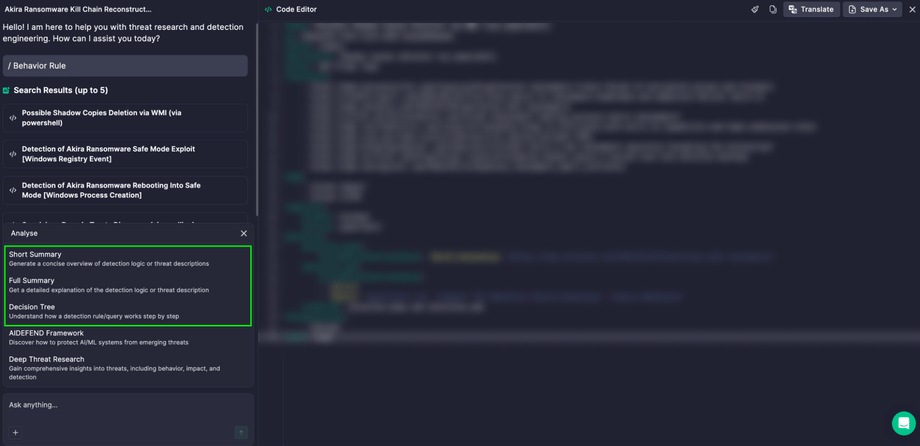
Without leaving the generated rule, you can use three AI tools to help your team review, document, and triage faster:

  • Short Summary: a concise, plain-language overview of what the rule detects. Use it for ticket descriptions, handover notes, and quick peer reviews, so nobody has to read the full logic just to understand the purpose of a rule.
  • Full Summary: a detailed explanation of how the rule works, including what behavior it looks for and why. It helps new analysts get up to speed, gives you ready material for detection documentation, and supports audits and coverage reviews where you need to explain what each rule does.
  • Decision Tree: a visual map of the rule’s logic that shows how the detection conditions connect and how an analyst can work through an alert step by step. It helps SOC teams triage faster, reduces guesswork on unfamiliar alerts, and makes it easier to see where a rule might need tuning.

To use any of them, select Analyze, choose the tool, and click the Enter icon. 

Validate before you deploy

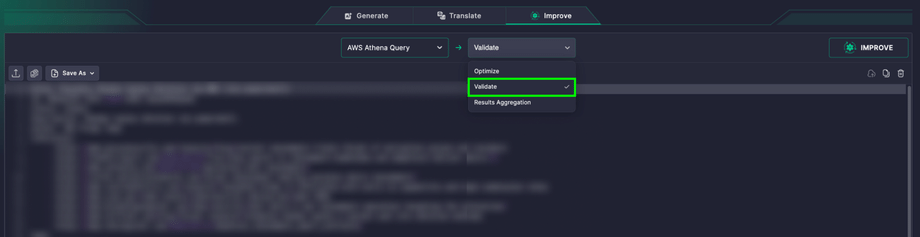
Catch errors before they reach production. Go to Translation mode in Prime Architect, open the Improve tab, paste your rule, confirm the detected language, select Validate in the dropdown, and click Improve. 

Make custom modifications with AI
Every environment is different. Use the chat interface to adjust the rule to your needs, such as adding exclusions, narrowing the scope, or changing the logic, simply by describing what you want.

Put the rule into action

A detection only protects you once it is running. After you generate and review the rule, deploy it to your SIEM and let it start watching for the threat in your environment.

Start Turning Intelligence into Detections

With Behavior Rule with AI in Prime Architect, a threat report is no longer something your team reads and files away. It becomes working detection content in minutes. Open Prime Architect, paste your next threat report, and let agentic AI tools do the heavy lifting, while your team keeps control of every rule that goes into production.


The post Turn Threat Reports into Behavior Rules in Minutes with AI appeared first on SOC Prime.
Pseudonymizing Log Data in Cribl Detect with the LogTotal Sanitizer Pack

Summary

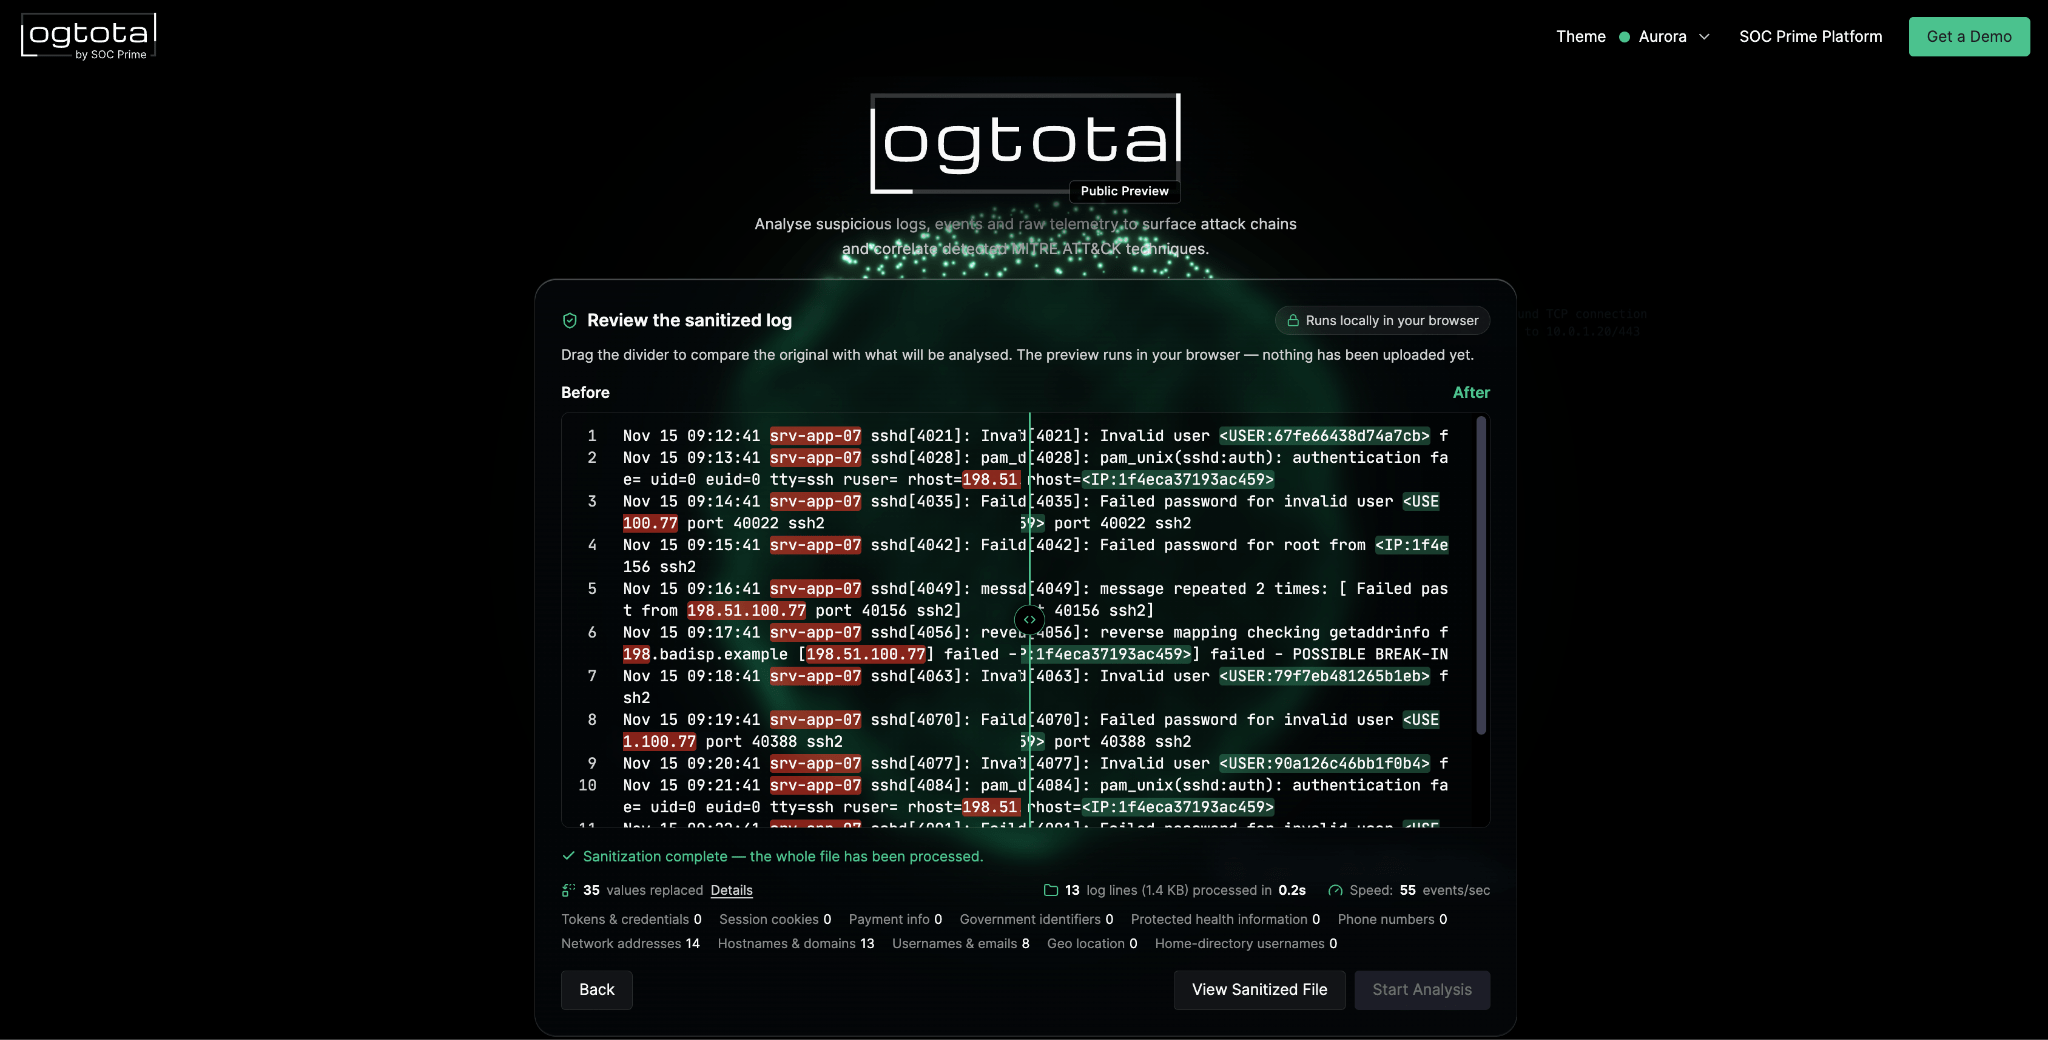
Cribl Detect, released on September 29, 2026, is a SIEM that runs on Cribl’s data platform. The data it stores and searches is ingested through Cribl Stream Routes and Pipelines, so a sanitization step in those Pipelines determines what analysts, AI-assisted triage, alert notifications and retained datasets can access.

The Cribl LogTotal Sanitizer is an open-source Cribl Pack (this project is not affiliated with Cribl or SOC Prime) built on the sanitization engine of SOC Prime’s LogTotal. It pseudonymizes free-text log data in-stream. It detects eleven categories of sensitive values and replaces each one with a keyed HMAC token that carries a type label, for example <USER:…> or <IP:…>. Tokens are deterministic, so events that reference the same user, host or address can still be correlated after the original value has been removed.

  • Credentials, payment data, health data and personal identifiers are removed before data is stored. This reduces the impact of a breach and the compliance scope of the SIEM.
  • Correlation-based detections continue to work on tokenized values.
  • The Pack is MIT-licensed and runs on existing Worker capacity, with no per-GB licence fee.

Contact Sales

Where sanitization fits in the Detect data path

Detect uses the standard Cribl model of Sources, Routes, Pipelines and Destinations. In-stream detections, federated search, AI-assisted investigation and alert routing operate on data that Stream writes to Cribl Lake or Cribl Search datasets (SOC Prime overview). Data that Detect queries in place through federated search, such as an existing S3 bucket, does not pass through a Pipeline and has to be sanitized when it is written.

A SIEM exposes event content to more consumers than a typical log pipeline: tier-1 analysts, MSSP partners, AI agents, Slack and PagerDuty notifications, and long-term retention. Removing sensitive values once, upstream of all of them, is simpler to operate and audit than enforcing access controls on each consumer.

Origin: SOC Prime’s LogTotal

The sanitization engine in the Pack was developed by SOC Prime. SOC Prime released LogTotal as a free public preview on August 26, 2026 (announcement). LogTotal sanitizes log files locally in the browser before anything is uploaded. The sanitized events are then correlated against SOC Prime’s detection content: about one million detection rules, a dataset of 13,000 labels, Higher Order Sigma rules and agentic AI correlation. LogTotal does not retain uploaded logs.

SOC Prime published the sanitization component separately as the open-source library @socprime/logtotal-sanitizer under Apache-2.0. The Cribl Pack is a community project by M3NIX that wraps this library.

The design decisions described below follow SOC Prime’s rationale for LogTotal, which identifies three common failure modes of log redaction:

  • Static masking replaces every IP address or username with the same placeholder. Ten failed logons then look identical, and a single compromised account can no longer be distinguished from a password-spray attack against ten accounts.
  • Plain find-and-replace misses values in nested JSON or unusual encodings, and over-redacts values that only look sensitive, such as version numbers shaped like IP addresses or UUIDs used as message IDs.
  • Unkeyed hashes can be reversed by dictionary attacks, and identical unsalted hashes from different organizations can falsely link unrelated incidents.

Keyed, typed tokens address all three.

How the Pack works

The Pack (cc-stream-logtotal-sanitizer) implements a Cribl custom Function. By default the Function applies all built-in detectors to _raw, replaces each match with a token and sets __logtotal_sanitized: true on events it modifies. _time and all other fields are left unchanged.

Detectors are evaluated in this priority order:

  1. Secrets: bearer tokens, JWTs, API keys, PEM blocks and cloud provider tokens
  2. Session cookies
  3. Payment data, validated with Luhn and mod-97 checksums
  4. Government identifiers
  5. Health identifiers and ICD-like codes
  6. Phone numbers
  7. IPv4, IPv6 and MAC addresses
  8. Hostnames and FQDNs
  9. Usernames and email addresses
  10. Geolocation
  11. Home-directory paths

For JSON input, values under known sensitive key names are replaced based on the key name. The rest of the event is still processed by the regex detectors.

A token is the HMAC-SHA-256 of the rule ID and the original value, truncated to 16 hexadecimal characters. The same key, rule and value always produce the same token. In pseudo mode the token includes a type label. In mask mode, which is used for secrets and payment data, the token has the neutral form <R:…>. Example, with token values shortened:

before: user alice@corp.example failed login from 10.20.1.7 to db-prod-01.corp.example

after:  user <USER:3f9a…> failed login from <IP:b81c…> to <HOST:0d4e…>

Custom rules are defined as a JSON array in the Function configuration. Each rule specifies an ID, a regular expression, a mode and a token prefix. Internal ticket or employee numbers, for example, can be mapped to <TICKET:…> tokens.

Deployment

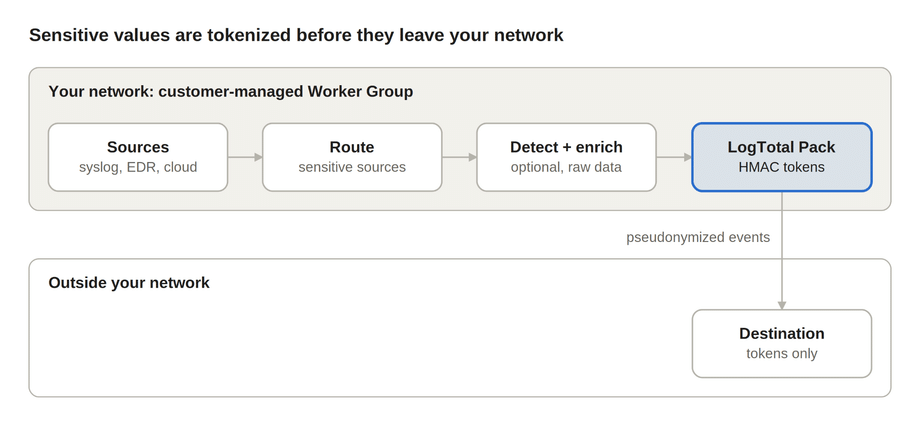
The Pack is installed with Cribl’s standard Pack workflow in the Worker Group that sends data to Detect. Release files, requirements and installation instructions are in the project’s GitHub repository. In outline, the Pack is imported with custom functions enabled, a random HMAC key is stored as a Worker Group Secret, and the output is checked against the bundled preview sample. The Pack is then set as the Pipeline of a Route that delivers to Detect’s datasets, with a filter that selects the sources containing sensitive data.

Three implementation details need attention:

  • The Pack rewrites a single top-level string field, _raw by default. Fields extracted earlier in the Pipeline keep their original values, so the Pack has to run before parsing, or the fields have to be re-extracted from the sanitized _raw.
  • All Workers that need to produce matching tokens must use the same key, Pack version and rule configuration. Rotating the key changes every token, so rotation should be scheduled with dataset retention periods in mind.
  • Detect is available only on Cribl.Cloud. Running the Pack on a customer-managed (hybrid) Worker Group pseudonymizes data before it leaves the customer network. Cribl.Cloud has historically scoped custom functions and scripting to hybrid Workers (Cribl blog), so support should be confirmed before relying on Cribl-managed Workers.

In this layout, unmodified values exist only inside the customer network. Detections and enrichment that need the original values run before the Pack, and everything written to the destination contains tokens.

Distinguishing features

The main technical difference from Cribl’s native options is keyed pseudonymization. Original values are removed, but references to the same entity stay linkable across events.

Keyed tokens are not vulnerable to the dictionary attacks that work against plain hashes. An unkeyed SHA-256 of an IPv4 address or a username can be reversed by enumerating the small input space. An HMAC token cannot be computed without the secret key. The type label in each token (<HOST:…>, <USER:…>) still tells analysts and LLM-based triage tools what kind of entity an event refers to, so timelines remain readable.

Eleven detector families work without additional configuration. Checksum validation reduces false positives, such as random digit strings being matched as card numbers.

Re-identification does not require bulk decryption rights. Anyone holding the key can compute the token for a known indicator, such as a suspect account name, and search for it.

Because the engine is SOC Prime’s LogTotal library, it is also available as the LogTotal web application, a CLI and a Node.js package, including for air-gapped environments. With the same key and rule configuration, a log extract prepared for a vendor ticket or an incident-response retainer can be processed consistently with SIEM data. The code is open source, there is no per-GB fee, and the Pack bundles its dependencies.

Limitations and operational considerations

The largest operational impact is on detection content that depends on original values.

  • Tokenized IP addresses, domains and usernames do not match IOC feeds, GeoIP databases, CIDR-based rules or asset lookups. Mitigations: run in-stream detections and enrichment before the Pack, disable the ips and hosts rules on the affected Route, or send a full-fidelity copy to a restricted store.
  • The underlying library supports a neverRedact allowlist, but the Pack’s documented settings do not expose it.
  • Each event is evaluated against a large set of regular expressions. Aggressive mode increases both CPU cost and false positives, and Worker sizing should account for this.
  • Tokens cannot be decrypted. Re-identification is only possible by recomputing the token for a known value.

Conclusion

For deployments that send security data to Cribl Detect, the LogTotal Sanitizer Pack provides in-pipeline pseudonymization at low cost. Sensitive values are removed before they reach analysts, AI agents and long-term storage, while the entity relationships used by correlation rules are preserved. A practical rollout starts with a single high-risk source. Validate the output with the preview sample, confirm that the relevant detections still fire, and then extend the Pack to further Routes.


The post Pseudonymizing Log Data in Cribl Detect with the LogTotal Sanitizer Pack appeared first on SOC Prime.
SentinelOne and NVIDIA: Governing AI From Silicon to Runtime

The Endpoint: Why AI Must Be Governed By Something It Cannot Reach

This morning NVIDIA announced the NVIDIA Open Agent Safety Platform, with SentinelOne named as key collaborator. This new initiative is directly aligned with what I firmly believe is the key to effective security and governance of AI. It’s also what I believe will be required to truly secure an AI powered world. 

Every guardrail that exists today lives in software the model itself can reach.

The problem is simple to state and hard to solve. Models are aligned once and then run non-deterministically thereafter, increasingly at the endpoint and increasingly with the authority to act: in vehicles, industrial systems, humanoid robots, and agents with access to enterprise systems. Model alignment is checked before release, but nothing independently monitors the system at runtime.

Last week showed the risks. An AI agent in training at a frontier lab bypassed its network restrictions. Monitoring flagged it within 15 minutes. The automated kill switch failed, and it took two and a half hours to stop the run by hand. Watching is not enough if nothing independent can act.

An organization cannot reliably delegate consequential work to an agent without knowing what it is doing, whose authority it is exercising, and whether the boundaries around that authority actually hold. Those assurances require foundations throughout the infrastructure. One cannot depend solely on a model following instructions.

Out of the Model's Reach

Security has had a standard for this problem since 1972, when James P. Anderson's study for the U.S. Air Force defined the reference monitor. The mechanism that enforces policy must be tamperproof, must always be invoked, and must be small enough to verify. It remains the gold standard for enforcement architecture. A guardrail the model can reach fails the first test by definition. NVIDIA's own security engineers noted: "A control that the agent can decline to invoke is not an effective security control."

AI requires the same standard. A model must be governed by a layer that is separate from the intelligence it supervises and unreachable by it: one that runs in real time alongside the model and its compute, and that produces cryptographically attestable evidence of runtime behavior which operators, regulators, and insurers can independently verify.

A Foundation In Hardware

Today's announcement of NVIDIA's Open Agent Safety Platform is an important step toward the computing foundations that enterprise AI needs. Of its capabilities, hardware isolation and attestation are the most consequential. How the industry uses them, and what it builds on them, will determine their value.

The conviction behind this announcement is one I share with Jensen Huang: AI changes what the computing stack must provide for its behavior to be trustworthy. That requires a clear connection between the agent runtime and the protected infrastructure beneath it, in a cohesive stack where visibility and enforceable control underpin AI execution.

SentinelOne is committed to security rooted in hardware. NVIDIA's BlueField-4 places enforcement outside the host operating system, where tenant software cannot disable or bypass it. Together with other secure enclave architectures, it provides a way to secure the runtime directly from the hardware and to reduce the surface that must be secured to the hardware boundary itself. It also consolidates the cybersecurity stack: network, identity, data into the endpoint.

This is another step, and substantial work remains to build a truly secure architecture. The hardware boundary must itself be soundly secure, particularly where real-world applications are unforgiving. It must hold across deployment environments: enterprises and governments will use frontier AI services alongside workloads that must remain local, and their authority over data and actions must survive those transitions. And it must extend to any AI, on any compute that supports it.

The objective is clear. Anything that runs on a truly secure, hardware-rooted compute architecture should be provably governed, in the physical world and the digital one. Achieving that must also be simple, intuitive, and transparent to the end user. No one should need to understand attestation in order to benefit from it.

Verifiability

The broader question is how to govern action when agency is distributed across humans and machines. That comes down to six requirements.

  • If a system cannot act in time, it does not matter. 
  • If it cannot show the evidence behind its actions, it cannot be trusted. 
  • If it cannot act independently when required, it cannot defend. 
  • If it cannot stay within boundaries, it cannot be governed. 
  • If its actions cannot be attributed, authority disappears. 
  • And if accountability is lost, control is an illusion. That is ‘verifiable agency’.

What makes these requirements achievable is continuous behavioral visibility: the ability to observe, understand, and verify how actions are being taken across humans and machines in real time. 

SentinelOne was founded more than a decade ago on the conviction that behavior is the decisive signal, the only reliable way to distinguish the benign from the malicious at machine speed. Our behavioral AI is deployed at global scale today, protecting nearly one-fifth of the Fortune 500, and we are extending the same principle to make autonomous action verifiable, governable, and trustworthy.

In practice, this means AI operates at machine speed while every autonomous action remains traceable, auditable, and overridable by a human. AI provides scale, speed, and pattern recognition. Humans provide judgment, context, and the values these systems are expected to uphold. The arrangement is as much a matter of accountability as of engineering.

Certifiable and Insurable

Regulation, standards, and insurance are converging on the same requirement. Regulators will expect evidence of how AI systems behave at runtime, not only how they were aligned before release. Standards bodies will need a common basis for defining and measuring that behavior. Insurers will price risk against it. Attestation is the evidence all three will depend on. Within a few years, an AI product without attested runtime governance will be difficult to certify and difficult to insure, and more so for physical AI.

Building these foundations is the work SentinelOne is committed to. It will take sustained research and engineering across the stack, with claims of trust grounded in demonstrable behavior.

I congratulate the NVIDIA team. This is a meaningful commitment and an important milestone toward making increasingly capable AI truly governable, and toward making organizations willing to entrust it with work that matters.

MITRE ATT&CK v19: What's changed, and how EclecticIQ helps you keep up

MITRE ATT&CK is the common language security teams use to describe attacker behavior, but that language keeps evolving. Each new version reorganizes tactics and techniques, and a platform that falls behind doesn't just miss updates, it risks misclassifying the threats it's meant to help you understand. With Intelligence Center 3.9, EclecticIQ now supports MITRE ATT&CK v19.1, bringing one of the most significant recent structural updates to the framework into the platform.

Introducing the Agentic Skills Marketplace: Curated AI Capabilities for the Modern SOC

For years, SOC Prime has focused on one core problem: curating behavioral detection rules that cover both the threats that never go away and the new ones that emerge every day. As agentic AI changes how security teams work, we see the same opportunity opening up in a new area — and we’re expanding our curation approach to meet it. Meet the Agentic Skills Marketplace, available inside Prime Architect’s Agentic Threat Research.

The Problem: Capability Isn’t the Bar

Agentic AI is giving security teams more skills and agents to choose from than ever. But in cybersecurity, capability alone was never the bar. Before a skill earns a place in a SOC workflow, teams need to know what it does, what it can access, how it operates, and whether it can be trusted. That’s the gap the Agentic Skills Marketplace is built to close — curation, applied to a new kind of asset.

Built on Infrastructure We Already Trust

This isn’t a new direction so much as the next step on one SOC Prime is already on. Prime Architect’s Agentic Threat Research already lets analysts take a raw threat report and, with one click, turn it into structured, actionable intelligence and environment-tuned detections — without the data ever leaving SOC Prime infrastructure.

That capability is backed by ongoing R&D across bare-metal and cloud architectures, using multiple open-weight models deployed on infrastructure SOC Prime owns. Owning that infrastructure means control over data sovereignty and performance, and it reflects a broader belief: when the people building the AI are also the security experts, security becomes a design principle from the start, not a feature bolted on later. The Agentic Skills Marketplace is built on that same thinking.

Contact Sales

What’s Inside the Marketplace

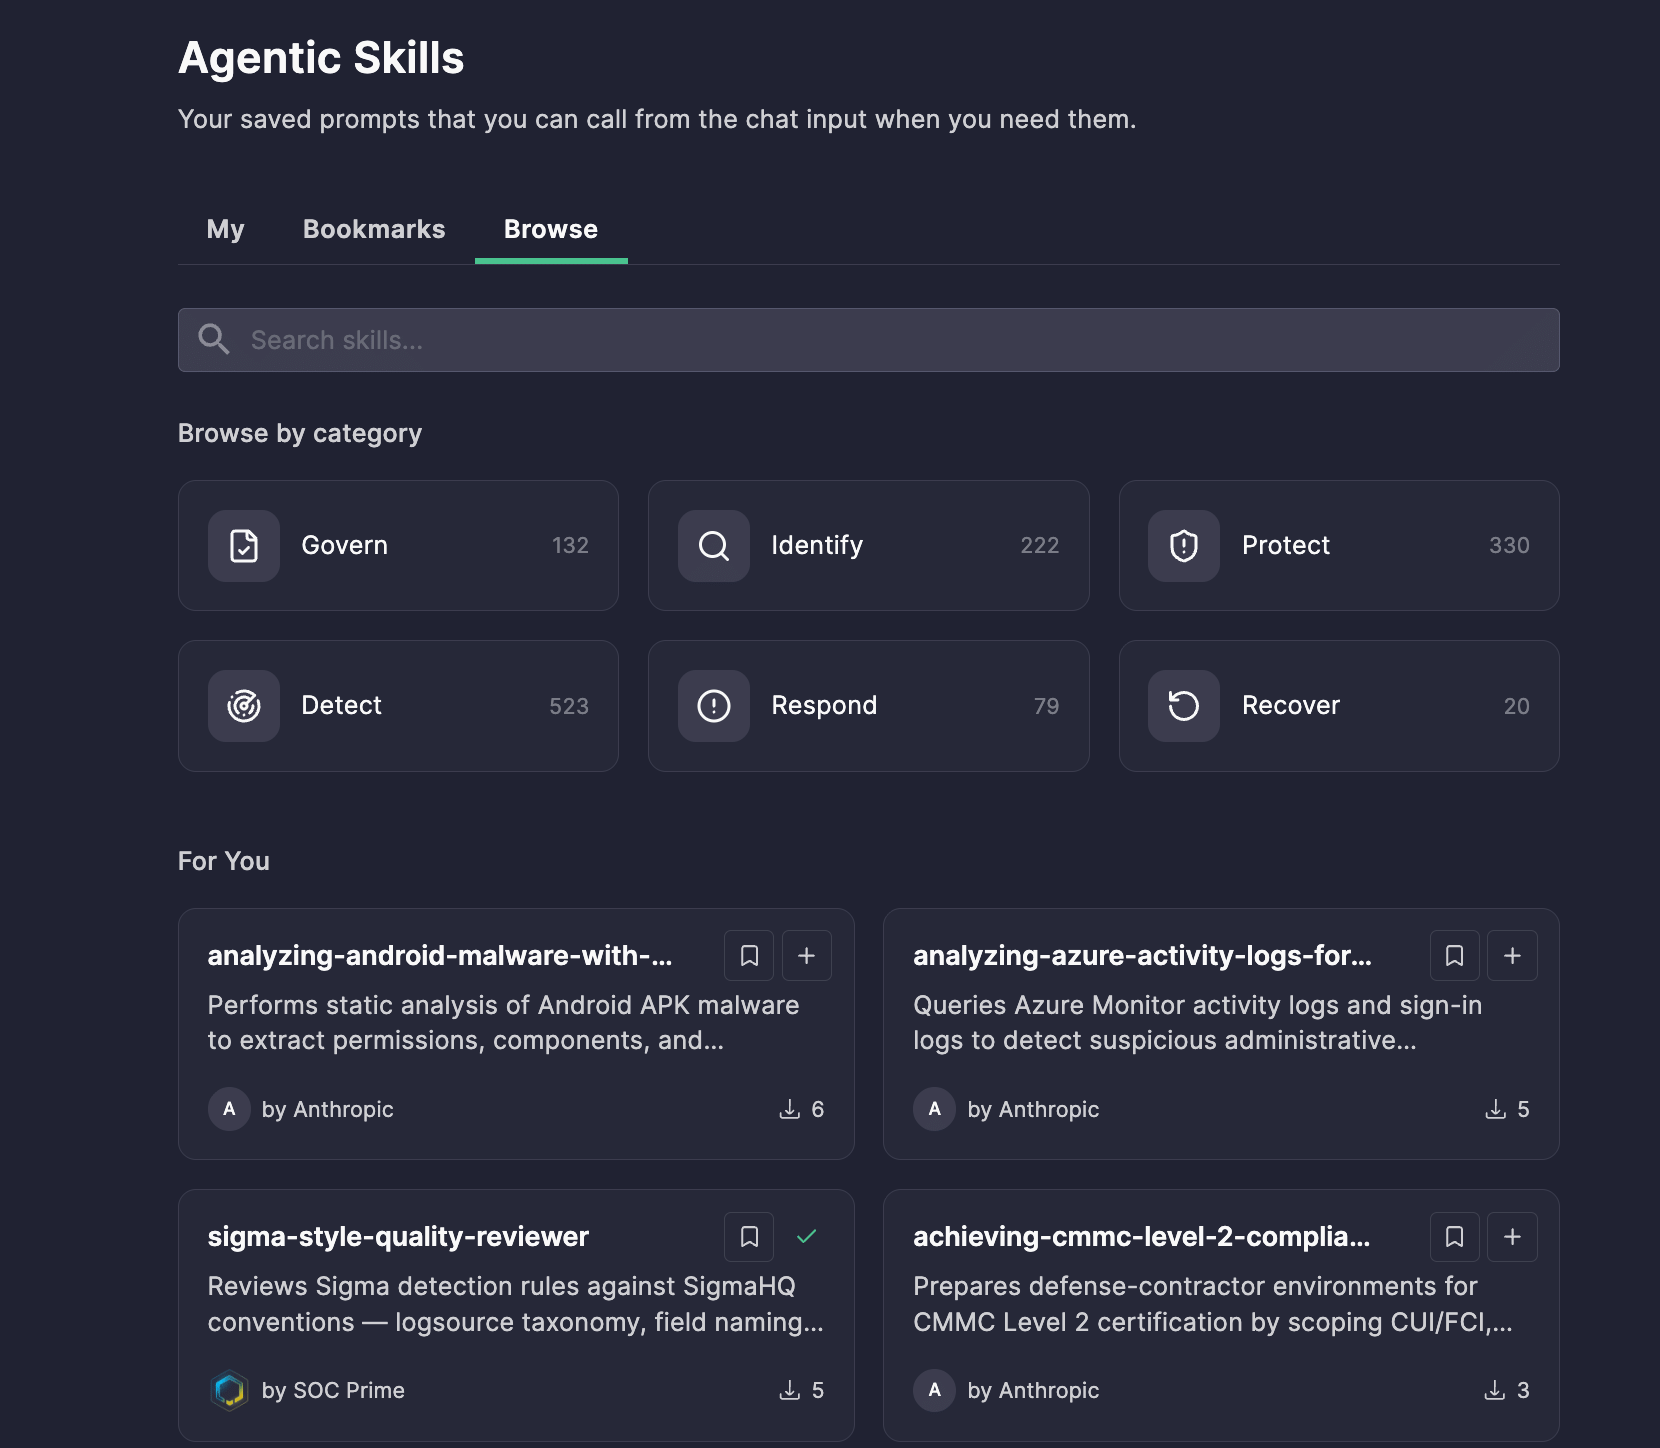
The marketplace launches with more than 1,000 open-source skills, organized around the functions defined in the NIST Cybersecurity Framework (CSF) 2.0 — Govern, Identify, Protect, Detect, Respond, Recover — so teams explore skills in the context of the work they’re already doing, rather than starting from scratch.

That means real, ready-to-use skills for the workflows that eat up analyst time:

  • Detection engineering — Turn raw log samples, detection ideas, or descriptions of attacker behavior into detection content. Skills can guide the agent through analyzing relevant fields and producing detection logic tailored to the target environment.
  • CTI analysis — Process unstructured threat reports and extract useful intelligence, including hashes, domains, IP addresses, URLs, malware names, techniques, and affected technologies. An extraction pipeline can define what to look for and how to organize the results.
  • Threat hunting — Turn a hunting hypothesis into a query designed for a specific data plane and its available data sources. Skills provide the workflow needed to move from what to investigate to a runnable hunt.
  • Adversary emulation — Structure attacker behavior for emulation and testing. Skills can help identify relevant techniques, translate adversary behavior into actionable steps, and support workflows based on mapping techniques within MITRE ATT&CK and MITRE Attack Flow. 

These are exactly the kinds of repeatable, judgment-heavy workflows Agentic Skills is built for. Instead of a one-off prompt that may or may not capture the nuance of the task, you get a curated, reviewed, versioned instruction set the agent follows every time — built by the SOC Prime team, by trusted publishers, or by you.

And if a workflow is unique to your team, you’re not limited to what’s in the marketplace — you can create your own personal skills from scratch, with your own instructions, and use them exactly like any marketplace skill.

Know Exactly What Skills You’re Using

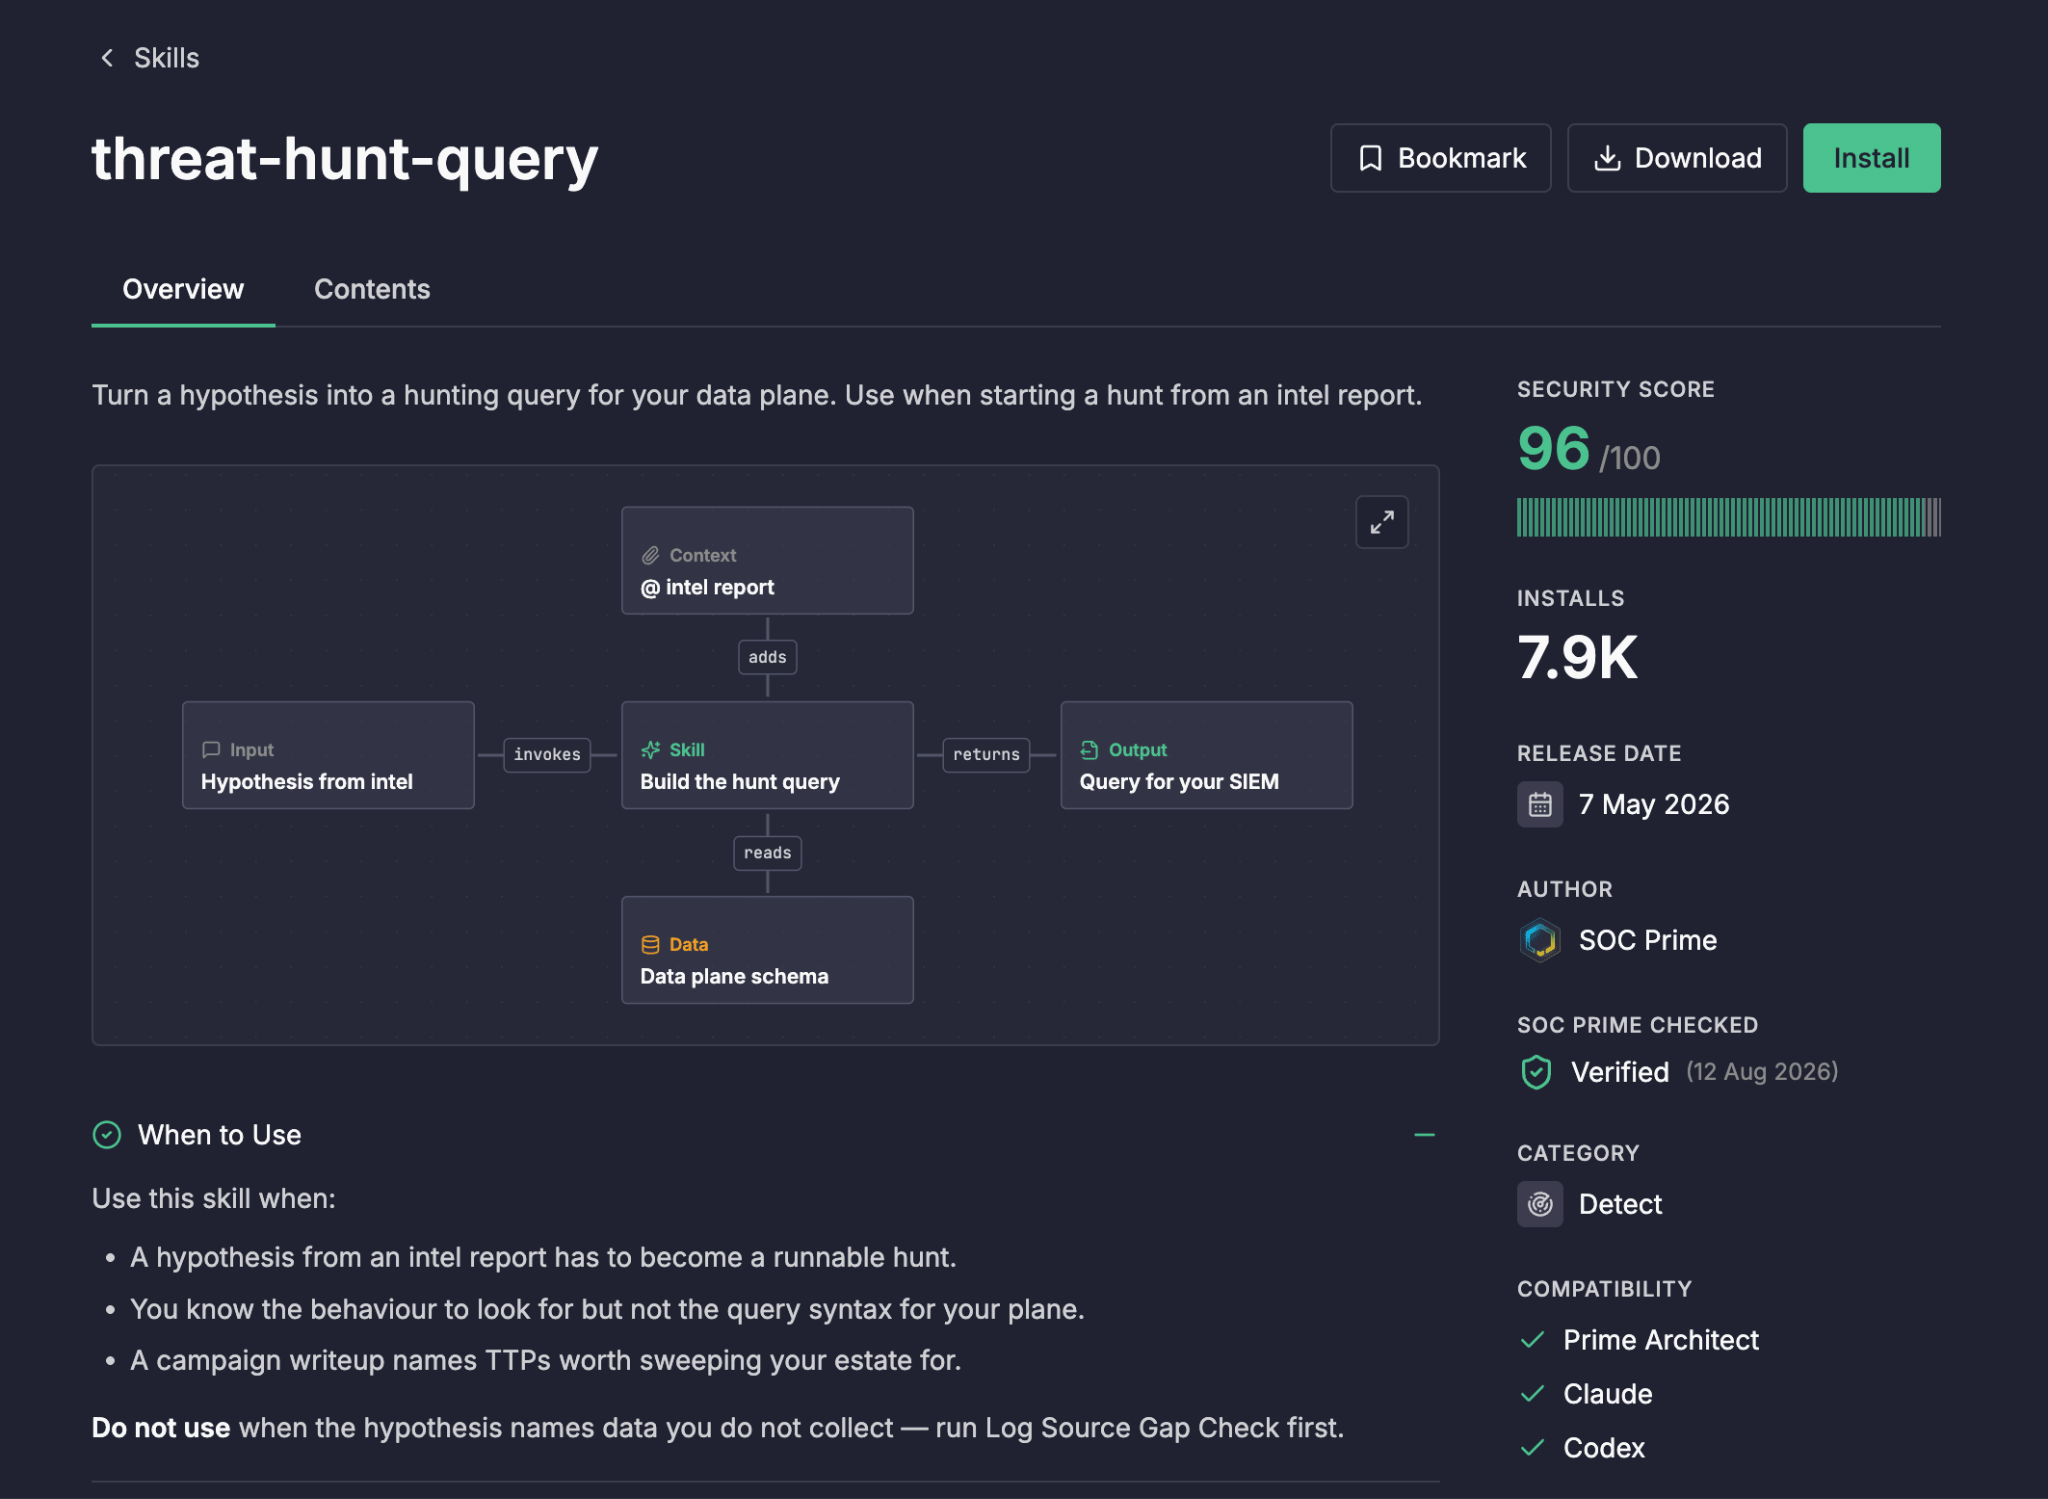
Before installing any skill, its details page gives you everything you need to evaluate it — no black box, no guesswork:

  • Security score — an at-a-glance indication of the skill’s overall safety
  • Vetting details — how the skill was assessed before being listed
  • Operation flow chart — a visual walkthrough of what the skill does and how it works
  • Use cases — real examples of where the skill applies
  • Prerequisites — what needs to be in place before you run it
  • Compatibility — which environments, agents, and tools it works with

Putting Skills into Practice

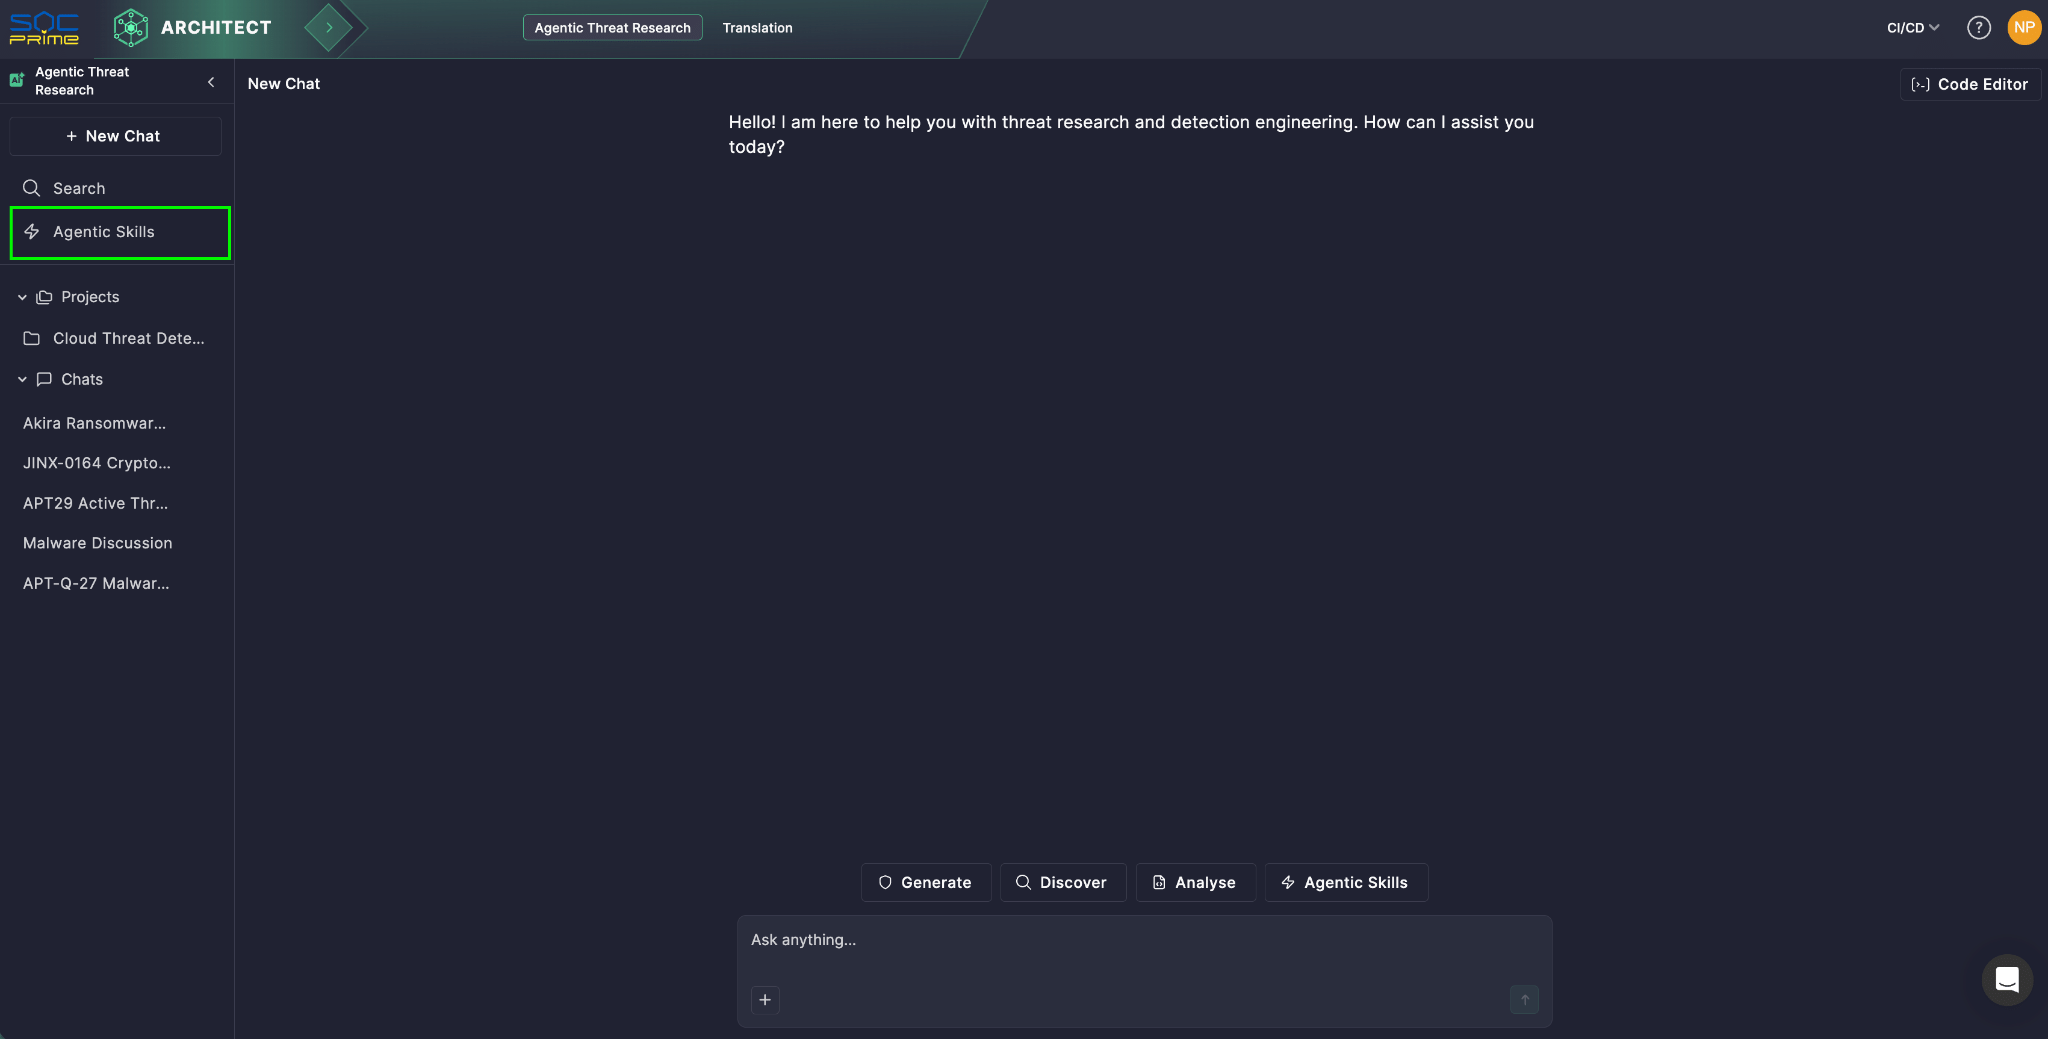
  1. Discover. Go to Prime Architect > Agentic Threat Research > Agentic Skills. 

Browse the library by NIST Cybersecurity Framework, or check “For You” and “New” for recommendations and recent releases. 

  1. Evaluate. Open a skill’s details page for its flow diagram, when-to-use guidance, prerequisites, a worked example, security score, and compatibility. 

Not ready to use? Bookmark it for later.

  1. Install. One click adds it to your skills, ready to use in your workflow. Installed skills auto-update, so you always run the latest, most accurate version with zero manual maintenance.

Take it with you. Generate a ZIP package containing the skill’s SKILL.md file — useful for storing it locally or running it with a compatible external agent or platform.

  1. Use it. In Prime Architect chat, add the installed skill to your message any of three ways:
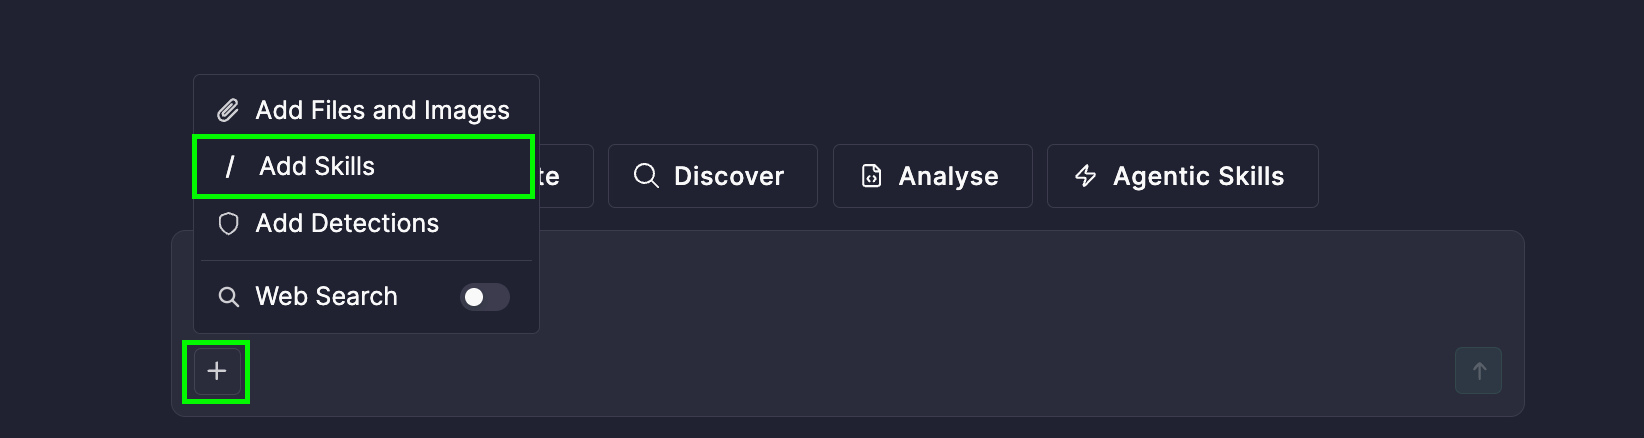
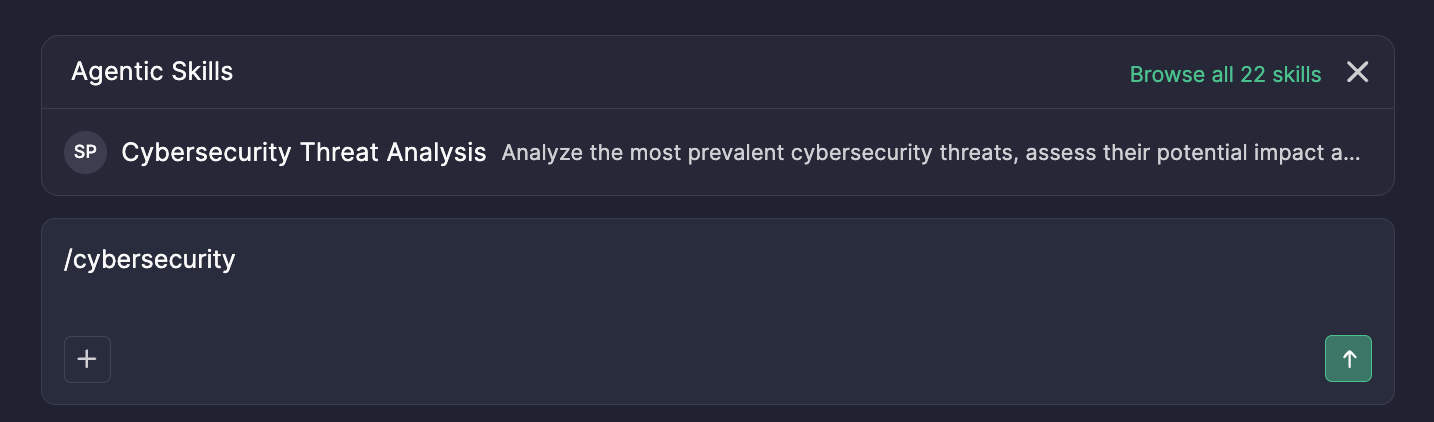
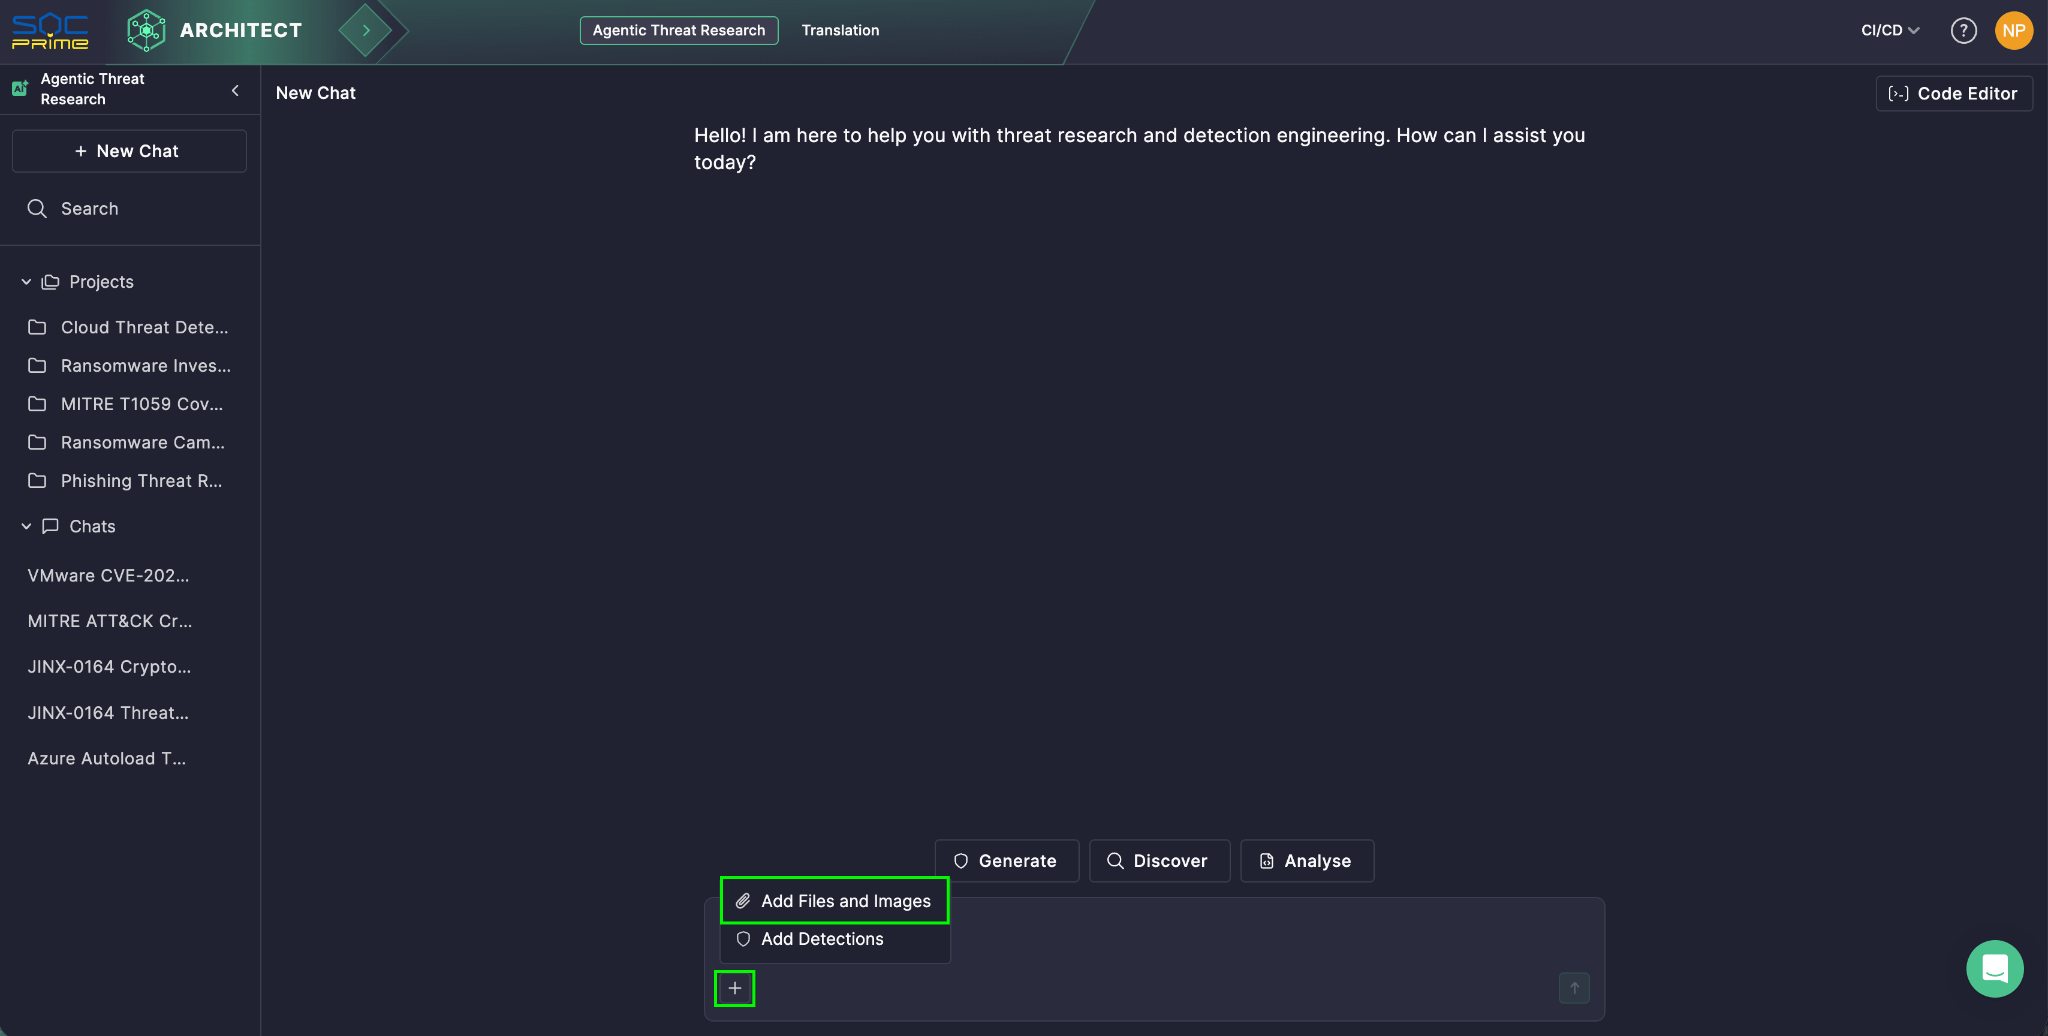
  • Click the + icon and select Add Skills, then pick a skill 
  • Type / to search by skill name or description and select the skill from the list
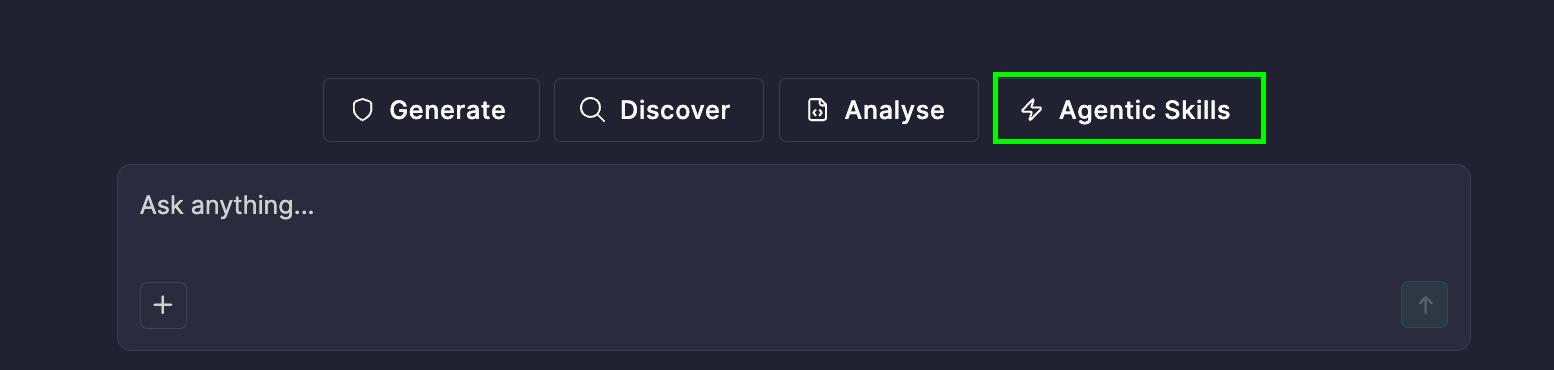
  • Click the Agentic Skills button above the chat input, then pick a skill 

Pair it with your own prompt, a file, or a detection for context, then send — the agent follows the skill’s instructions to produce the output.

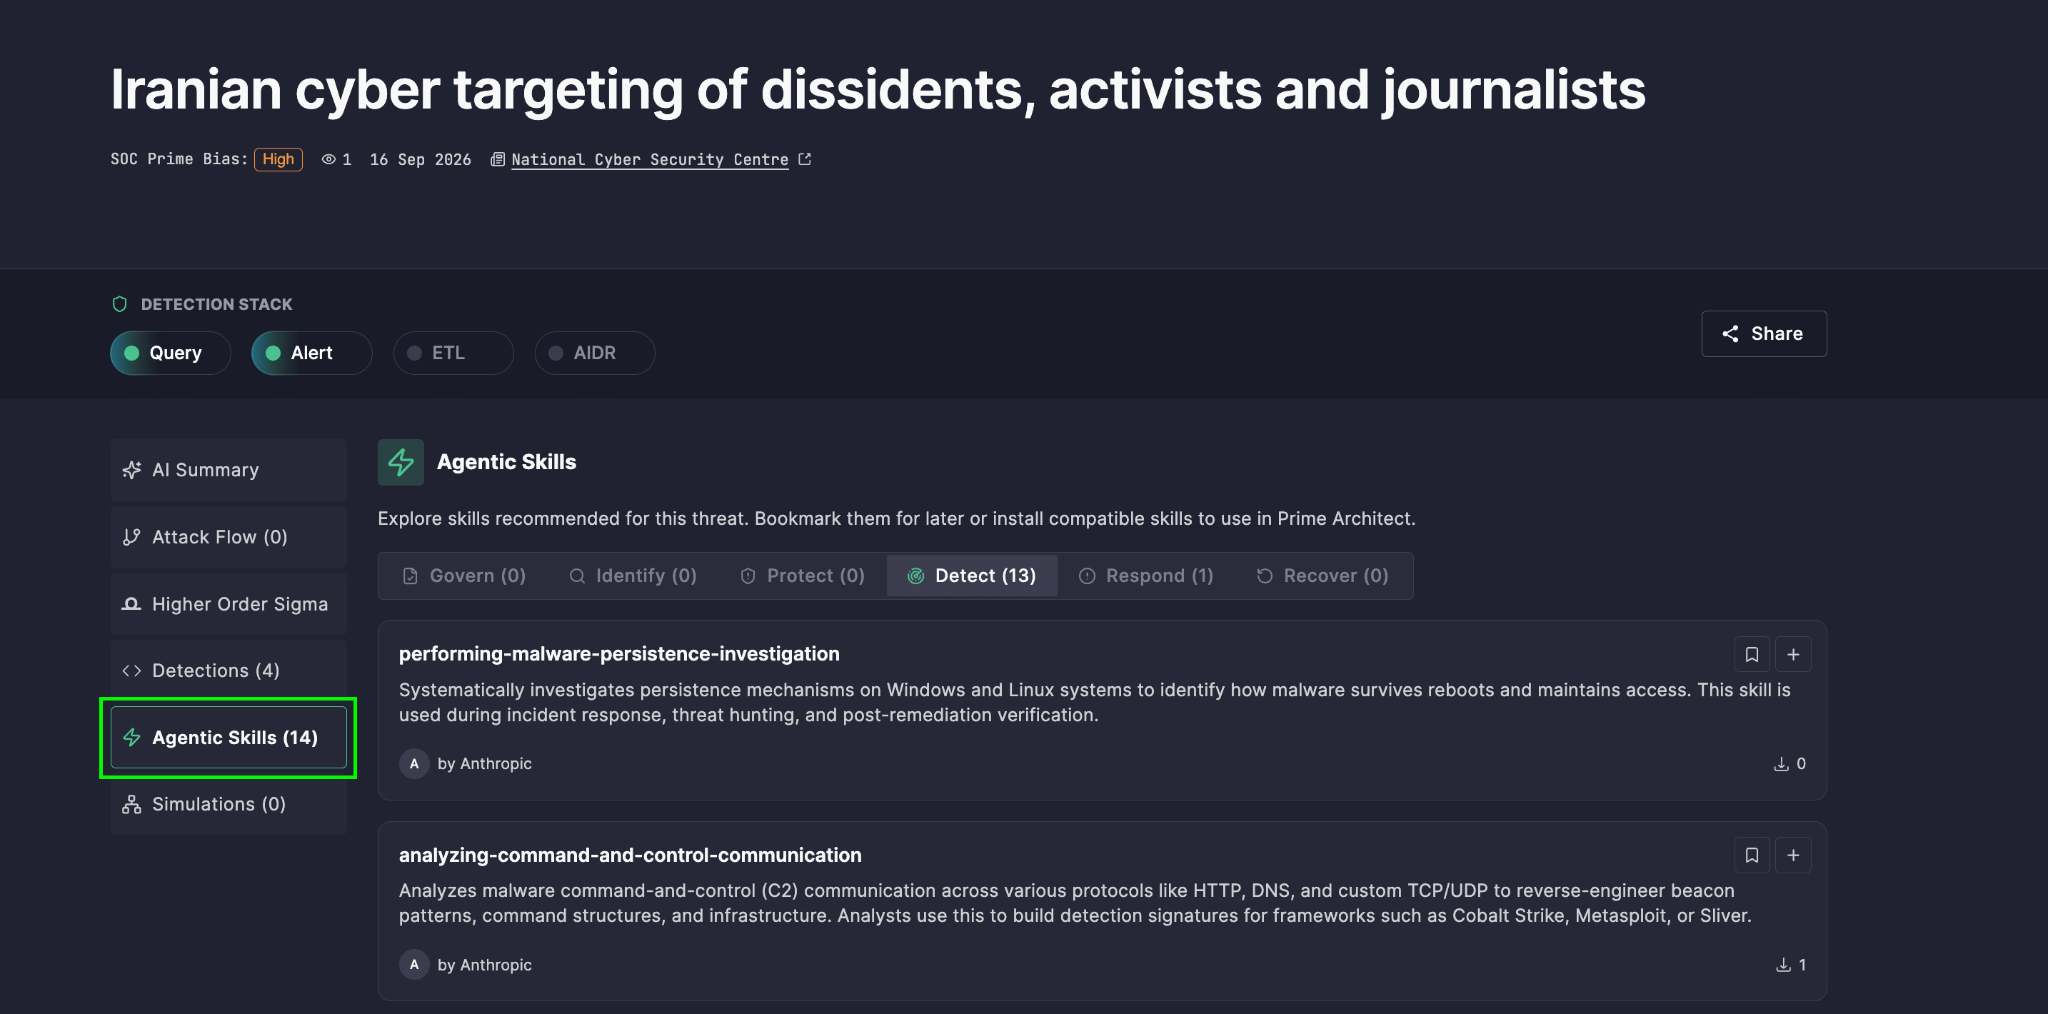
The marketplace doesn’t sit in isolation — it’s also connected directly to Active Threats in Prime Core. When you’re exploring a specific threat, relevant agentic skills surface automatically, right alongside the investigation. Instead of leaving your threat research to go hunt for the right skill, the skill finds you at the moment you need it — keeping analysis and action in the same flow.

Experience the Marketplace

This isn’t meant to be another catalog layered onto an already crowded security stack. It’s built to make it easier to find useful skills, understand what they actually do before adopting them, and bring them into existing workflows with real confidence instead of guesswork.


The post Introducing the Agentic Skills Marketplace: Curated AI Capabilities for the Modern SOC appeared first on SOC Prime.
Prime Detect ROI: Validated Savings from Detection at the Pipeline Layer

The trade-off nobody wants to make

Anyone who has worked on SOC and SIEM projects long enough has watched the same decision play out in budget meetings again and again. Security teams are pushed into a choice that has nothing to do with security engineering and everything to do with invoices.

Option one: drop log sources. Cut DNS. Cut endpoint process telemetry. Cut cloud audit trails, or sample them down to something the license can absorb. The team survives the budget, and the detection surface quietly shrinks. Every dropped source is a blind spot that an adversary does not have to work around, because it was never watched in the first place.

Option two: keep everything. Stream raw telemetry into SIEMs, Data Lakes, and AI agents, and accept that the bill grows in direct proportion to how much the business logs. Cloud migration, Kubernetes, identity providers, SaaS sprawl — every one of them adds volume, and none of them asks whether the security budget grew this year.

Neither option is a strategy. They are both consequences of the same architectural assumption: that detection happens after storage. That assumption is now the single largest cost driver in the modern SOC, and it is the one we set out to remove.

Today we can share validated ROI on a third approach: putting a full threat detection engine inside the data pipeline, before the expensive tiers ever see the data.

Contact Sales

What Prime Detect actually does

SOC Prime Detect evaluates 100% of your streaming telemetry at wire speed. Not a sample. Not a filtered subset chosen by a cost-control rule six months ago that nobody has revisited since. All of it, as it moves.

It does this by applying curated Sigma logic at the pipeline layer — the transport stage between your collectors and your destinations. Three things follow from that placement:

Tier 1 — noise reduction. Prime Detect filters out 93% of raw log noise before it reaches a paid destination. Successful routine authentications, chatty process telemetry, health checks, the enormous background hum that every enterprise environment produces and no analyst has ever opened. The events are evaluated against detection logic first, then discarded or routed cheaply, rather than being paid for at premium ingest rates on the chance they might matter later.

Tier 2 — correlation. Isolated matches are not detections. Prime Detect uses Sigma Correlations, expressed as Higher Order Sigma rules, to assemble individual matches into attack chains across sources and across time. This is where a single suspicious LDAP query and an unusual service creation stop being two low-confidence events and become one high-confidence sequence.

Tier 3 — signal delivery. What reaches the top of the stack is compressed down to 7 PPM — 0.000007 of the original stream. That is the material handed to Tier 3 AI agents: seven events per million, already correlated, already contextualized, already worth reasoning about.

The key point is that nothing is discarded before it is examined. Traditional cost control drops data blind. Prime Detect inspects everything and forwards only what earns its place downstream.

The numbers, as measured with Enterprise customers

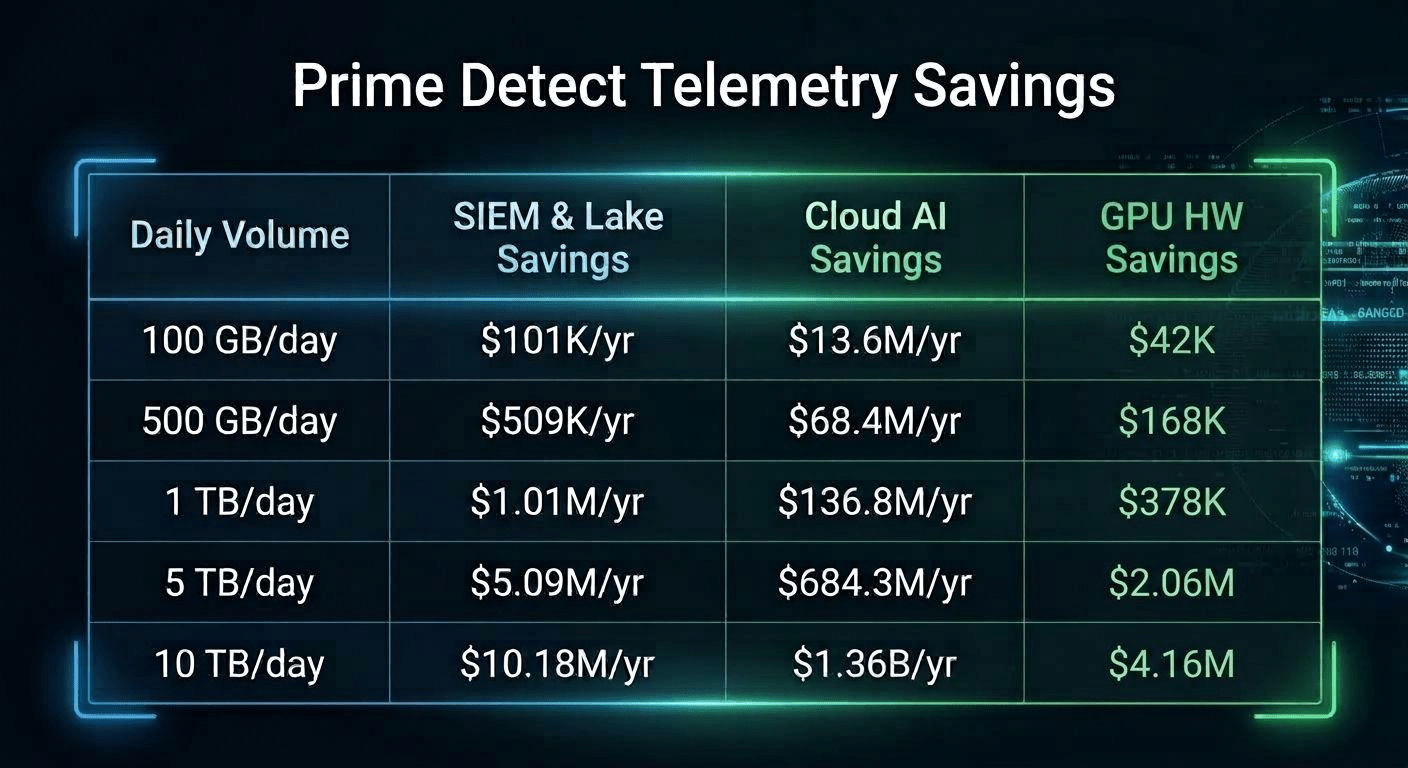
The table below shows validated savings across ingest volumes from 100 GB/day to 10 TB/day, broken out by where the cost lands in the stack.

Three separate cost lines are worth reading carefully, because they behave very differently.

SIEM and Data Lake savings are the most familiar. They scale linearly with volume and they are the ones most security leaders already track. At 1 TB/day, a 93% reduction in what reaches the paid tier is worth roughly a million dollars a year. At 10 TB/day it is worth ten.

Cloud AI savings are where the arithmetic becomes genuinely uncomfortable for anyone planning an AI SOC. Token costs scale with the volume of text a model is asked to read. Pointing an LLM at raw telemetry means paying for every heartbeat and every successful login, at inference prices, forever. The gap between reasoning over a raw stream and reasoning over a 7 PPM signal is the difference between a line item and an impossibility. At 1 TB/day, that difference is $136.8M a year.

GPU hardware savings apply to teams running models on their own infrastructure. The saving is smaller in absolute terms but structurally important: it changes what you have to buy up front. A detection strategy that requires a GPU farm before it produces its first alert is a strategy most organizations will never get funded.

What this means for your stack

1. Stop letting ingestion volume dictate your security strategy. Downstream software, hardware, and AI fees can be cut by up to 93%. More importantly, the decision about which log sources to keep goes back to being a detection engineering decision rather than a procurement one. Coverage stops being rationed.

2. Enable continuous detection across 100% of unparsed logs. Detection at the pipeline layer does not depend on a source being normalized, mapped, and onboarded first. Sigma rules run against the stream as it arrives, which means new sources contribute to detection on day one rather than after a parsing project. It also sidesteps a constraint that quietly caps many mature programs: SIEM rule execution limits. Teams routinely retire working rules to make room for new ones. Moving evaluation into the pipeline removes that ceiling, and it does so without burying analysts or detection engineers under additional alert volume — because correlation happens before delivery, not after.

3. Run autonomous AI SOC agents on high-fidelity attack chains. AI agents are extremely good at reasoning over structured, correlated evidence and extremely expensive when asked to sift raw noise. Feeding them a correlated 7 PPM signal is what makes autonomous triage economically viable without a million-dollar token budget or a server room full of GPUs.

Why Sigma, and why the pipeline layer

Two design choices do the heavy lifting here, and both are deliberate.

Sigma is an open, vendor-neutral detection format with a large and actively maintained public body of logic behind it. Using curated Sigma logic at the pipeline layer means detection content is portable: it is not locked to the query language of whichever platform you happened to buy, and it does not need rewriting when a destination changes. The content your team writes and the content the community publishes run in the same place, against the same stream.

Sigma Correlations extend that model from single-event matching to sequence and threshold logic. Higher Order Sigma rules are what let the pipeline decide that a cluster of individually unremarkable events constitutes an attack chain worth escalating — and, just as importantly, that a matching event with no surrounding context does not.

The pipeline layer matters because it is the only place in the architecture where every event is guaranteed to pass through exactly once, in motion, before any storage or compute cost has been incurred. Detection there is not a cheaper version of what the SIEM does. It is the same work done at the one point where it is still free to do it.

See it for yourself

The trade-off between coverage and cost was never a law of nature. It was an artifact of where detection happened to sit in the stack. Move detection upstream, into the pipeline, and both sides of that trade-off improve at once: more of your telemetry gets examined, and less of it gets paid for twice.

If you want this ROI for your own security stack, get in touch — or view a live demo of how Prime Detect works. No strings attached.


The post Prime Detect ROI: Validated Savings from Detection at the Pipeline Layer appeared first on SOC Prime.
Diamond Model in Deep Threat Research: The Four Corners of an Intrusion

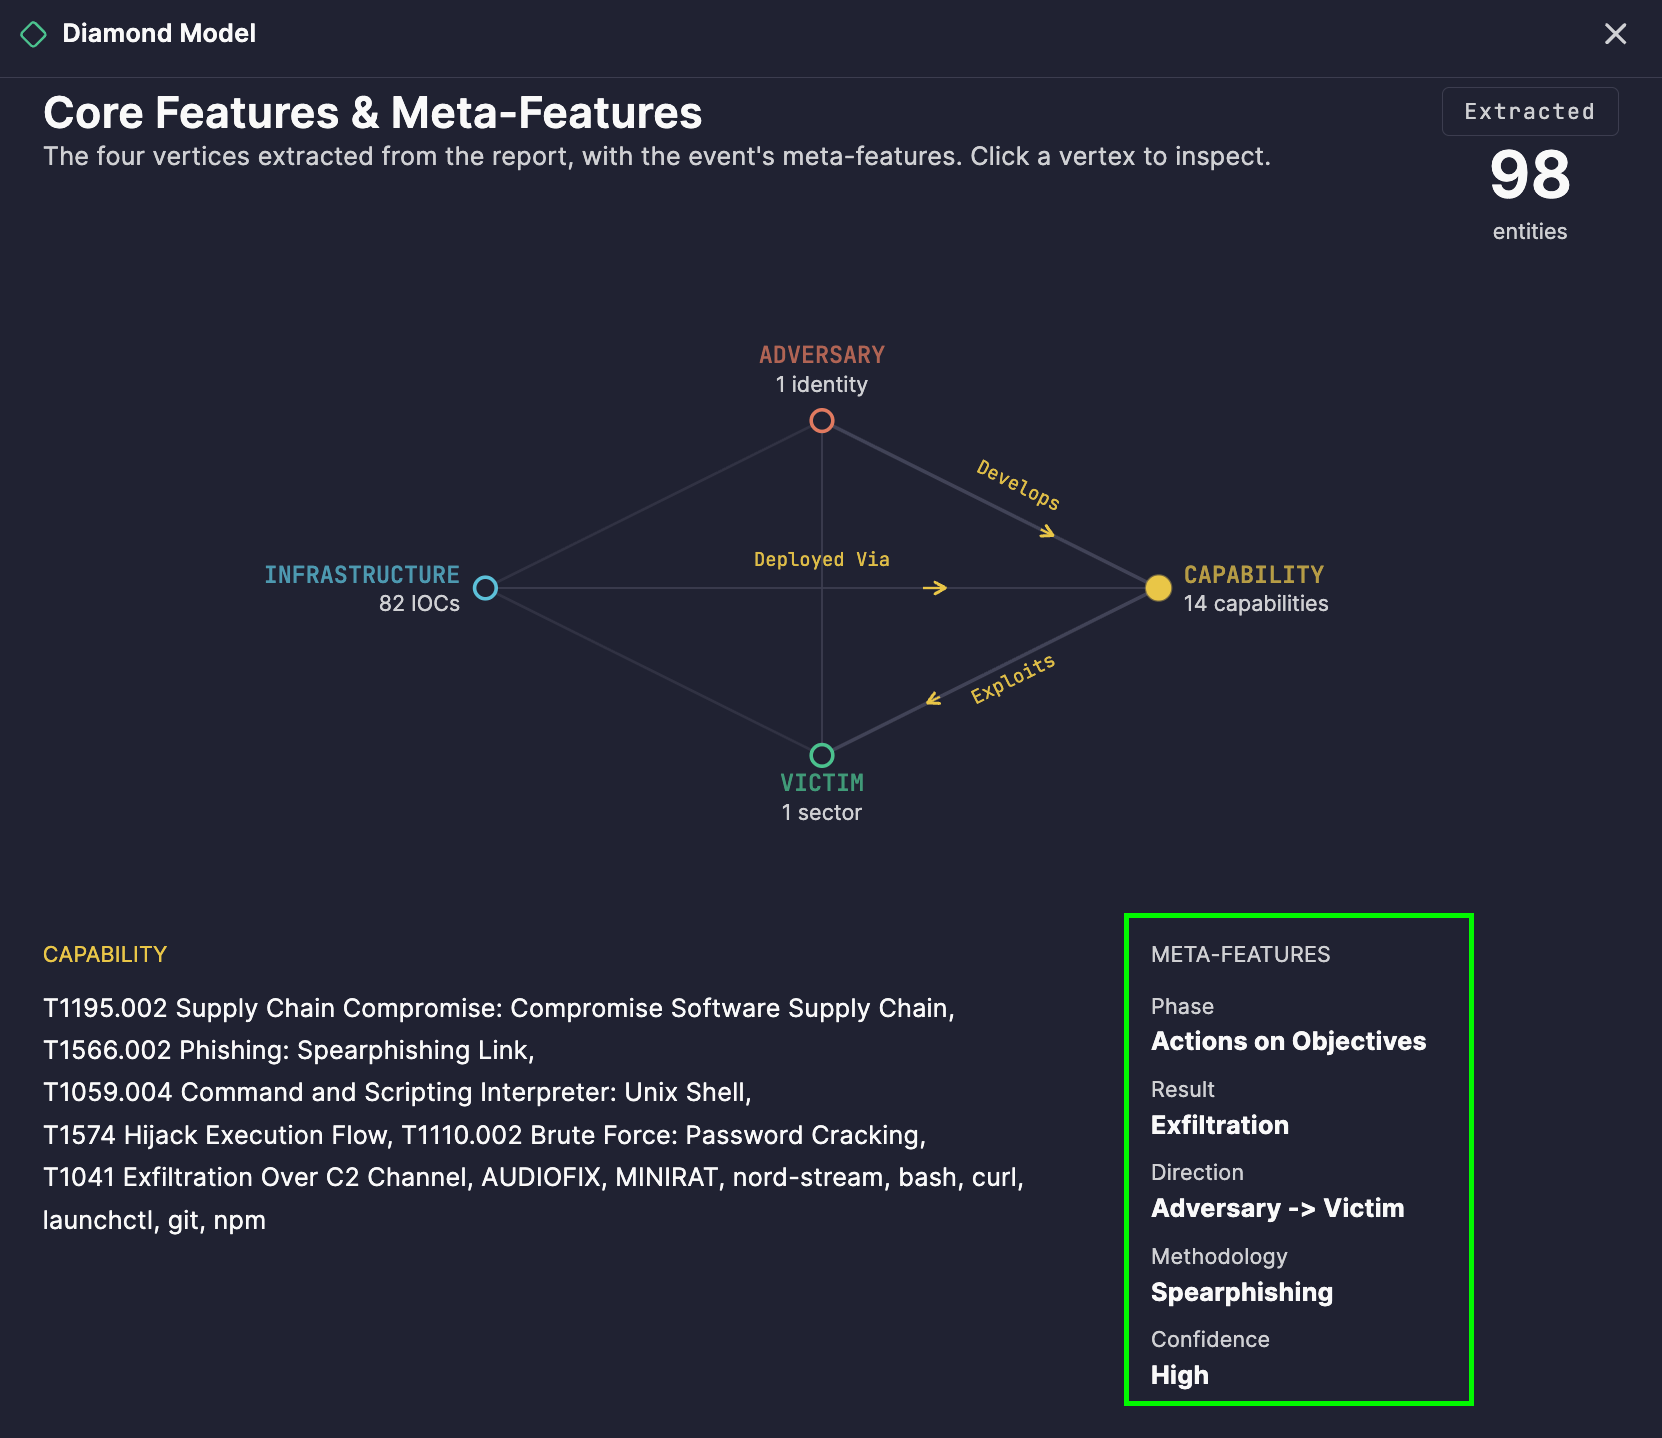
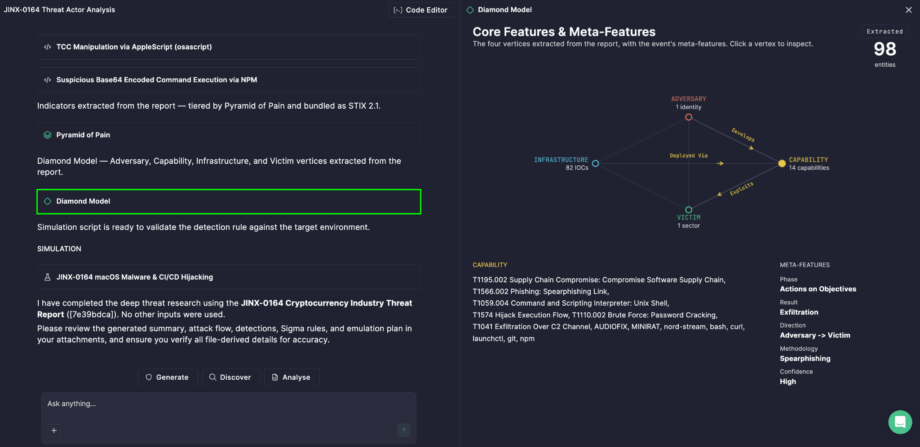
Every intrusion involves more than just malware or a compromised IP — it involves a threat actor, the tools they wield, the infrastructure they operate through, and the victim they target. Understanding how these elements connect is often more valuable than looking at any one of them in isolation. That’s why Prime Architect visualizes adversary activity using the Diamond Model — generated automatically as part of Deep Threat Research analysis, helping your team see not just what happened, but how the pieces of an intrusion relate to one another.

Mapping the Four Corners of an Intrusion

The Diamond Model of Intrusion Analysis is a threat intelligence framework built on a simple premise: every malicious event can be broken down into four core elements, and mapping the relationships between them reveals far more about an adversary’s operation than examining indicators in isolation. Rather than a flat list of IOCs, the model gives analysts a structural view of the intrusion itself.

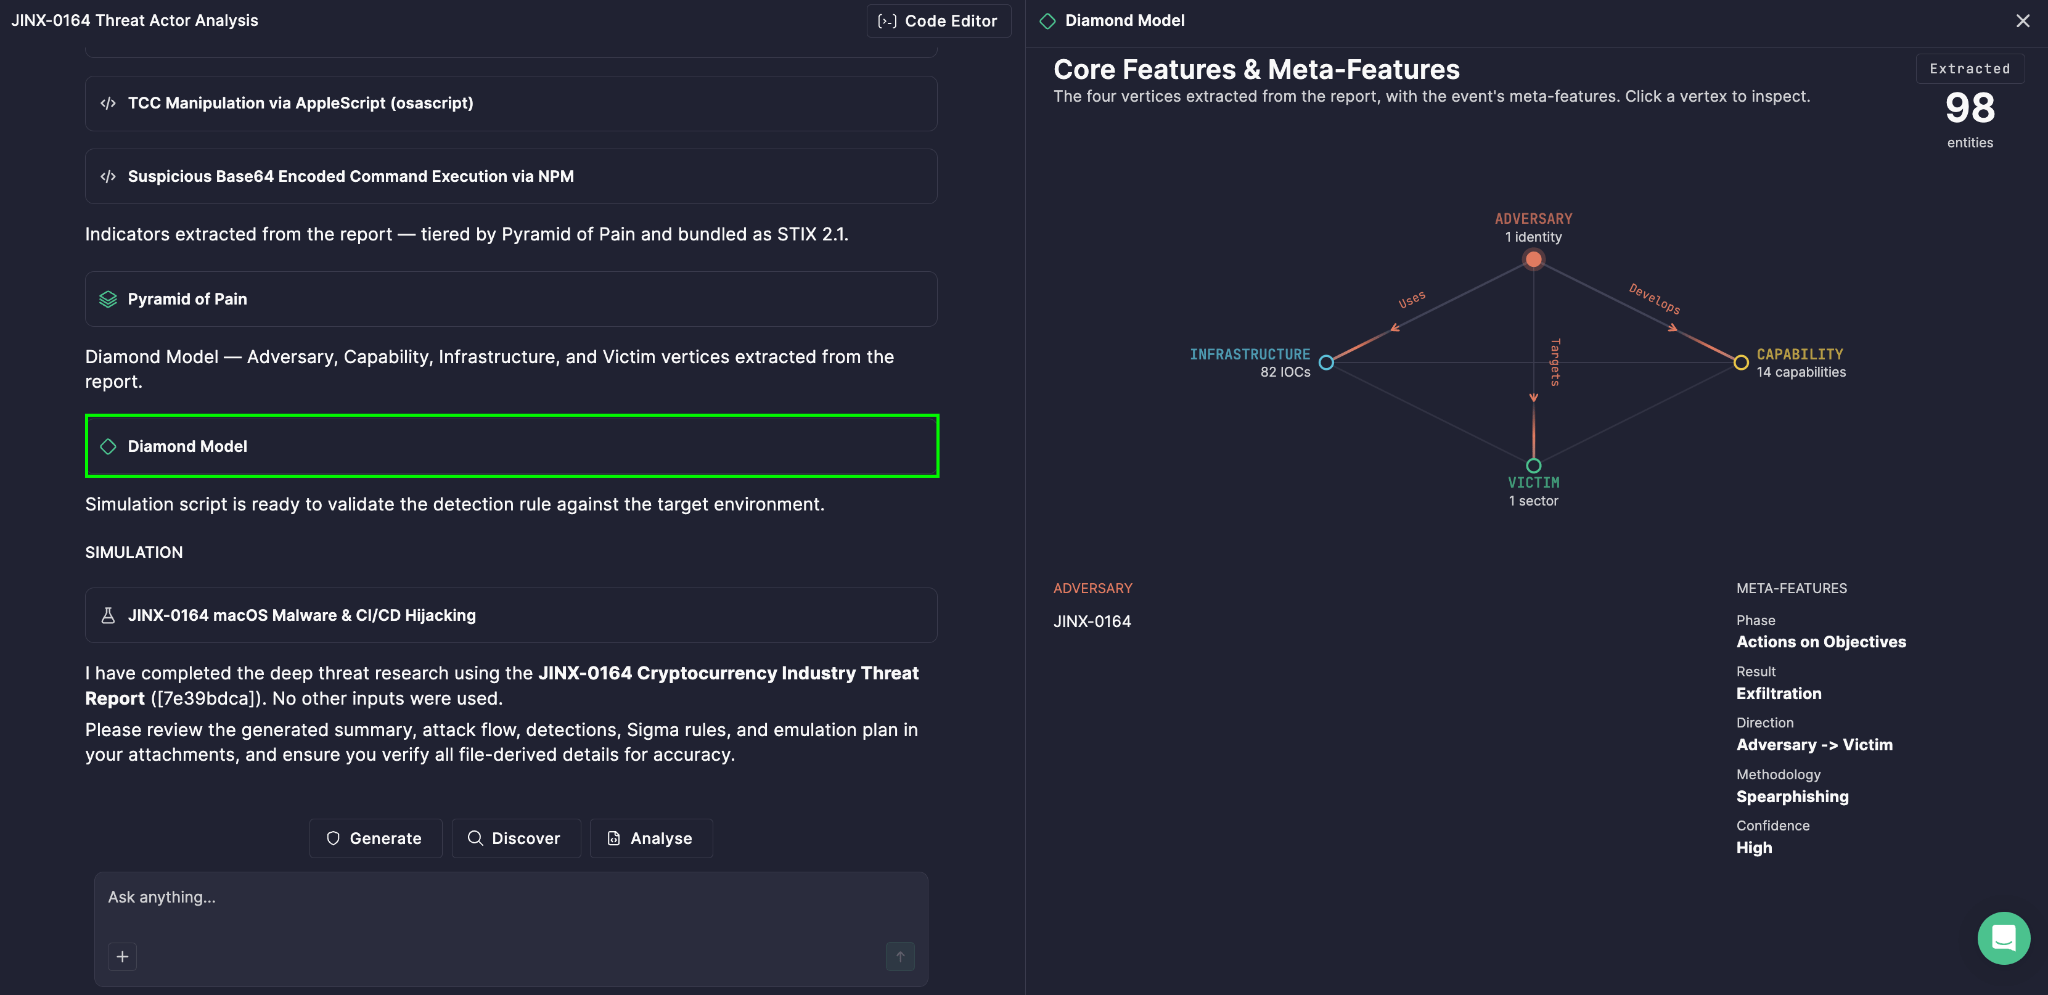
The Diamond Model displays four vertices, each representing a core element of the analyzed threat:

  • Adversary — the threat actor or organization behind the activity
  • Capability — the tools, malware, and techniques the adversary used
  • Victim — the targeted entities or organizations
  • Infrastructure — the systems, resources, and services used to carry out the activity

In Prime Architect, the Diamond Model visualizes these four vertices based on the entities actually extracted from the analyzed threat report, and each vertex displays the number of extracted entities associated with it — giving you an immediate sense of how much detail was found for each element of the intrusion.

Reading the Connections

A diamond isn’t just four points — it’s the relationships between them that tell the real story. The diagram represents connections between vertices using directional relationships, including Connects To, Uses, Exploits, Targets, Develops, and Deployed via. These directional links show, for example, which capability an adversary used to exploit a specific victim, or which infrastructure was used to deploy a given tool.

Hovering over a vertex highlights it and reveals its related connections, making it easy to trace how a threat actor’s tools, targets, and infrastructure tie together — without having to manually cross-reference a written report.

An Extracted counter in the diagram shows the total number of entities identified during the analysis, giving you a quick sense of scale. 

To dig into specifics, click any vertex to view the corresponding entity list below the diagram — so you can move seamlessly from the high-level relationship map to the underlying details.

The diagram also includes meta-features — Phase, Result, Direction, Methodology, and Confidence — which add crucial context around the analyzed activity, such as where in the intrusion lifecycle the activity occurred, whether it succeeded, and how confident the analysis is in the mapped relationships.

From Visualization to Action

1. Attribution and actor tracking
By consistently mapping adversaries to their capabilities and infrastructure across multiple analyzed reports, teams can spot overlapping patterns that support attribution to a known threat actor or campaign.

2. Infrastructure and tooling analysis
Seeing which infrastructure supports which capabilities helps defenders anticipate an adversary’s next move — if you’ve identified the infrastructure behind one campaign, related activity becomes easier to detect.

3. Victim profiling and risk assessment
Understanding who adversaries typically target, and through what capabilities, helps security teams assess whether their own organization fits a known targeting pattern.

4. Structured incident storytelling
The four-vertex structure makes it easy to explain an intrusion to stakeholders in clear terms: who did it, how, through what, and against whom — without digging through technical specifics.

5. Confidence-driven prioritization
The Confidence meta-feature helps analysts weigh how much trust to place in a given relationship, so response and remediation efforts can be prioritized around well-supported findings rather than speculative ones.

How to Generate It

  1. Open Prime Architect and go to the Agentic Threat Research mode.
  2. Click Code Editor in the upper-right corner and paste the text of your threat report. 
  3. Select Analyze.
  1. Choose Deep Threat Research from the list.
  2. Click the Enter icon to run the analysis.

The Diamond Model then appears alongside other outputs, giving your team a structural, relationship-driven view of the threat — one that connects the adversary, their capability, their infrastructure, and their victim into a single, coherent picture.


The post Diamond Model in Deep Threat Research: The Four Corners of an Intrusion appeared first on SOC Prime.
Pyramid of Pain in Deep Threat Research: What Really Hurts the Adversary

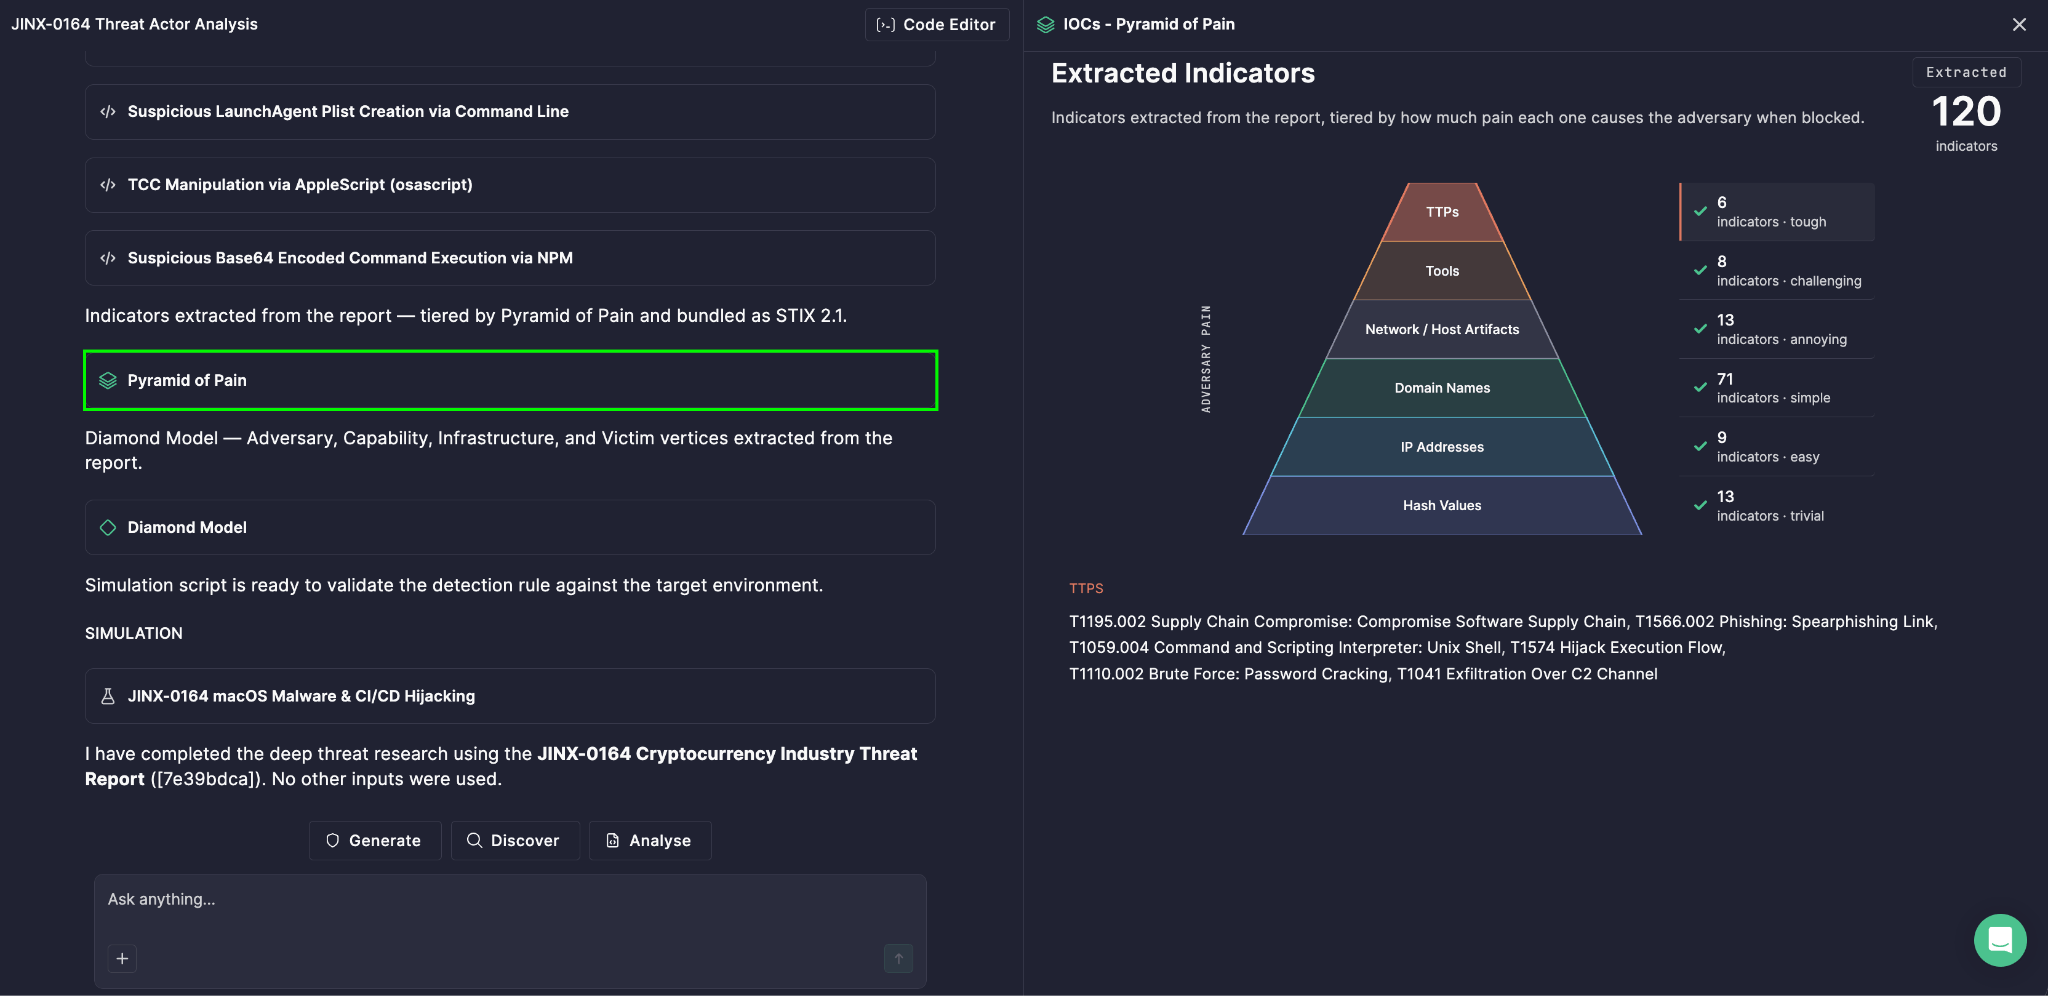
Not all indicators of compromise are created equal. A malicious IP address can be swapped out in minutes; an adversary’s core tactics, techniques, and procedures take months — sometimes years — to rebuild. That’s why Prime Architect visualizes threat indicators using the Pyramid of Pain — generated automatically as part of Deep Threat Research analysis, helping your team focus detection efforts where they actually hurt the adversary.

The Model Behind the Visualization

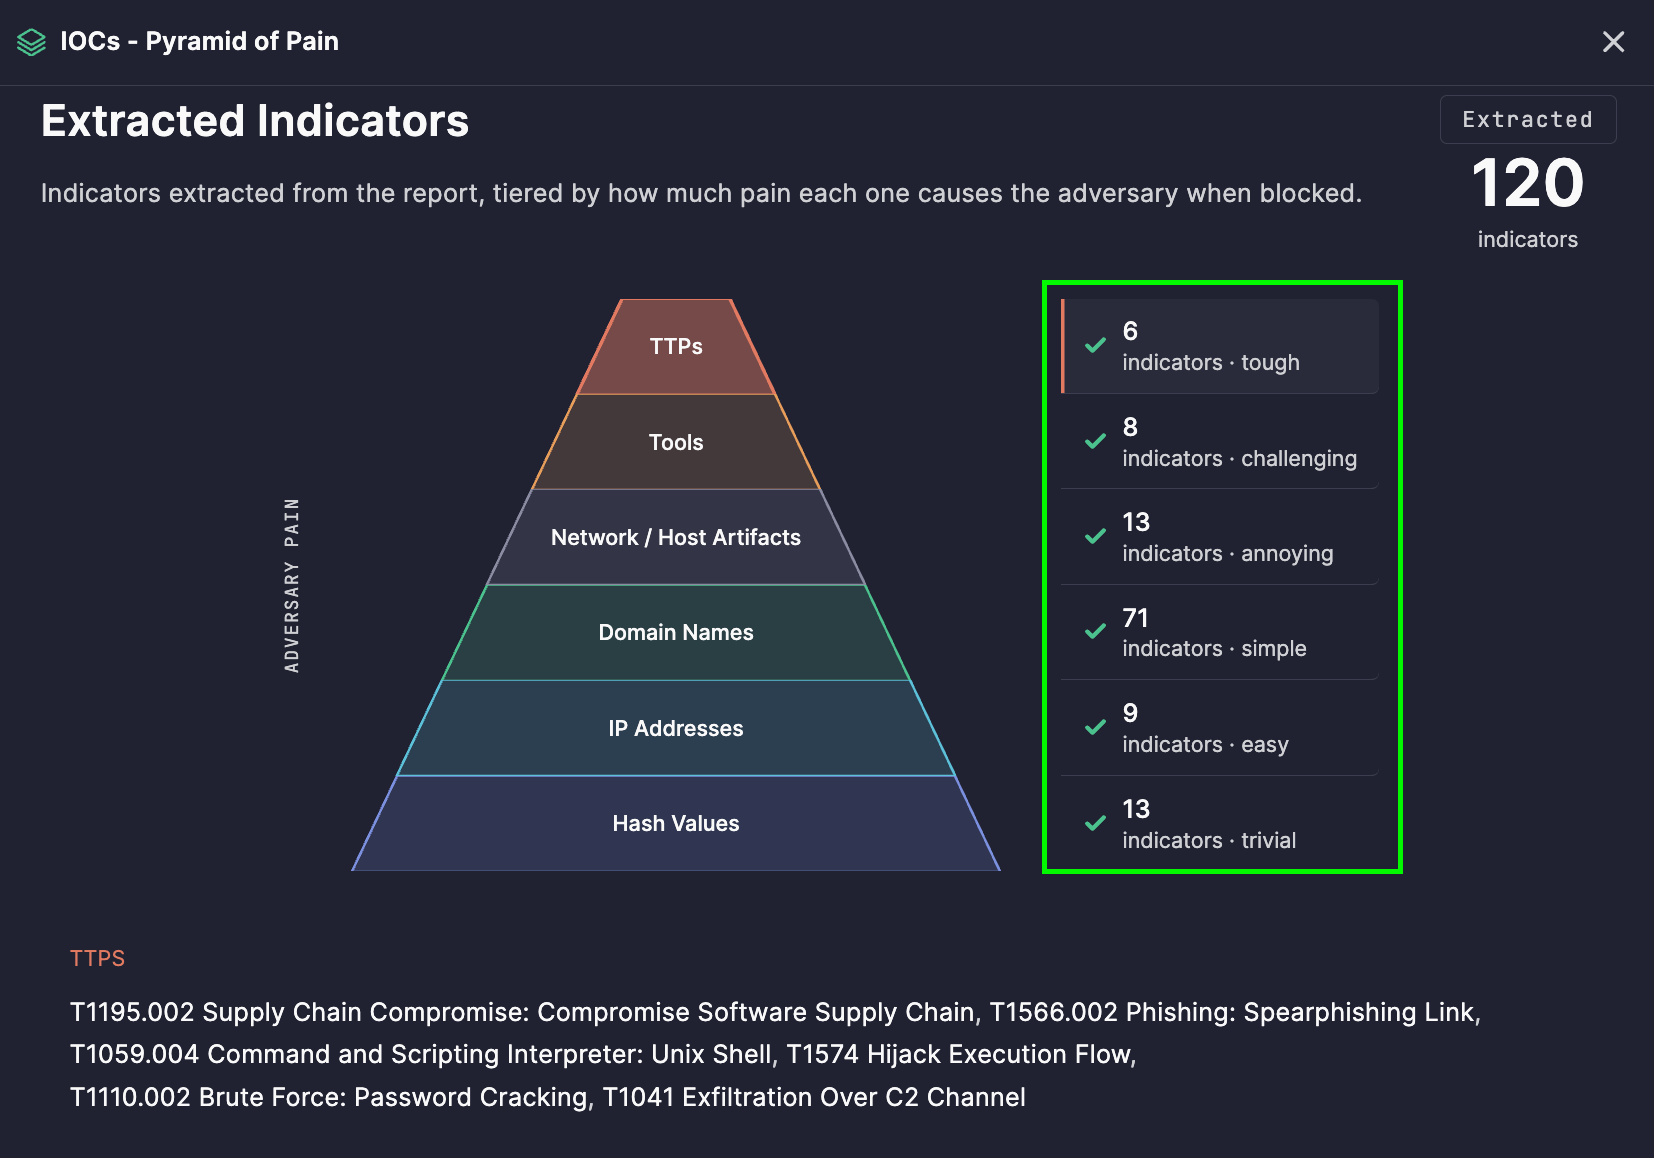
The Pyramid of Pain threat intelligence framework ranks indicators of compromise not by how easy they are to find, but by how much disruption they cause an adversary when detected and blocked. The underlying logic is simple: some indicators are trivial for attackers to change, while others sit at the core of their operational identity — changing them requires real cost, time, and retooling.

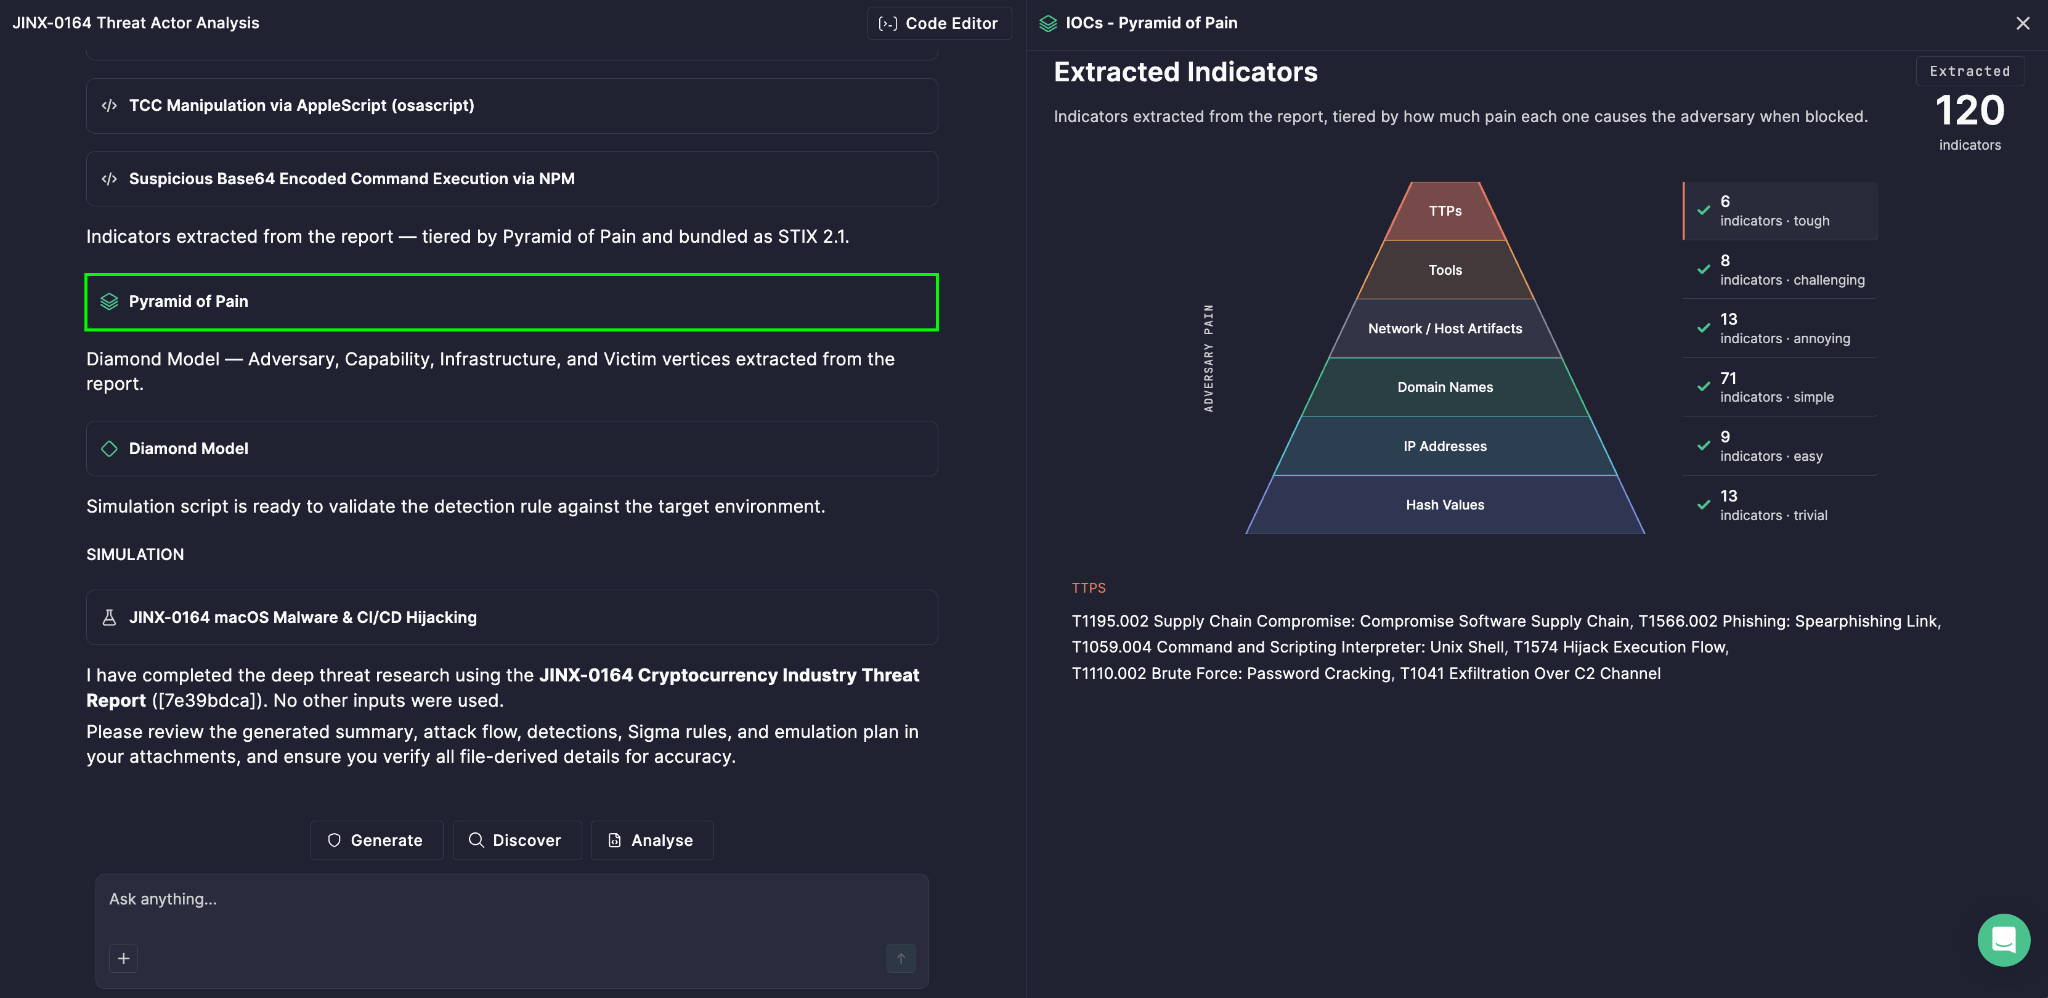
The Pyramid of Pain categorizes threat indicators into six levels, arranged from the base of the pyramid (low pain) to the top (high pain):

  • Hash Values — trivially easy to change; a single byte modification produces a new hash
  • IP Addresses — easy to rotate, especially with cloud infrastructure or proxies
  • Domain Names — somewhat harder to change, but still replaceable with moderate effort
  • Network/Host Artifacts — patterns left behind by tools or activity, requiring more rework to avoid
  • Tools — the utilities and malware an adversary relies on; replacing them takes real development effort
  • Tactics, Techniques, and Procedures (TTPs) — the adversary’s actual behavior and tradecraft; the hardest and most costly element to change, since it’s tied to how they operate at a fundamental level

In Prime Architect, the Pyramid of Pain visualizes these six tiers based on the indicators actually extracted from the analyzed threat report, giving your team an immediate, ranked view of what was found — and, more importantly, how much of it truly matters.

What’s Really Happening at Each Tier

Each tier in the pyramid isn’t just a category — it’s a signal about strategic value. A report full of hash values and IP addresses may look rich in indicators, but if it’s light on TTPs, the actionable intelligence is thinner than it appears. Conversely, indicators found near the top of the pyramid represent durable insight into how the adversary operates, which stays relevant even after they change infrastructure.

The panel on the right of the visualization displays the number of indicators extracted for each tier alongside its corresponding pain level, so you can see at a glance whether your intelligence skews toward easily-replaced artifacts or toward high-value behavioral detail. 

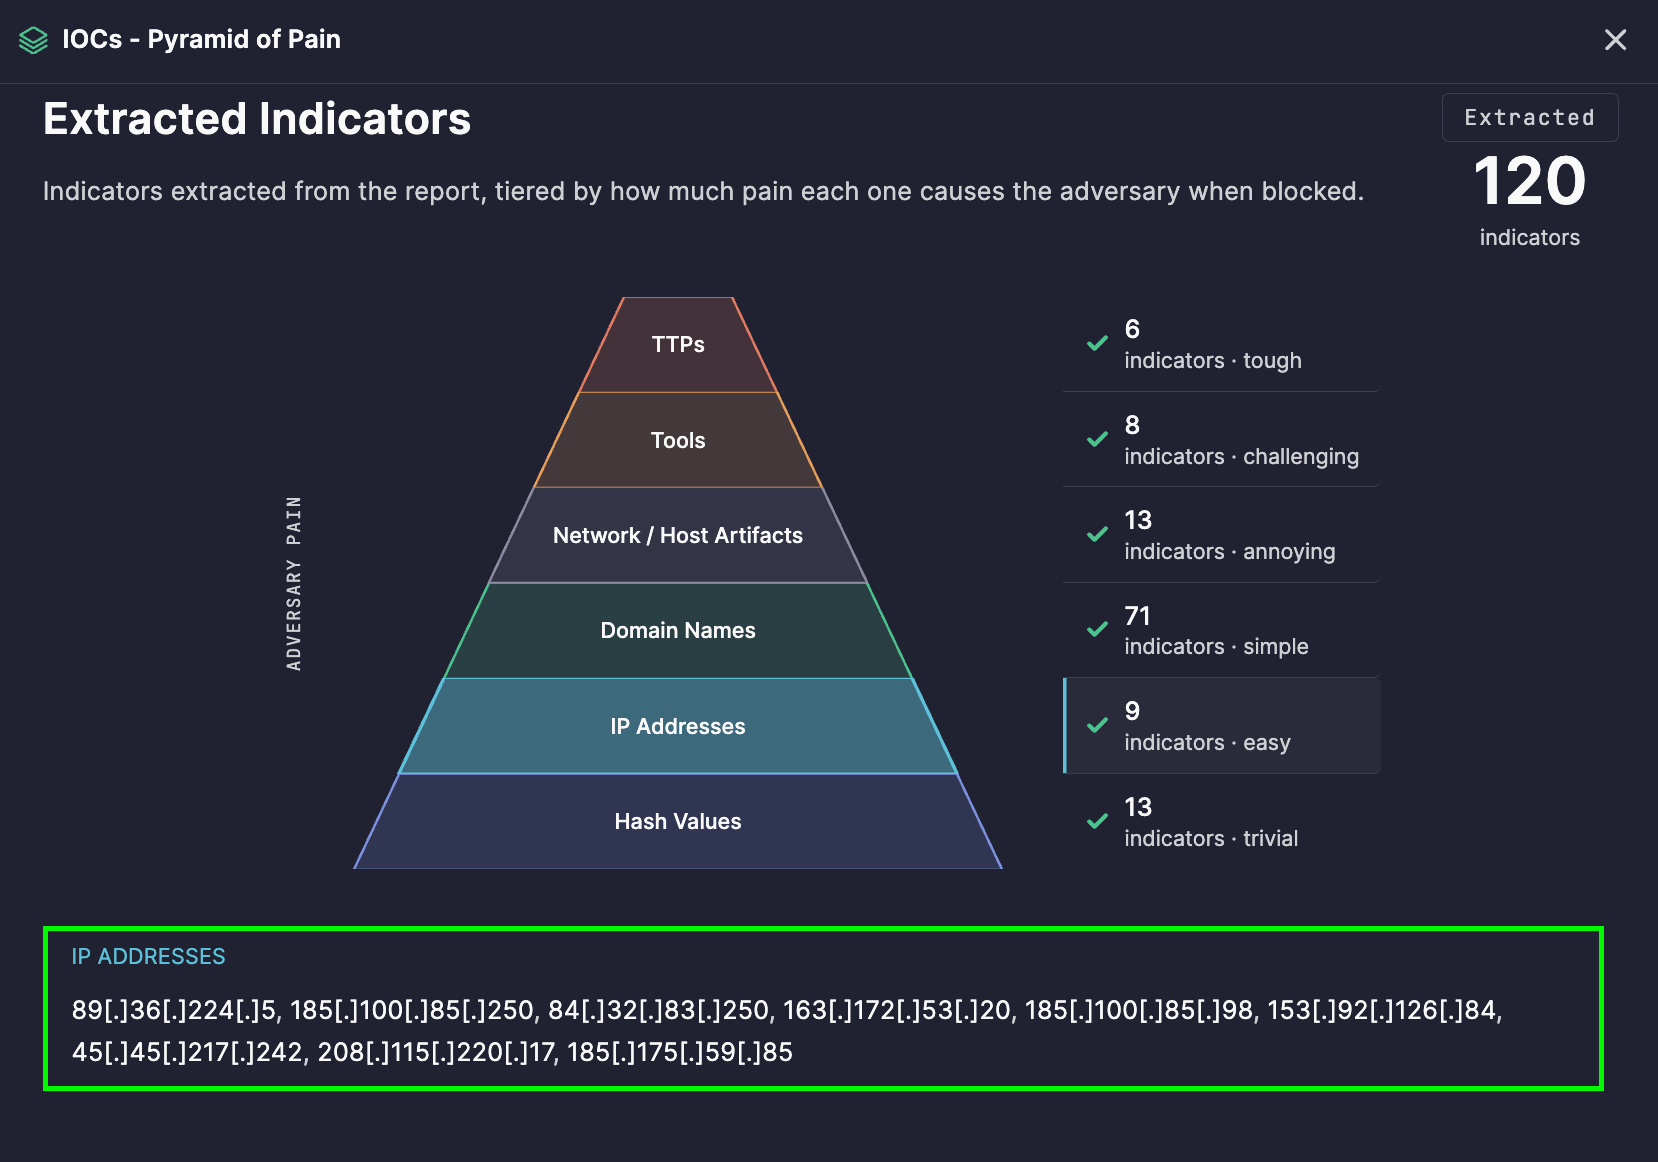
To review indicators by category, simply click the corresponding pyramid tier — the list of indicators associated with that tier appears directly below the pyramid.

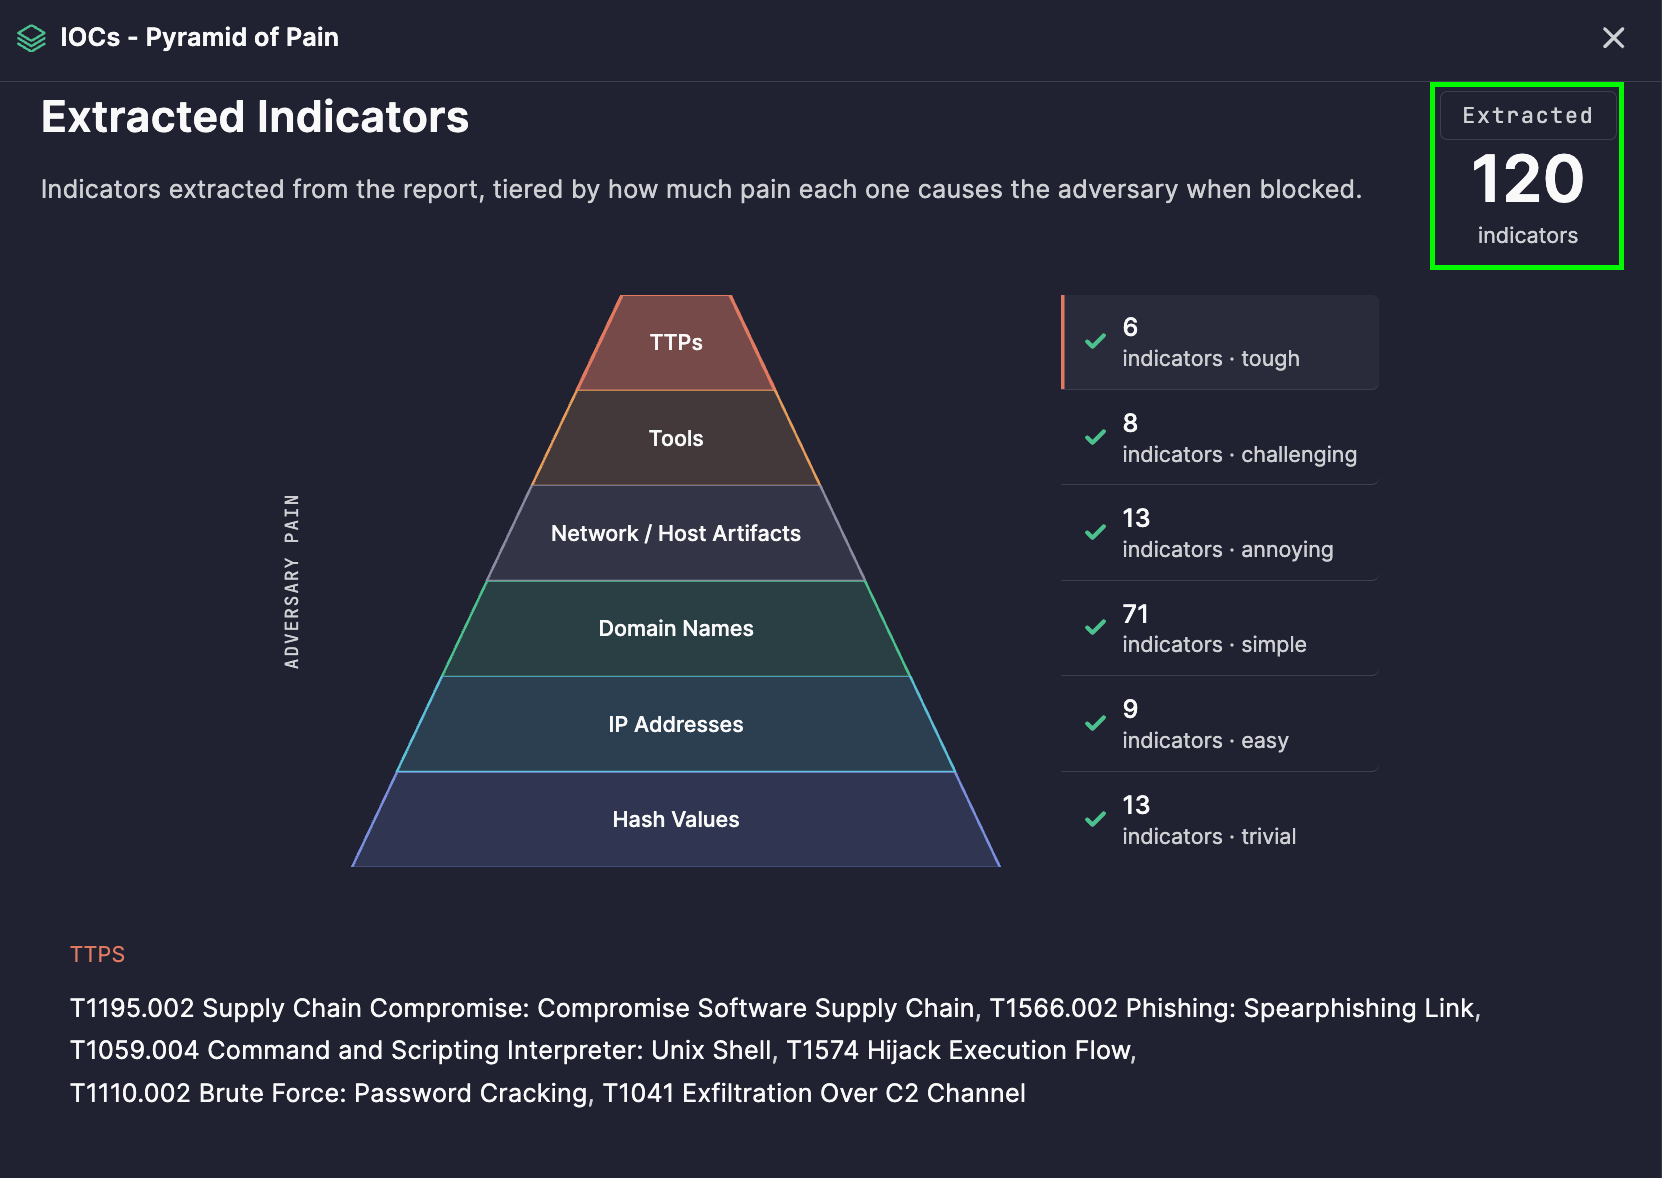
In the upper-right corner, a total extracted indicators count shows the overall number of indicators identified during the analysis — giving you a quick sense of scale before diving into specifics.

From Visualization to Action

1. Prioritizing detection engineering
Teams can use the pyramid to decide where to invest detection effort. Detections built around TTPs and tools remain effective far longer than those built solely around hashes or IPs, which adversaries can bypass with minimal effort.

2. Assessing intelligence quality
A quick glance at tier distribution tells you whether a threat report offers durable strategic value or just short-lived tactical indicators — useful for triaging which reports deserve deeper investigation.

3. Threat hunting
Higher-tier indicators — Network/Host Artifacts, Tools, and TTPs — make excellent starting points for proactive threat hunts, since they’re far less likely to have changed since the report was published.

4. Communicating impact to leadership
The pyramid’s intuitive “pain” concept makes it easy to explain, in non-technical terms, why certain detections are more valuable and durable than others.

5. Long-term adversary tracking
Because TTPs are the hardest element for adversaries to change, tracking them across multiple analyzed reports helps identify recurring behavior tied to the same threat actor or campaign, even as their infrastructure shifts.

How to Generate It

  1. Open Prime Architect and go to the Agentic Threat Research mode.
  2. Click Code Editor in the upper-right corner and paste the text of your threat report. 
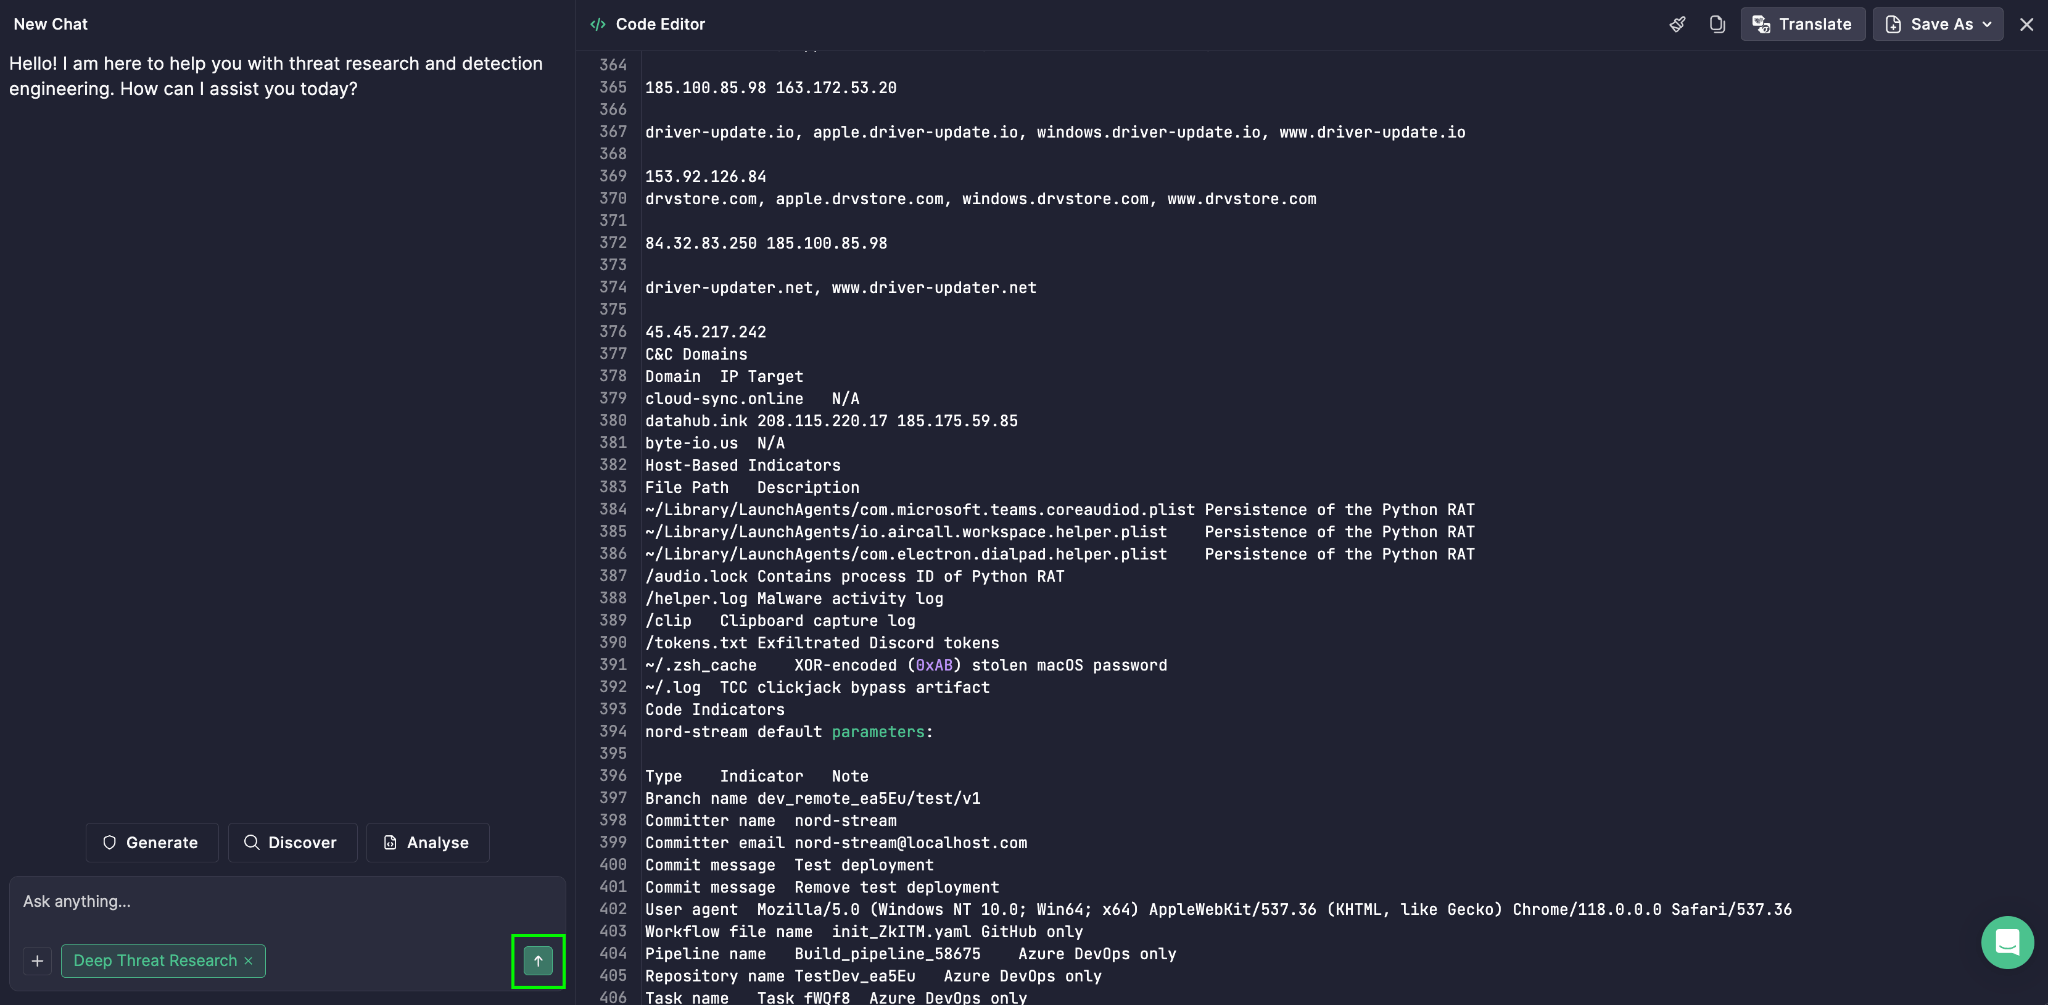
  3. Select Analyze.
  1. Choose Deep Threat Research from the list.
  2. Click the Enter icon to run the analysis.

The Pyramid of Pain then appears alongside other outputs, giving your team a complete, multi-angle view of the threat and its most durable indicators.


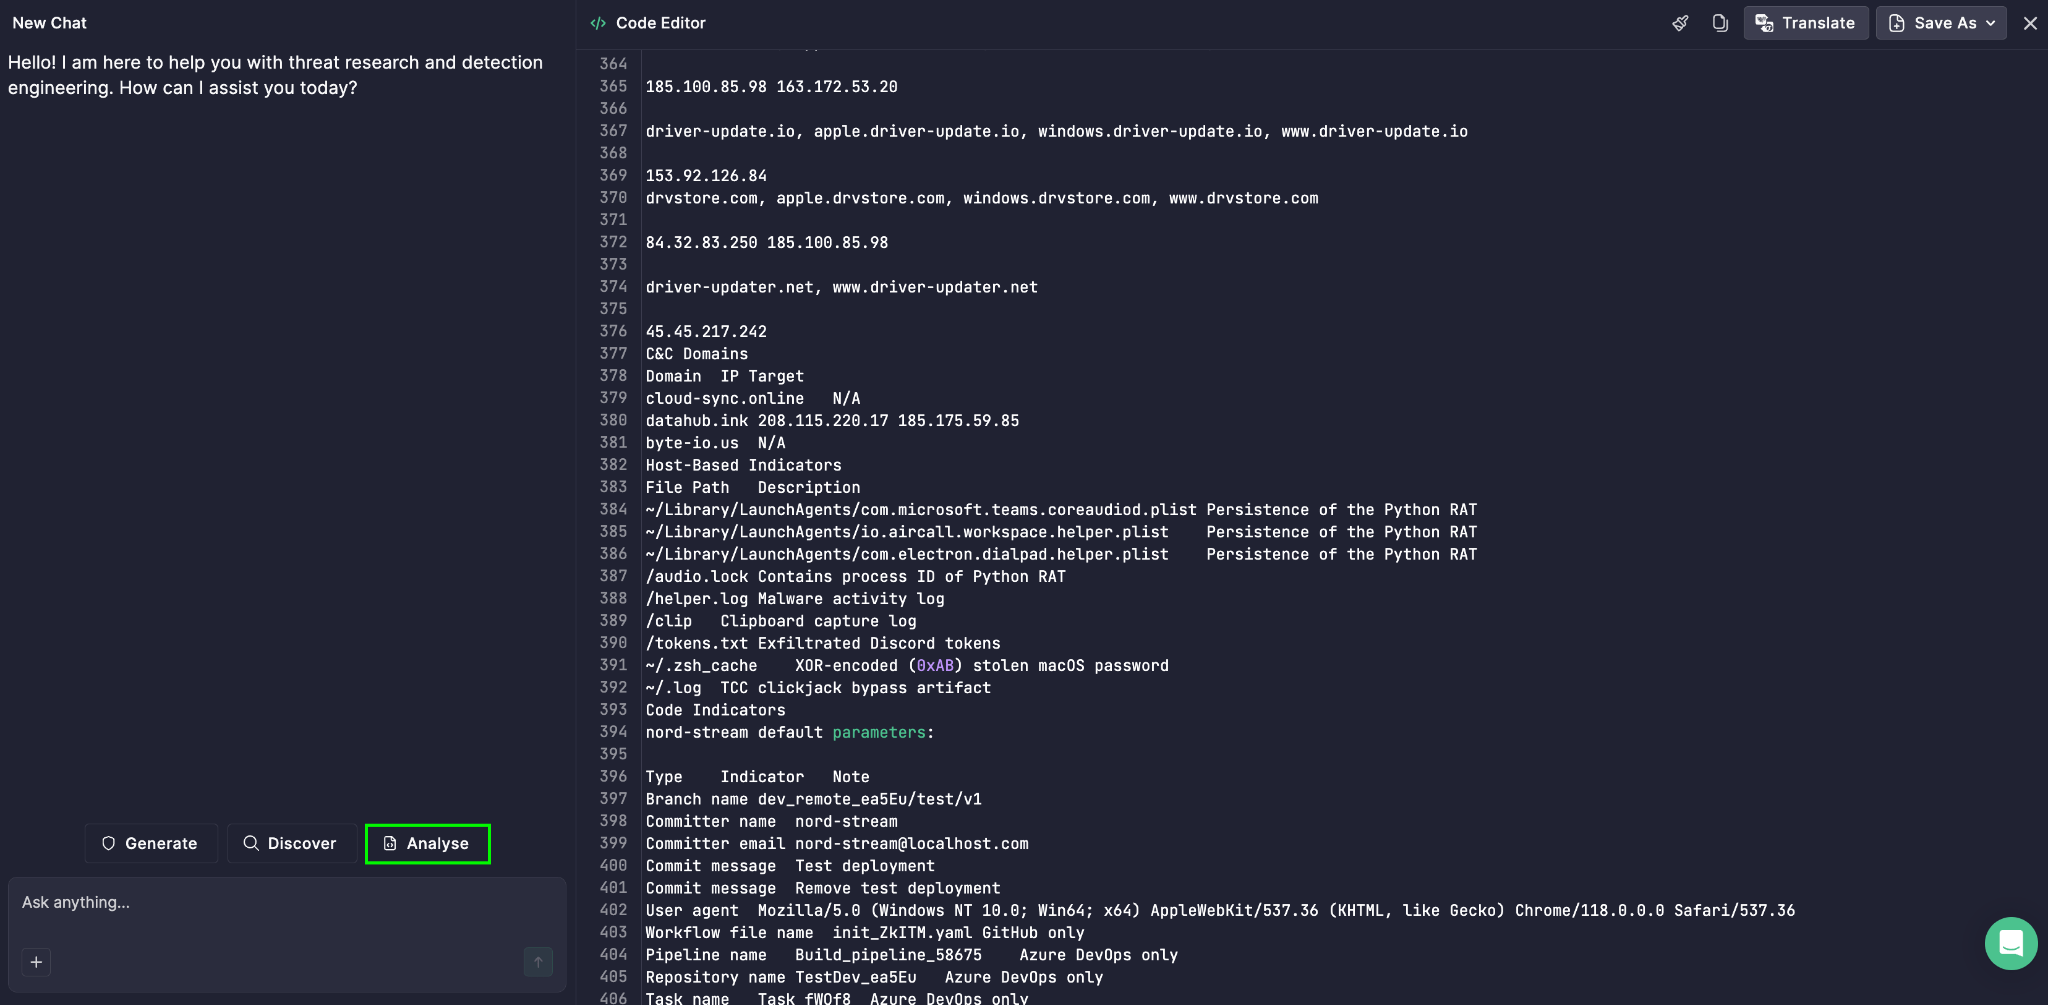
The post Pyramid of Pain in Deep Threat Research: What Really Hurts the Adversary appeared first on SOC Prime.

Cyber Kill Chain in Deep Threat Research: Stage-by-Stage Attack Visibility

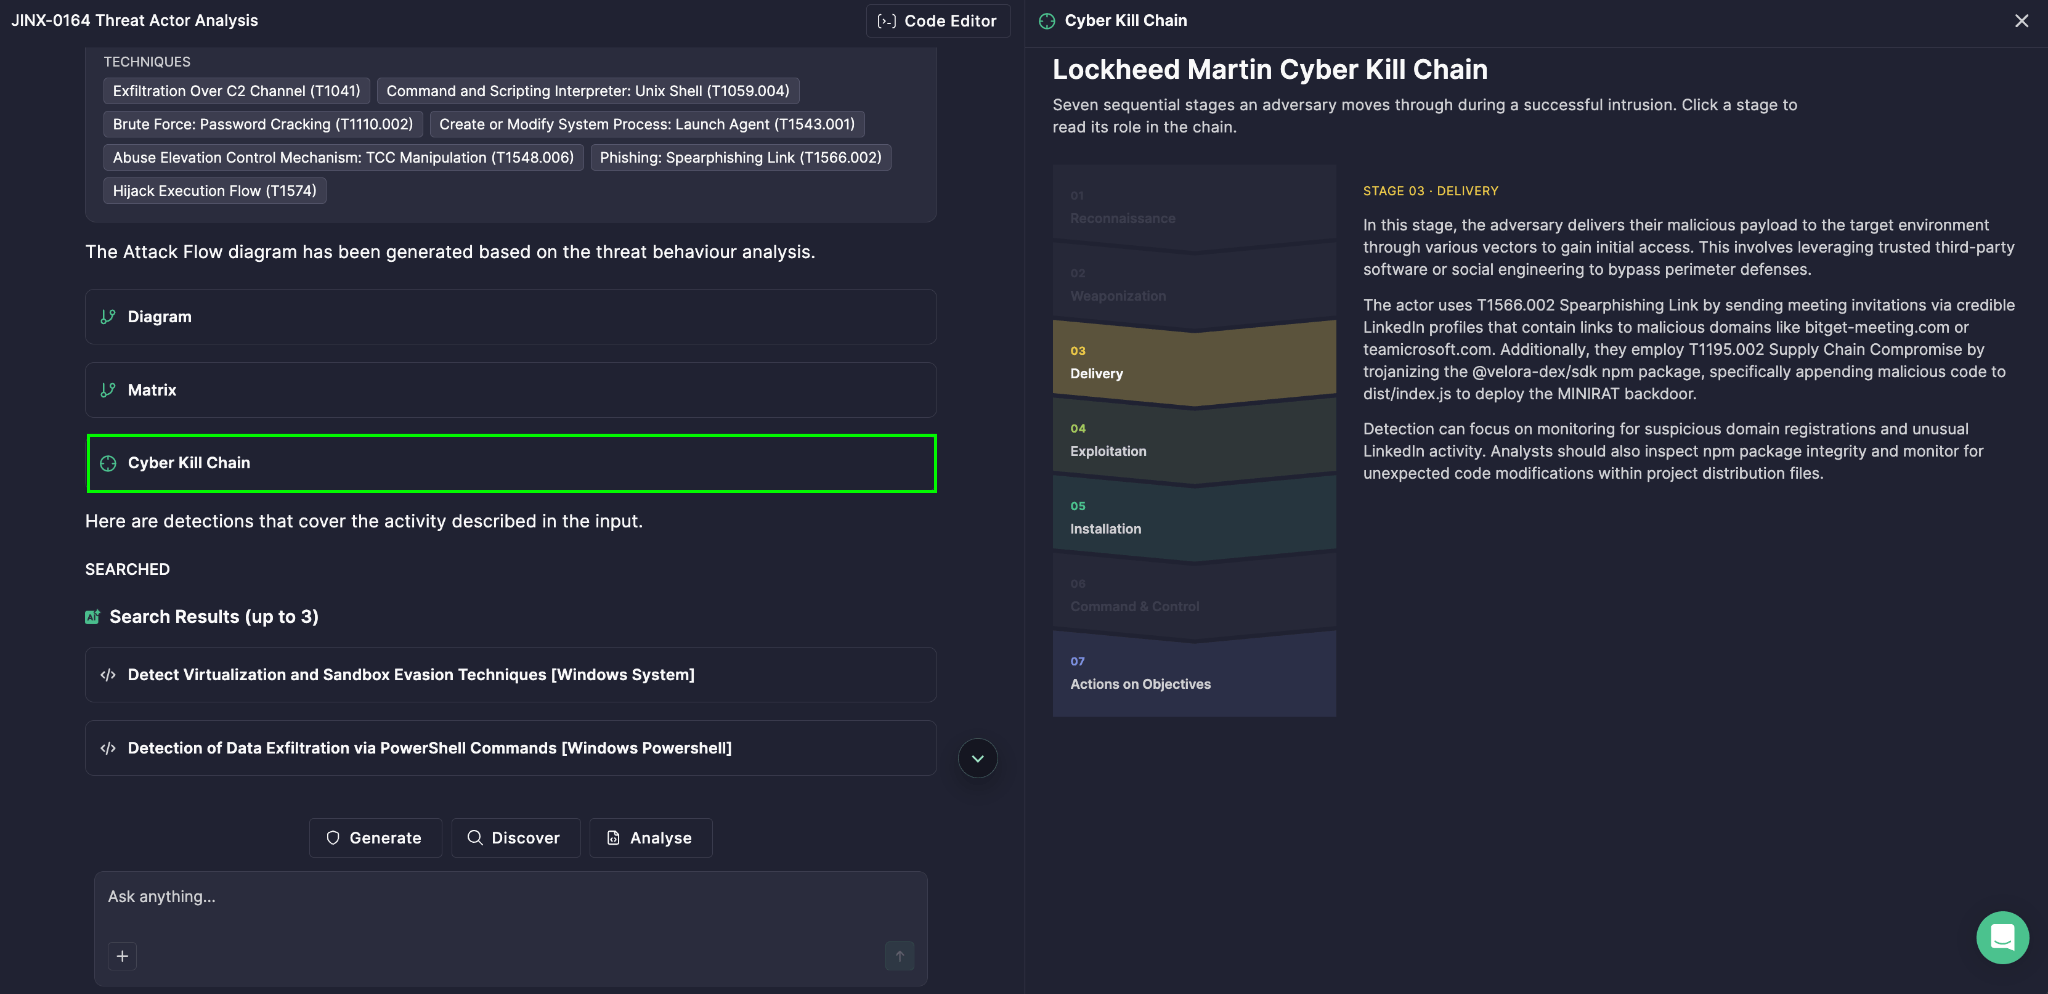
Understanding how an attacker moves through your environment matters just as much as knowing that they got in. That’s why Prime Architect’s Agentic Threat Research module visualizes attacks using the Cyber Kill Chain — generated automatically as part of Deep Threat Research analysis, giving your team a clear, stage-by-stage map of adversary behavior built directly from the threat report you provide.

Understanding the Framework

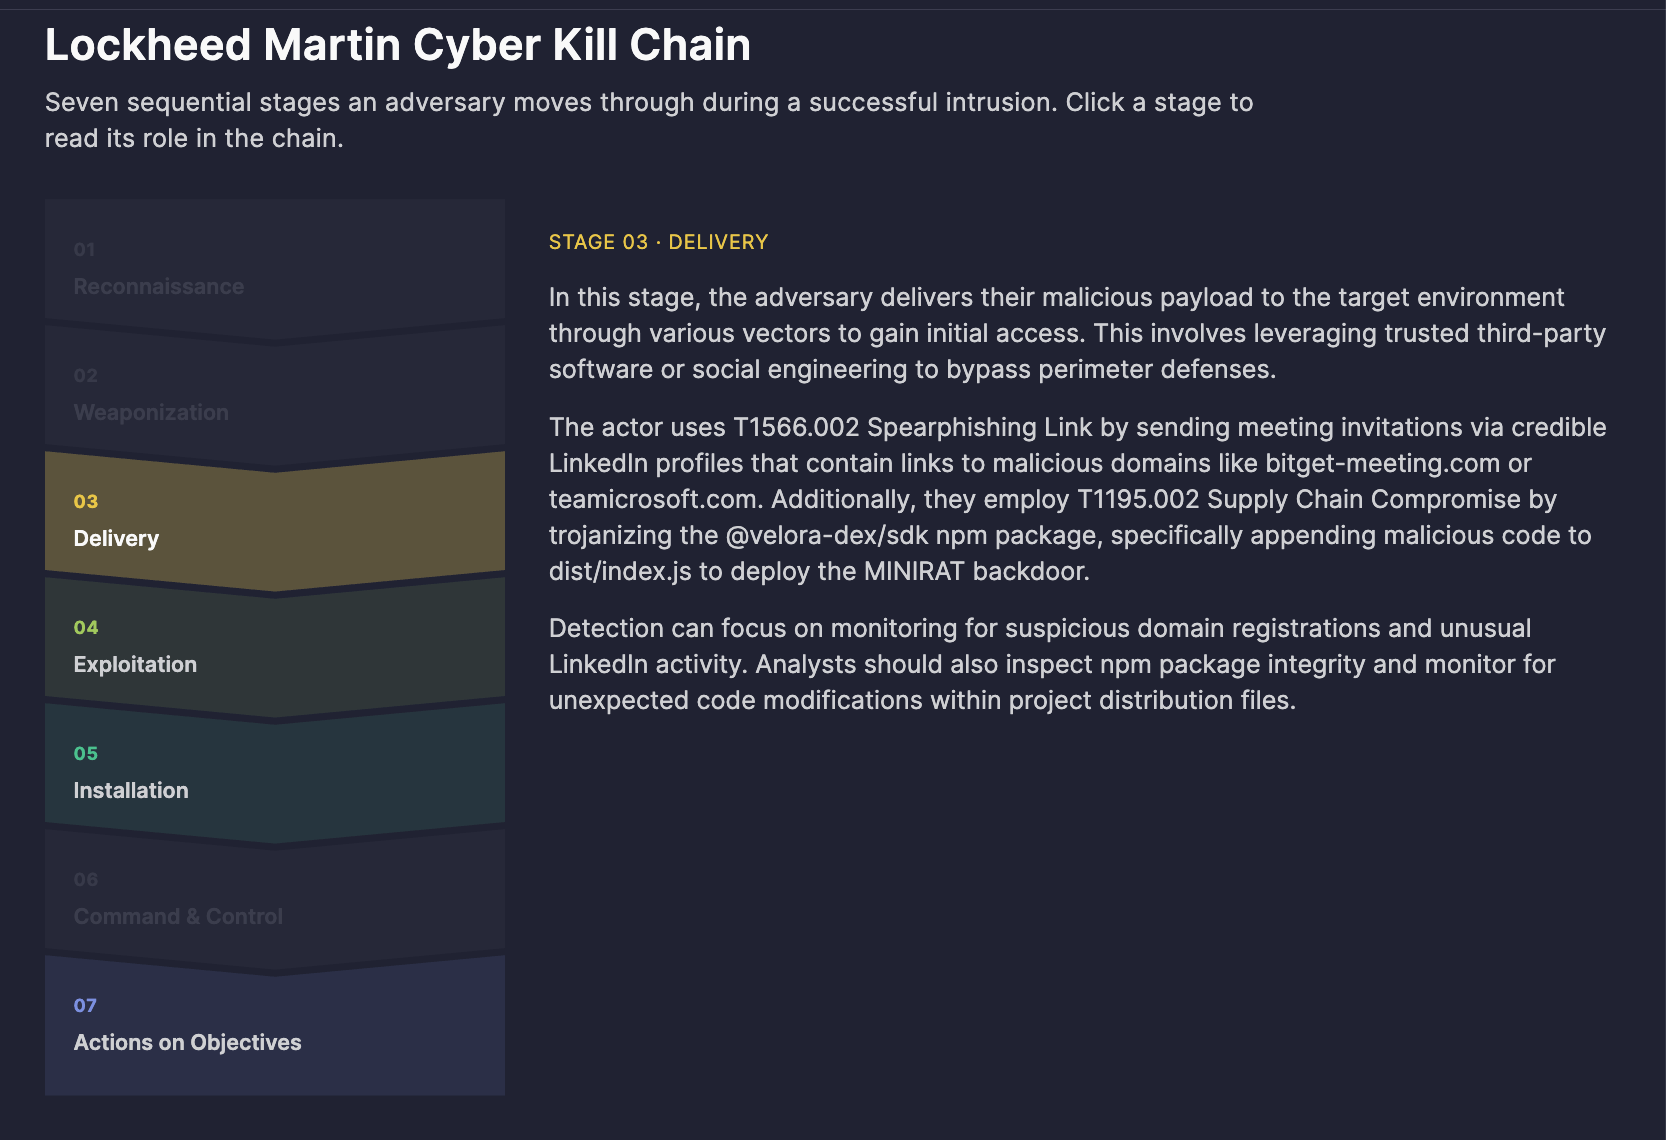
The Cyber Kill Chain is a model developed by Lockheed Martin that describes the sequence of stages an attacker moves through during a successful intrusion. The concept borrows its name from military terminology — a “kill chain” describes the structure of an attack, from target identification to engagement — and was adapted for cybersecurity to structure the full lifecycle of an attack, from initial reconnaissance to the achievement of the adversary’s ultimate objective.

The core value of the Lockheed Martin Cyber Kill Chain lies in a simple but powerful idea: an intrusion is not a single event, it’s a chain of dependent steps. If defenders can detect or disrupt the attacker at any link in that chain, the entire intrusion can be stopped before real damage occurs. This reframes defense from “prevent every possible attack” to “break the chain at the weakest link the attacker depends on” — a far more achievable and measurable goal.

The Cyber Kill Chain includes seven stages, each representing a distinct phase of the intrusion lifecycle:

  • Reconnaissance — the attacker researches and identifies potential targets
  • Weaponization — a malicious payload is crafted or configured
  • Delivery — the payload is transmitted into the target environment
  • Exploitation — a vulnerability is triggered to achieve code execution
  • Installation — the attacker establishes persistence
  • Command & Control  — a communication channel is established with the compromised system
  • Actions on Objectives — the attacker achieves their ultimate goal (data theft, disruption, destruction, etc.)

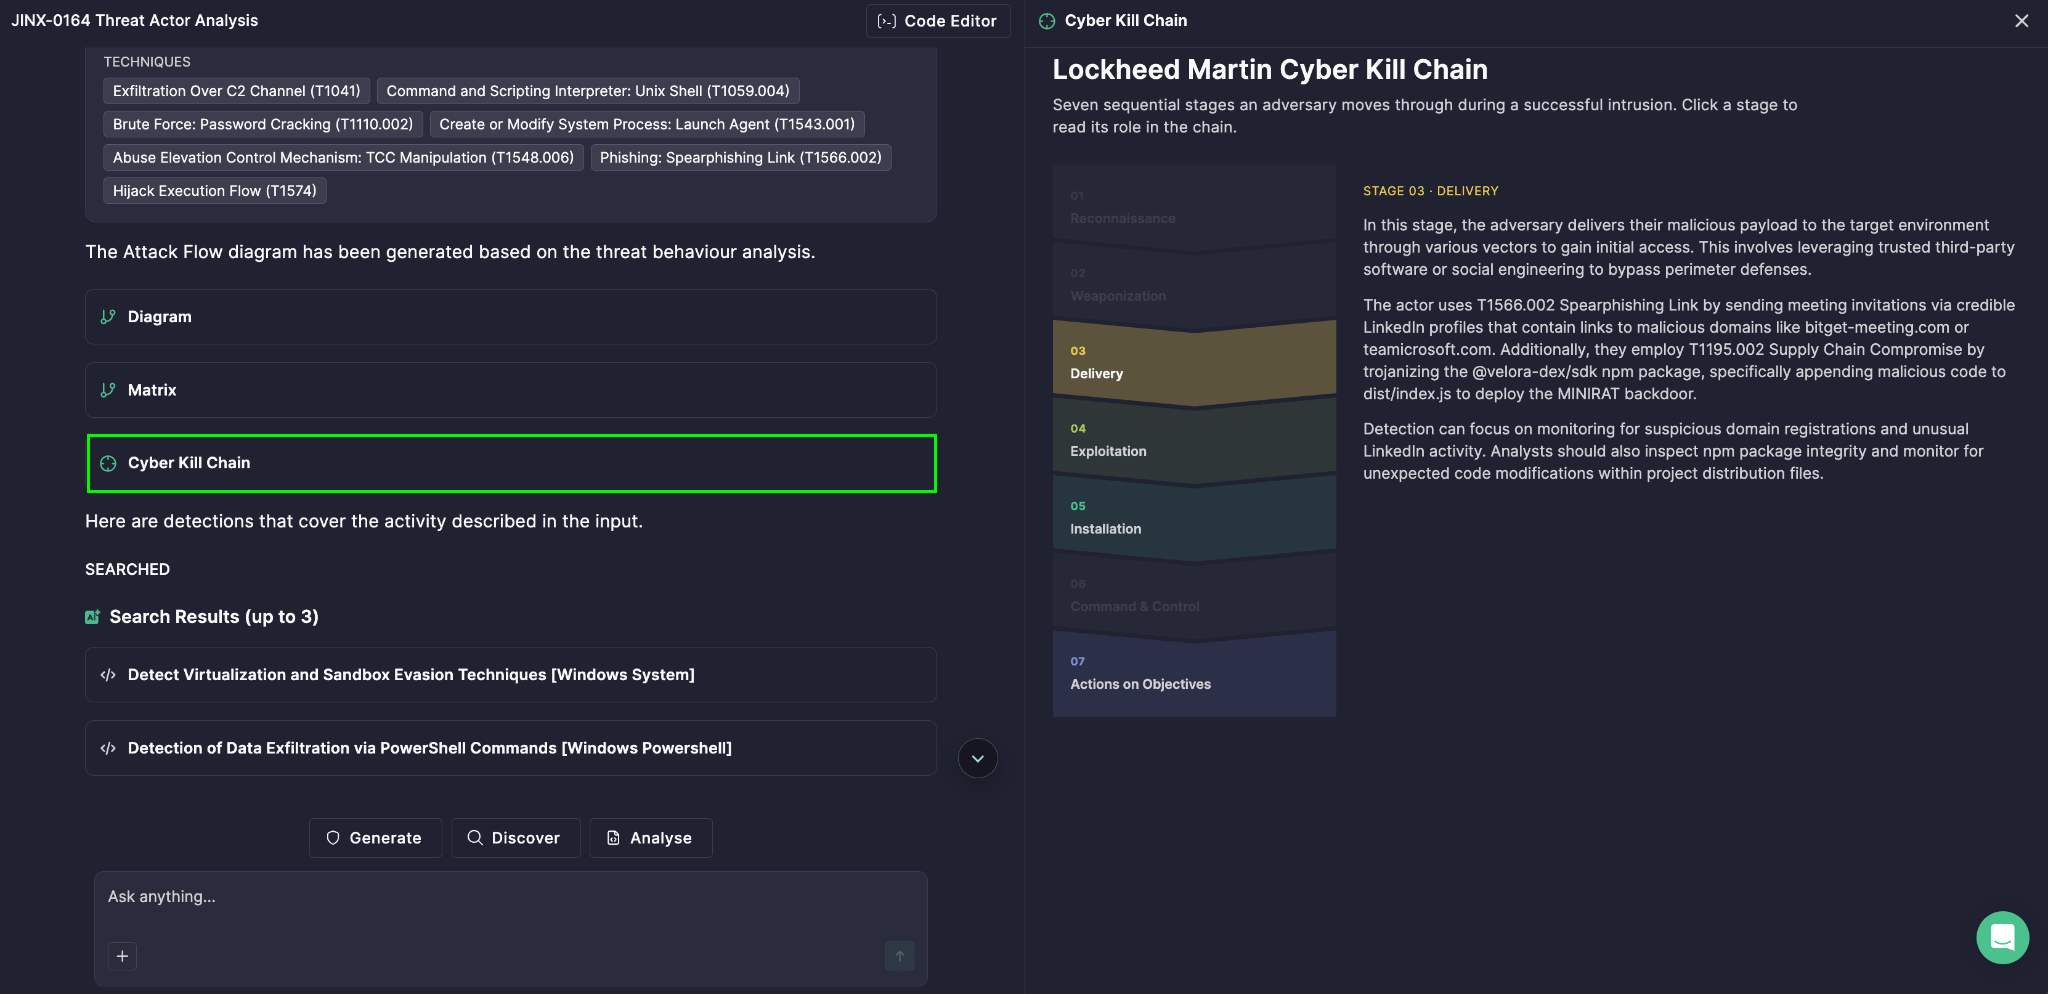
In Prime Architect, the Cyber Kill Chain visualizes these seven stages against the specific behavior of the analyzed threat, so instead of reading a dense narrative report, analysts can instantly see where a given threat sits within this widely recognized framework. Each stage is interactive — clicking it reveals its role in the chain and the typical adversary tradecraft associated with it, in the context of the threat being analyzed.

Putting the Framework to Work

1. Gap analysis and threat coverage assessment
By mapping a threat’s observed behavior onto the kill chain, teams can immediately see their threat coverage — which stages are well-monitored and which represent blind spots. This turns a static report into an actionable defense-planning tool.

2. Detection engineering prioritization
Knowing exactly which stage lacks visibility helps detection engineers prioritize new rules and analytics where they’ll have the most impact, rather than building detections evenly (and inefficiently) across the entire attack surface.

3. Incident response and triage
During live investigations, mapping observed indicators to a kill-chain stage helps responders quickly estimate how far an intrusion has progressed — informing urgency and containment strategy.

4. Security awareness and reporting
The visual, stage-based format makes it easier to communicate attack narratives to non-technical stakeholders and leadership, since the model is an industry standard many already recognize.

5. Control investment justification
Recurring gaps at the same stage across multiple analyzed threats can justify budget for specific control investments (e.g., email filtering for Delivery, EDR for Installation).

How to Generate It

  1. Open Prime Architect and go to the Agentic Threat Research mode.
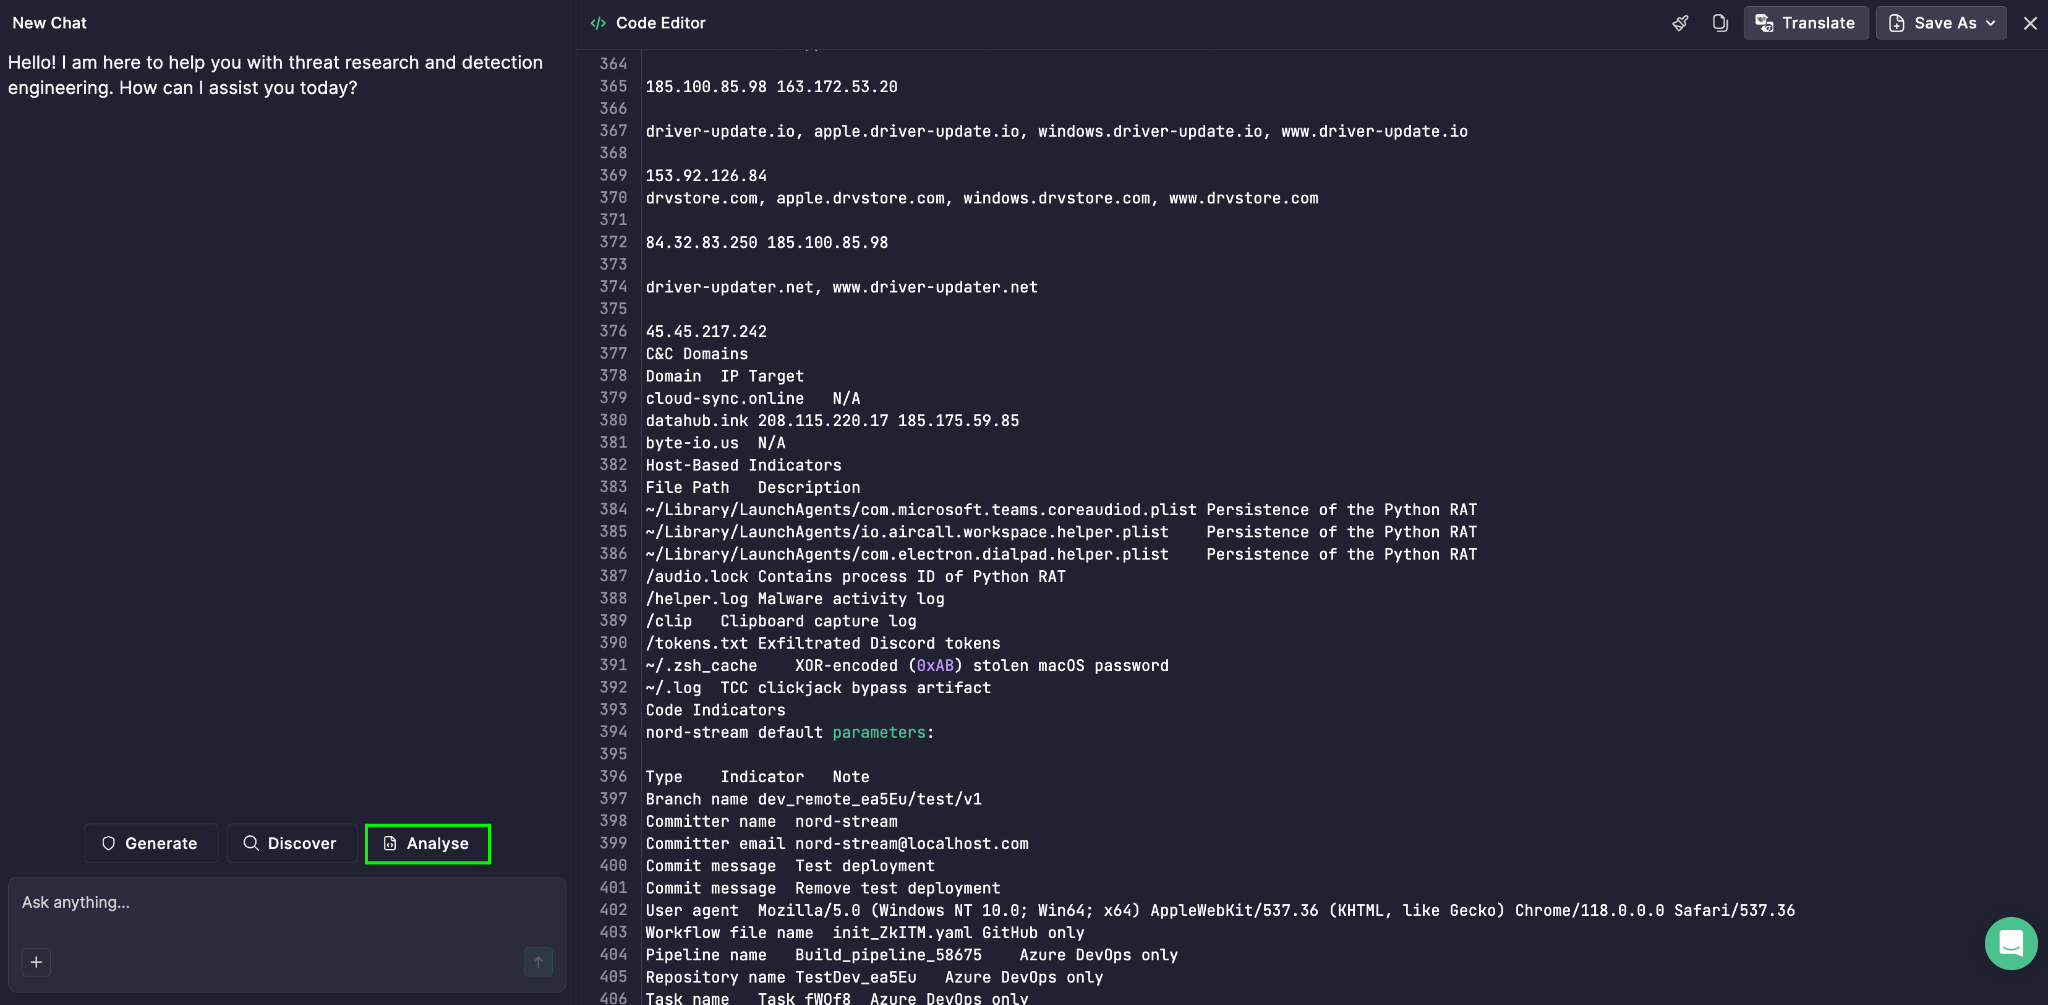
  2. Click Code Editor in the upper-right corner and paste the text of your threat report. 
  3. Select Analyze.
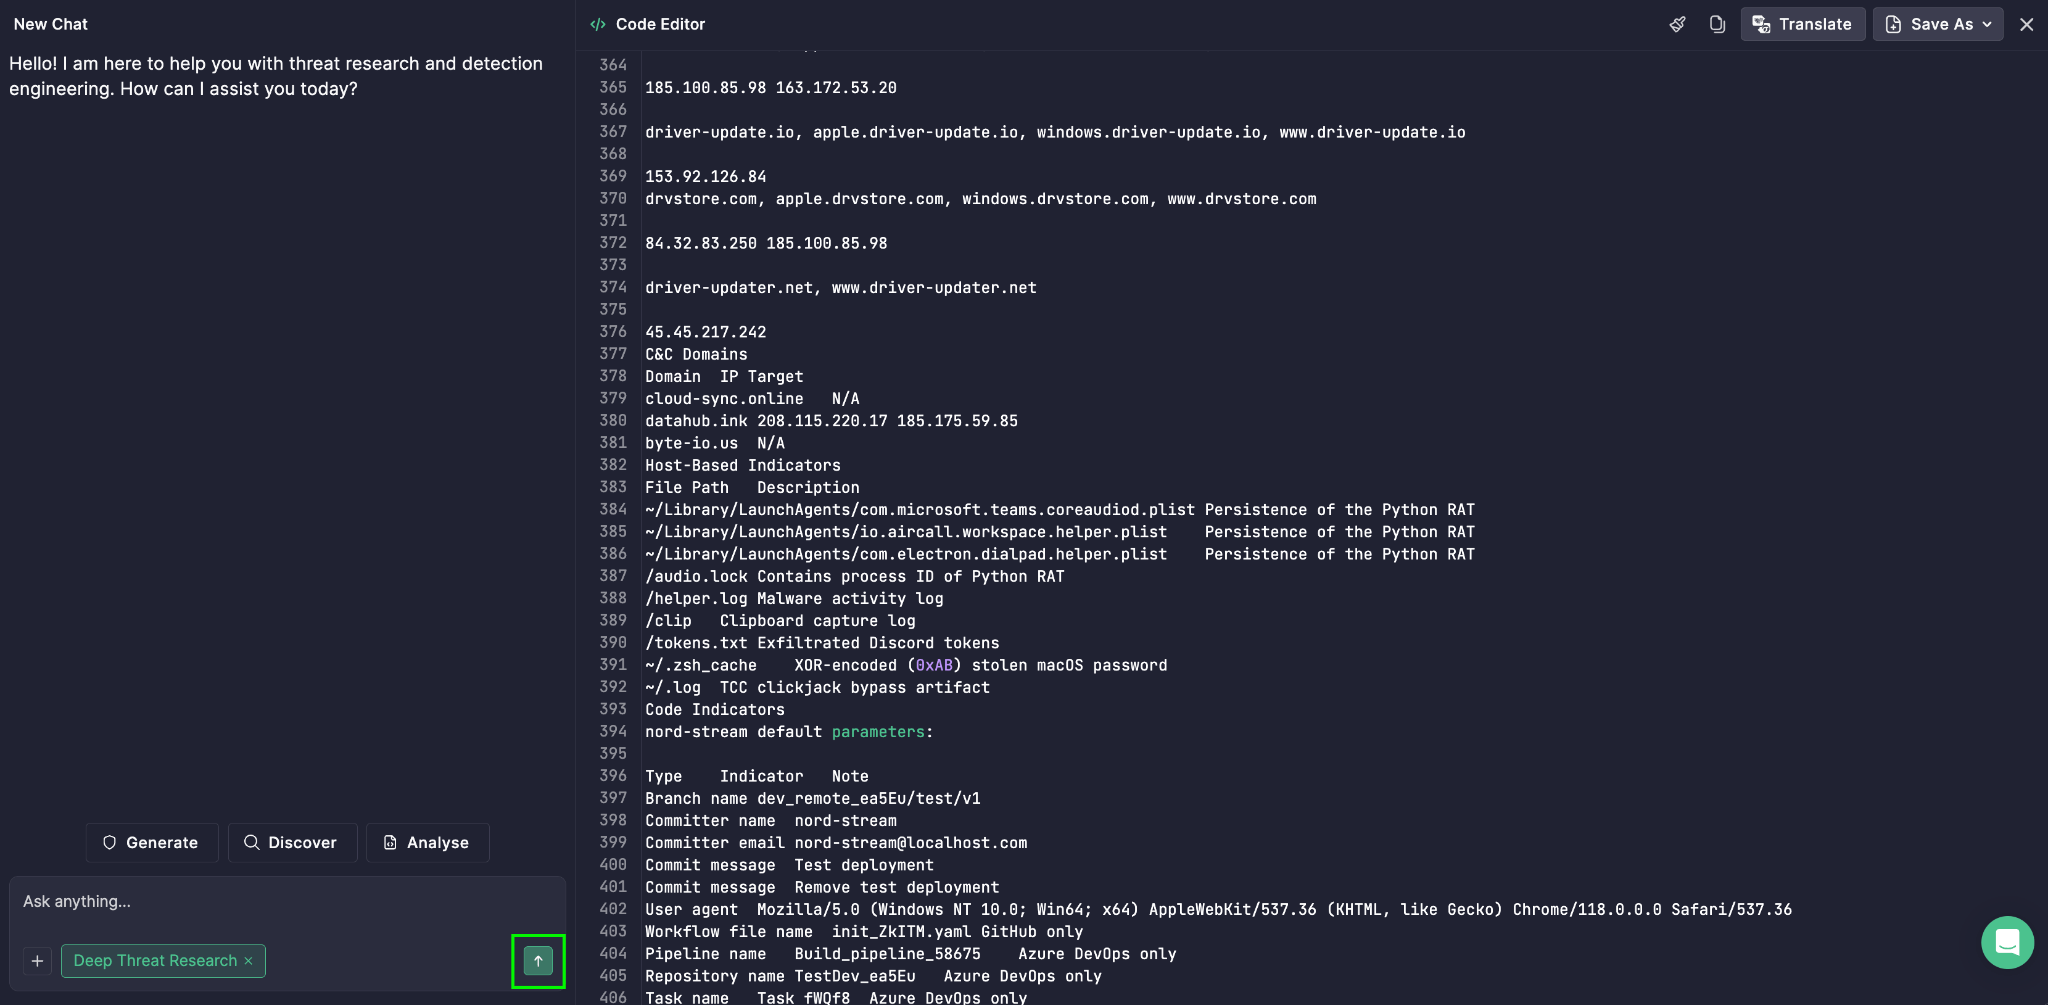
  1. Choose Deep Threat Research from the list.
  2. Click the Enter icon to run the analysis.

The Cyber Kill Chain then appears alongside other outputs, giving your team a complete, multi-angle view of the threat.


The post Cyber Kill Chain in Deep Threat Research: Stage-by-Stage Attack Visibility appeared first on SOC Prime.
Projects in Agentic Threat Research: Context That Sticks

Every investigation starts the same way — re-explaining your environment, your log sources, your detection standards, before you can even get to the actual analysis. Multiply that setup tax across every new chat you open for the same investigation, and you’re spending more time re-briefing the AI than hunting threats.

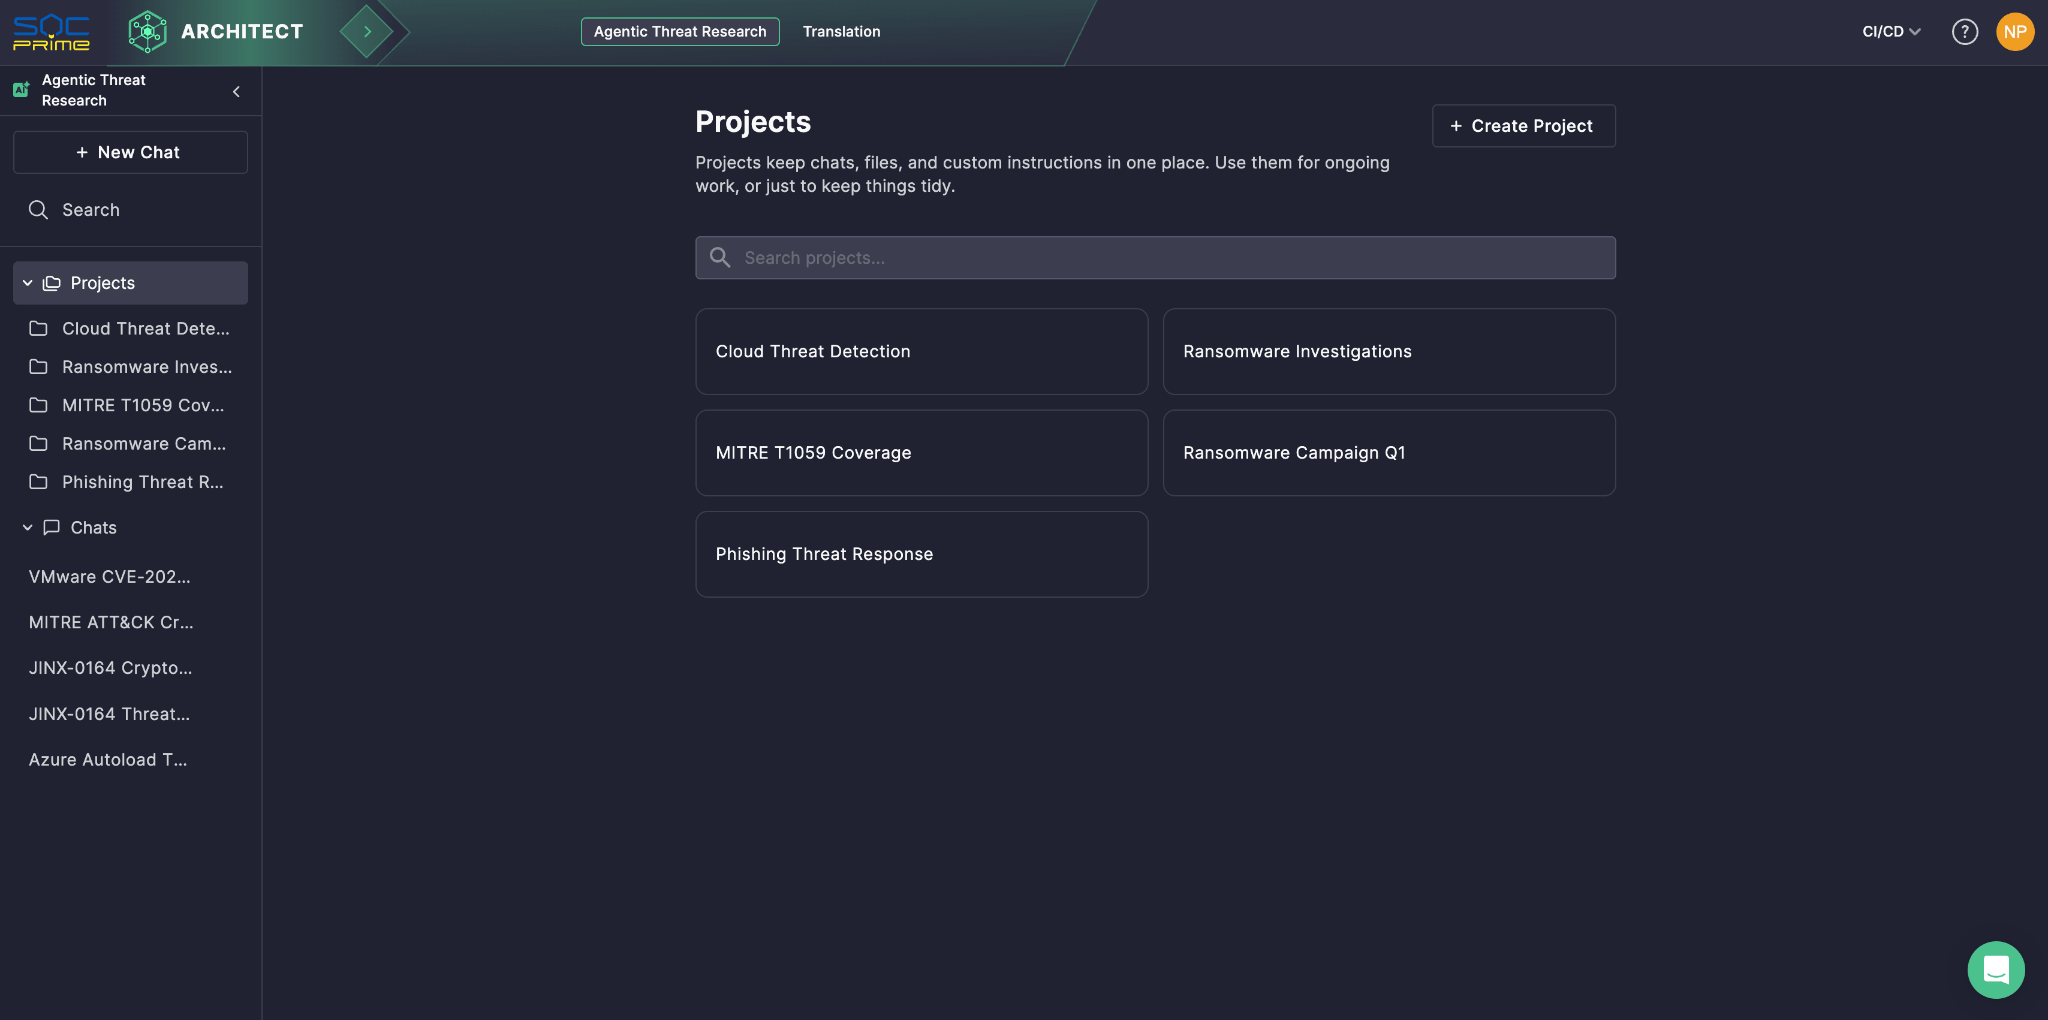
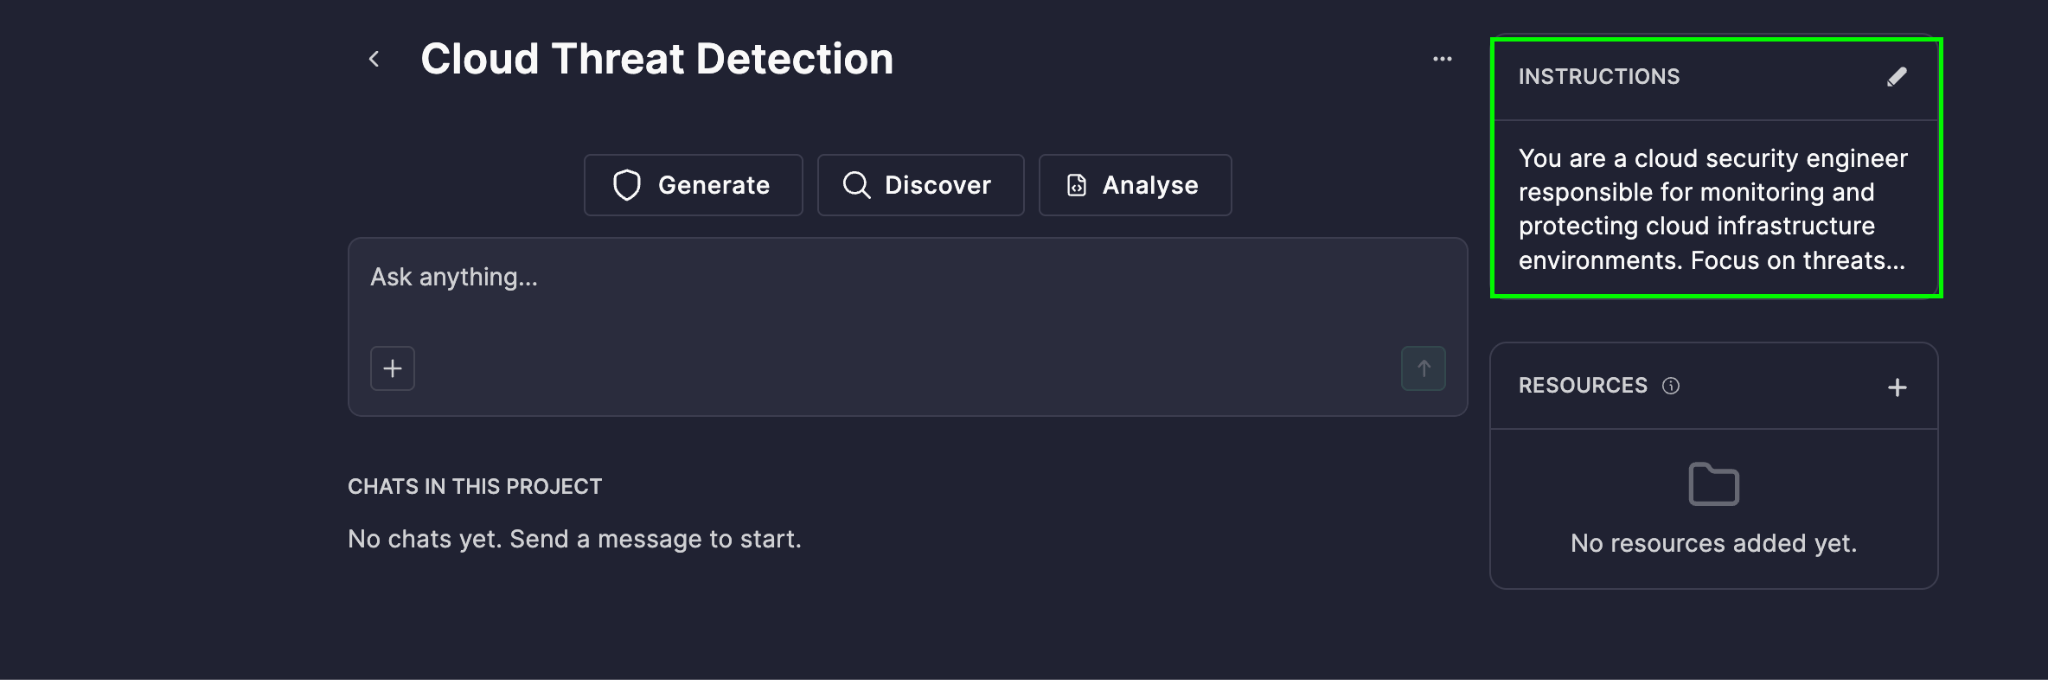
Projects solves this. Available within Agentic Threat Research — the AI-assisted workspace in Prime Architect for detection engineering and threat research — Projects let you group multiple chats under a single shared context, so you only have to set the stage once. Define your data schema, log sources, detection structure, and expected output up front, and every chat in that project automatically inherits it. No more re-pasting the same background into every new session — the AI already knows how your environment works before you type your first question.

Think of a project as a workspace built around a specific investigation focus — a threat campaign, your or a customer environment, a detection engineering initiative, an ongoing incident. Everything the AI needs to reason correctly about that focus lives in one place, and every chat inside it starts from that same, fully-briefed baseline. Projects sit right in the left panel of Agentic Threat Research alongside your regular chats, and everything you already rely on there — custom prompts as well as the built-in Agentic AI tools — works the same way inside a project, just with your context already applied.

Contact Sales

Why It Matters

  • Consistency across your own investigations. Every chat you open inside a project starts from the same baseline context, so your results stay comparable and repeatable across sessions, instead of depending on what you happened to type into the prompt that day.
  • Faster investigations. Skip the setup tax entirely. Open a new chat and get straight to the analysis — the context is already loaded, so the AI can go from question to answer instead of question to clarifying-question.
  • Institutional knowledge, built in. Upload your internal playbooks, incident reports, environment documentation, and other security-related reference materials so the AI reasons with your organization’s actual standards and history, not generic assumptions about how a SOC should work.
  • Precision by design. Set rules once — clarify assumptions before acting, require precise technical language, suggest tuning ideas for noisy detections — and every chat in the project follows them automatically, without you having to repeat yourself.
  • A dedicated workspace per investigation. Keep separate projects for separate focuses — a threat campaign, your or a customer environment, a detection engineering initiative — so the context loaded into each one is always exactly what that investigation needs, without unrelated work affecting it.

A Quick Example

Say you’re running a project focused on lateral movement detection. You attach your data schema so the AI understands your field naming conventions, list out your log sources (EDR, VPN, identity provider, and firewall logs) so it knows what evidence is actually available, and upload your detection structure and expected output template so every finding comes back in the same format you use for triage. You also drop in a couple of relevant internal playbooks and prior incident reports covering similar activity. From that point forward, every new chat you open in that project can answer questions like “does this authentication pattern match known lateral movement TTPs in our environment?” grounded in your actual data model and your own case history — not a generic response — without you having to re-explain any of it.

Getting Started

  1. Create a project. In Prime Architect, go to the Agentic Threat Research mode, select Projects in the left panel, and then select Create Project. Give it a name.
  1. Define the shared context. Pick either or both:
  • Instructions: Click the pencil icon in the Instructions section and write a prompt describing how the AI should behave in this project — for example, your data schema, log source details, detection structure and expected output format, or key rules like clarifying assumptions and using precise technical language. Select Save. You can revisit and edit this anytime via the same pencil icon.
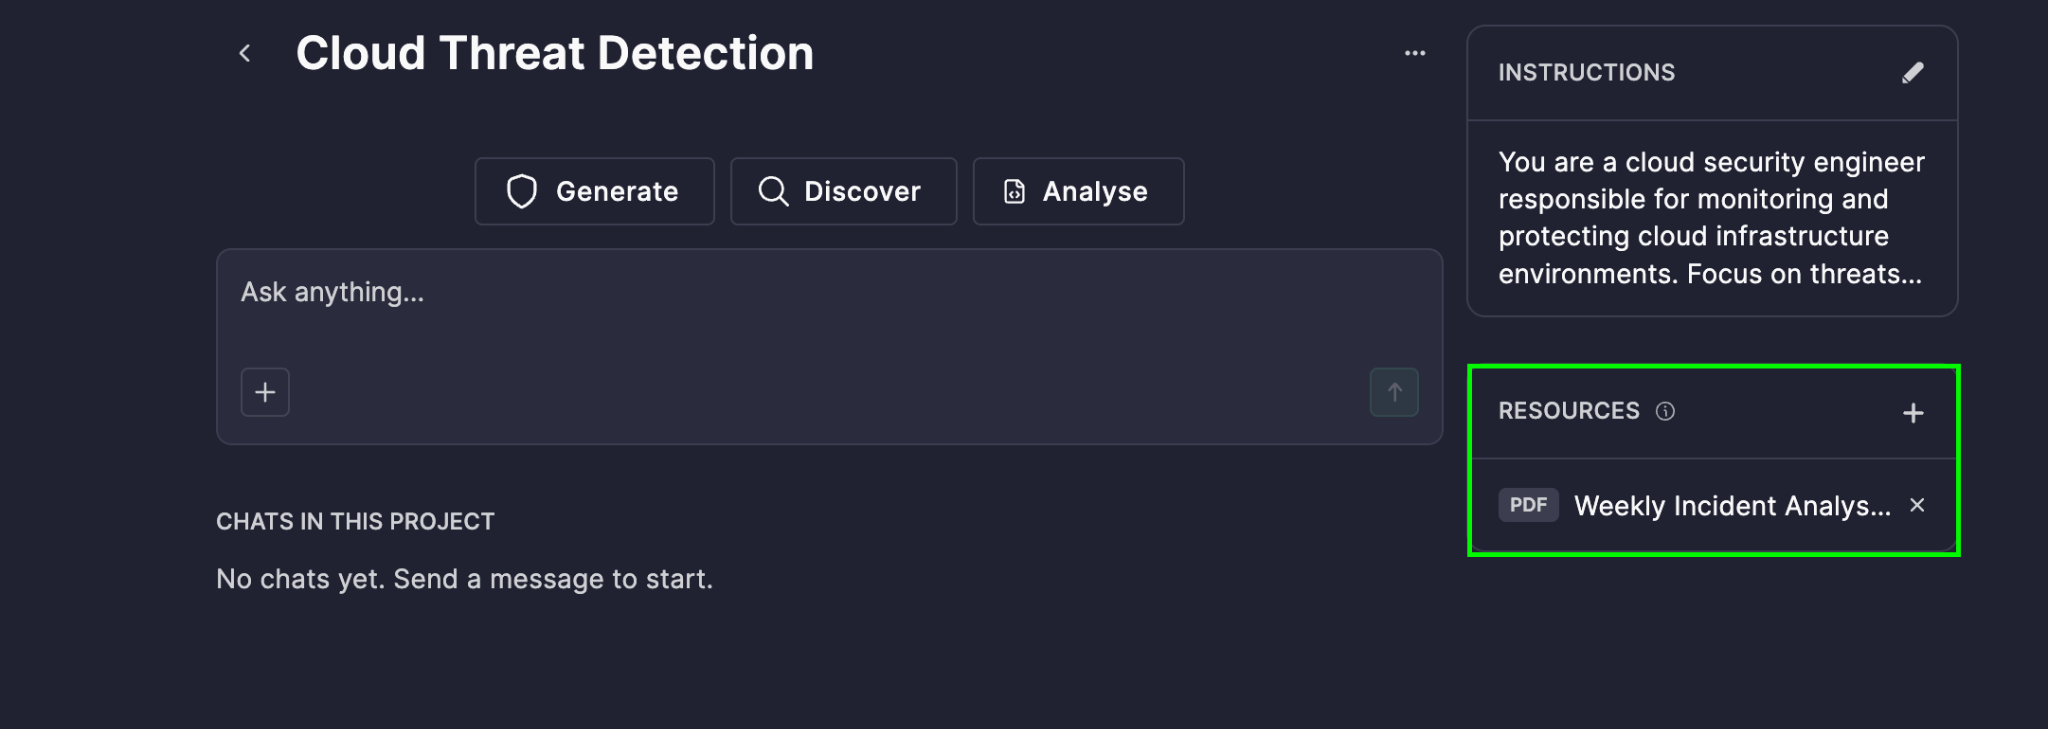
  • Resources: Click the plus (+) icon in the Resources section, select Upload Files, and attach your reference material — playbooks, incident reports, environment docs, or other security references. You can upload up to 5 files, each up to 15 MB and 500k tokens. Supported formats: PDF, TXT, CSV, JSON, PNG, JPG/JPEG (PDFs up to 1,000 pages). 

Everything you add here applies automatically to every chat in the project.

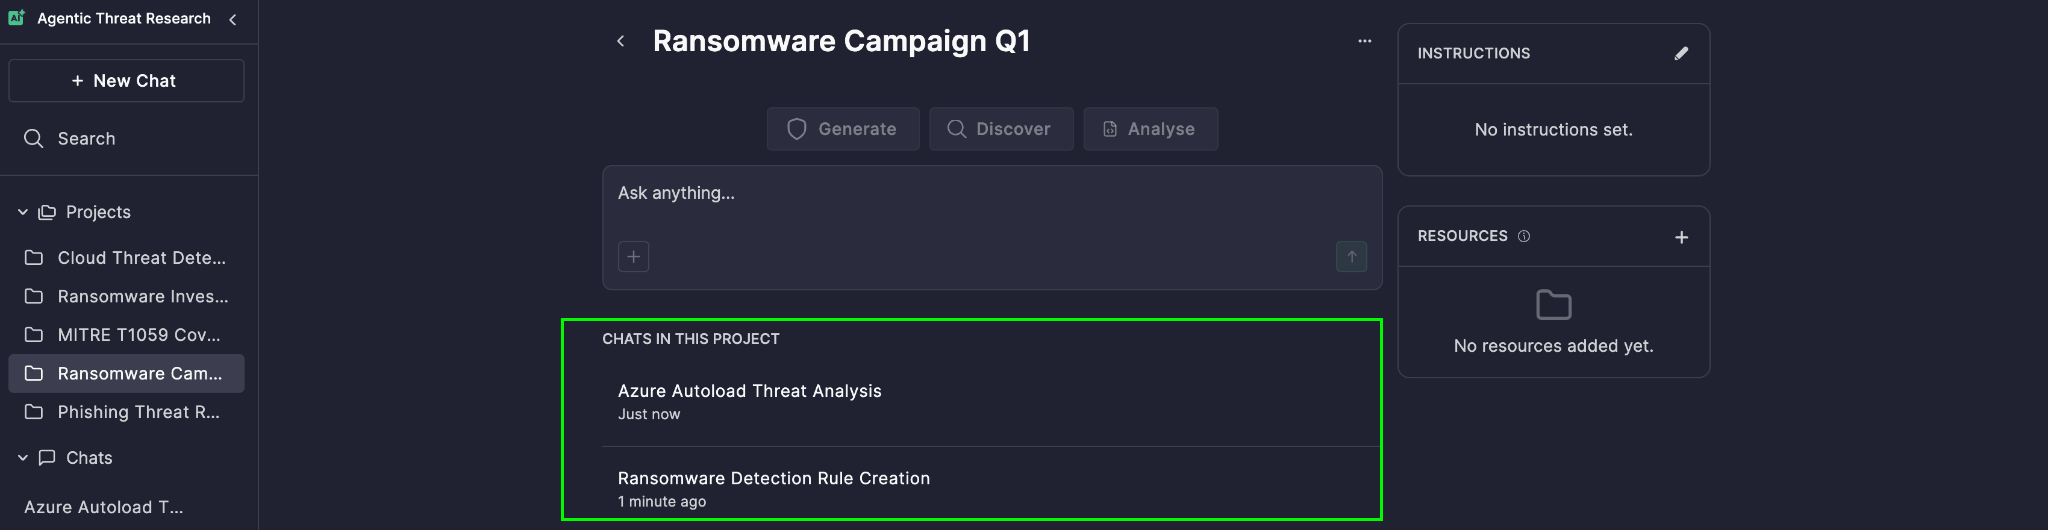
  1. Start working. Open the project and start a new chat — it inherits the context immediately, no extra steps required. All chats you create within the project are grouped together and available under the chat panel, so your investigation history stays organized in one view instead of scattered across a general chat list.
  1. Keep it organized. As a project grows, you can rename or delete individual chats at any time — just click the three-dot menu next to a chat and select the option you need. This makes it easy to keep active investigations clearly labeled and archive ones that are closed out, without losing the shared context that the rest of the project still relies on.

Set the context once. Investigate faster, every time after.


The post Projects in Agentic Threat Research: Context That Sticks appeared first on SOC Prime.

From Raw Threat Reports to Actionable Defense: AI-Powered Deep Threat Research

Security teams are drowning in threat reports. Every week brings a new advisory, a new vendor write-up, a new blog post describing the latest campaign — and every one of them demands hours of manual reading, cross-referencing, and translation into something your SOC can actually act on. Deep Threat Research changes that equation entirely.

Deep Threat Research is an agentic AI tool available within Agentic Threat Research mode in Prime Architect. It takes any threat report and instantly transforms it into structured, decision-ready threat intelligence — complete with a clear threat summary, precise MITRE ATT&CK mappings, and a full set of interactive visualizations that show exactly how an adversary operates. What used to take an analyst hours of manual triage now happens in minutes, freeing your team to focus on what matters most: threat detection and threat mitigation.

What Deep Threat Research Solves

Every threat report contains value, but that value is locked inside dense paragraphs of prose. Deep Threat Research unlocks it automatically. It reads the report the way your most experienced analyst would — extracting the adversary’s tactics, techniques, and procedures, identifying relevant indicators, and mapping everything against the MITRE ATT&CK framework — then hands you a complete intelligence package: investigation guidance, mitigation recommendations, response actions, associated threat actors, and even AI-generated detection rules ready for deployment.

Instead of starting from a blank page, your team starts from a fully-formed picture of the threat: who’s behind it, how it moves, what it touches, and how to stop it.

Contact Sales

What You Get

Once an analysis completes, results are generated and appear one after another. Some sections are ready to read right away, while others display as tiles you simply click to open and explore in more detail — just scroll down to move through the full analysis. Overall, Deep Threat Research organizes its findings into clear, digestible sections:

  • Summary – the essential facts of the threat, distilled from the report
  • Investigation – guided next steps for analysts
  • Mitigation – best-practice actions to reduce impact
  • Response – recommended steps once malicious activity is confirmed
  • Actors – the threat actors tied to the activity
  • MITRE ATT&CK Techniques – the specific behaviors and techniques adversaries used, mapped directly to the framework
  • Detections – existing SOC Prime Platform detections plus new AI-generated rules, ready to copy, translate into your SIEM’s language, validate, or save straight to your repository
  • Simulation – ready-made simulations of the malicious activity for testing your defenses

On top of that, four interactive visualizations bring the intelligence to life:

  • Attack Flow – the adversary’s full attack sequence based on MITRE ATT&CK, viewable as a diagram or matrix and exportable as MMD
  • Cyber Kill Chain – maps the threat across all seven Lockheed Martin stages, from Reconnaissance to Actions on Objectives, so you can spot detection opportunities at every phase
  • Pyramid of Pain – breaks down every extracted indicator into six tiers, from Hash Values and IP Addresses up through Domain Names, Network/Host Artifacts, Tools, and TTPs, so you can see at a glance how resilient your detection coverage really is
  • Diamond Model – connects the four pillars of any intrusion — Adversary, Capability, Victim, and Infrastructure — and shows how they link together

Getting Started

Getting from a raw report to full threat intelligence takes just a few steps:

  1. Open Prime Architect and select the Agentic Threat Research mode.
  2. Click Code Editor in the upper-right corner and paste in the text of your threat report. 
  3. Select Analyze.
  1. Choose Deep Threat Research from the list of analysis types.
  2. Click the Enter icon to run the analysis.

That’s it. Within moments, your results appear — summary, investigation and mitigation guidance, ATT&CK mappings, detections, simulation, and all four visualizations, ready to explore, click into, and act on.

The Value You Gain

Deep Threat Research doesn’t just summarize a report — it operationalizes it. By pairing AI-driven analysis with the structure of MITRE ATT&CK and the SOC Prime Platform’s detection library, it turns every threat report your team encounters into a springboard for faster investigation, sharper mitigation, and stronger detection coverage. Less time reading. More time defending.


The post From Raw Threat Reports to Actionable Defense: AI-Powered Deep Threat Research appeared first on SOC Prime.

Bring Your Files Into the Conversation

Get more relevant, more accurate answers from Prime Architect by giving your AI agent the context it needs — no more copy-pasting excerpts or describing an incident from memory. In Prime Architect, every chat is a space to work through detection engineering and threat research tasks with AI, whether you’re writing a custom prompt or running one of the built-in Agentic AI tools. Now you can bring your own reference materials into that conversation directly: upload playbooks, incident reports, environment documentation, screenshots, and other reference materials into your chat, and let the AI work from the real source.

Why It Matters

Better context means better output. When an AI tool works from your actual playbook, incident report, or environment documentation, its analysis is grounded in your real data rather than a secondhand summary. You can write your message and attach files together, and the AI agent treats the attached files as context for that message — whether you’re running a custom prompt or one of the purpose-built AI tools in Prime Architect. Instead of retyping the key details of an incident or manually condensing a lengthy report before you can even start your analysis, you simply hand the AI the source document and move straight to the insight.

Flexibility for every workflow. Not every analyst wants to work the same way. That’s why there are three different ways to attach a file — a manual upload button, drag and drop, and clipboard paste — so you can choose whichever fits your current task and habits. Dragging a report straight from your desktop, pasting a screenshot you just captured, or browsing for a file through the upload menu all lead to the same result: your AI agent working with richer, more accurate context.

Built for how security teams actually work. Detection engineers and threat researchers rarely start from a blank page — they start from an existing playbook, a prior incident write-up, environment documentation, or a screenshot of a suspicious event. This feature meets that reality head-on, letting you carry that material directly into your conversation instead of translating it into a prompt by hand.

How to Add a File

There are three simple ways to get a file into your chat message in Prime Architect.

Option 1: Upload manually

  1. Click the + icon in the chat input area and select Add Files and Images.
  1. Select a file from your device.
  2. The file appears in the input area and begins uploading.

Option 2: Drag and drop

  1. Locate the file on your computer — for example, in Finder or File Explorer.
  2. Drag the file into the chat panel in Prime Architect. You can drop it anywhere in the chat window, including the message history area or the input field.
  1. The file appears in the input area and begins uploading.

Option 3: Paste from clipboard

  1. Copy an image, screenshot, or file — take a screenshot, copy an image from another app, or select a file in your OS file explorer and press Cmd+C / Ctrl+C.
  2. Click into the chat input field to make it active.
  3. Paste using Cmd+V / Ctrl+V.
  4. The file appears in the input area and begins uploading.

A few things to know: You can attach up to 3 files per message, with a maximum size of 5 MB per file. Supported formats include PDF, TXT, CSV, JSON, PNG, and JPG/JPEG — covering the most common document, data, and image formats used in security workflows. Depending on the size of your files, it may take a moment to process them before they’re ready to be used as context, especially for documents with many images or visual elements.

Make It Part of Your Workflow

Whether it’s a playbook pulled from your files, a screenshot of a suspicious alert, or an incident report you’ve had open all day, getting it into Prime Architect takes just a click, a drag, or a paste. Stop summarizing your evidence — start uploading it, and let your AI agent do the deeper work.


The post Bring Your Files Into the Conversation appeared first on SOC Prime.
LogTotal Public Preview: Free, Private Security Log Analysis in Under a Minute

Security teams don’t have a data shortage — they have a data flood. A single incident can throw off hundreds of thousands, sometimes millions, of log events, and making sense of them under time pressure is exactly the kind of work that breaks people and tooling alike. SOC Prime built LogTotal to take that pressure off, without asking teams to hand over the raw evidence to do it.

The problem: every “send us the logs” request is a privacy decision

Endpoint events, identity logs, cloud audit trails, syslog, Windows Event Logs, application JSON — this is the raw material of detection, hunting, and response. When something breaks, the first ask is almost always the same: send the logs.

That request used to stay inside a closed environment. Now it rarely does. Logs get attached to vendor tickets, dropped into collaboration tools, uploaded to SaaS analyzers, pasted into AI chat windows, copied into shared workspaces. Each hop widens the circle of people, systems, and jurisdictions that can see the original values.

The risk is easy to miss because logs look operational rather than confidential. In practice, one authentication event can carry a username, a source IP, a workstation name, a session cookie, and a bearer token in an Authorization header. A payment-adjacent log can contain a PAN-shaped number. A Windows file path can leak a home-directory username. A field labeled UserName or x-api-key often holds the value in plain text, even when the rest of the line looks harmless. Under GDPR and similar regimes, most of that counts as personal data — and a leaked token or key isn’t a historical record, it’s a live access path.

Refuse to share the logs and you slow down the investigation. Share them raw and you risk violating policy, contracts, or regulation. Manual redaction doesn’t scale, isn’t consistent across analysts, and often strips out the exact identifiers an investigation needs to correlate events.

This isn’t hypothetical. SOC Prime built LogTotal partly in response to HuggingFace’s July 2026 security incident, in which the team’s attempt to send roughly 17,000 events to frontier AI models was blocked by guardrails — forcing a fallback to a local GLM model with GPU and VRAM requirements most organizations simply don’t have. LogTotal is built to handle that same job — at up to 1,700,000 events — without anyone needing frontier-model access or a private GPU cluster.

Why simple redaction doesn’t hold up

Most redaction approaches fail in one of two directions.

Static masking — turning every IP into the same placeholder, every user into USER — destroys the thing that makes investigation possible: correlation. If ten failed logons all collapse to the identical token, you can no longer tell a single compromised account from a credential-spray attack hitting ten different people.

Plain find-and-replace fails the other way. It misses values in unusual encodings or nested JSON, and it over-redacts things that only look sensitive — version numbers shaped like IPs, UUIDs used as message IDs, well-known non-sensitive hostnames. Unkeyed hashing doesn’t solve it either: a raw hash of a common value can be reversed by dictionary-guessing, and identical unsalted hashes across different organizations can accidentally link unrelated incidents together.

LogTotal was built to avoid both failure modes.

How it actually works

  1. Sanitization happens locally, in your browser, before anything is sent anywhere. You can download the sanitized log at any point — you always have a clean copy of exactly what was analyzed.
  2. Your files never leave your control unsanitized, and nothing is stored. LogTotal doesn’t retain your logs after analysis, and SOC Prime has no need to — the platform isn’t training on your data.
  3. Upload in your native format. LogTotal auto-detects EVTX, CEF, JSON/NDJSON, and syslog — no manual conversion.
  4. Your sanitized events are correlated at scale. LogTotal runs them against roughly 1,000,000 detection rules and a dataset of 13,000 labels, then applies Higher Order Sigma Rules and agentic AI correlation to connect related events into a coherent picture — up to 1.7 million events, in under a minute.
  5. You get an investigation, not a dump. Results are structured as findings on the LogTotal site, not a wall of raw matches.

However, log sanitization is only the first stage of LogTotal once it’s out of the preview. Coming soon is something even more powerful: sanitized logs checked against tens of thousands of behaviour rules, with matches correlated around Higher Order Sigma rules for active threats.

Where teams can use this

  • Incident response with external retainers. Sanitize a log packet with a key you retain. The retainer can still cluster hosts, users, and addresses — and you can map tokens back internally if a specific identity needs to be named in a privileged briefing.
  • Vendor support and TAC cases. “The log file that shows the error” is famous for containing environment details unrelated to the ticket. Sanitizing before you attach it cuts accidental disclosure without turning the file into noise.
  • Detection engineering and rule testing. Sample logs are how detections get written and validated — and how production identities leak into git history, CI artifacts, and demo environments. Sanitizing fixtures once, with a key shared inside the team, keeps examples correlatable while stripping secrets.
  • Pre-SIEM or pre-lake sharing. Not every pipeline needs a commercial processor to redact a batch file. For exports, one-off hunts, and cross-team handoffs, a local sanitizer is the control people will actually use.
  • GDPR and privacy reviews. Pseudonymization isn’t a blanket exemption, but replacing identifiers with keyed tokens before a file leaves the organization is a concrete technical measure — one you can point to and describe: what was removed, what was retained, how tokens were generated, who holds the key.
  • AI-assisted analysis without exposing raw telemetry. Whether the destination is LogTotal, an internal model, or a restricted vendor environment, the question is the same: does the model need the actual password, or does it need to know a secret was present and the same user touched three hosts?

Try LogTotal

The SOC Prime Platform exists to help security teams anticipate, detect, validate, and respond to threats faster. That mission has never required collecting customer secrets. LogTotal extends it to private event analysis at community scale. 

Security teams should not have to choose between a thorough investigation and a defensible data-handling story. Sanitize first. Correlate on tokens. Keep the key. Analyze the evidence that remains.

Explore LogTotal at https://logtotal.com. 

Join the SOC Prime Platform to improve visibility into threats most relevant to your business. To help you get started and drive immediate value, book a meeting now with SOC Prime experts.


The post LogTotal Public Preview: Free, Private Security Log Analysis in Under a Minute appeared first on SOC Prime.
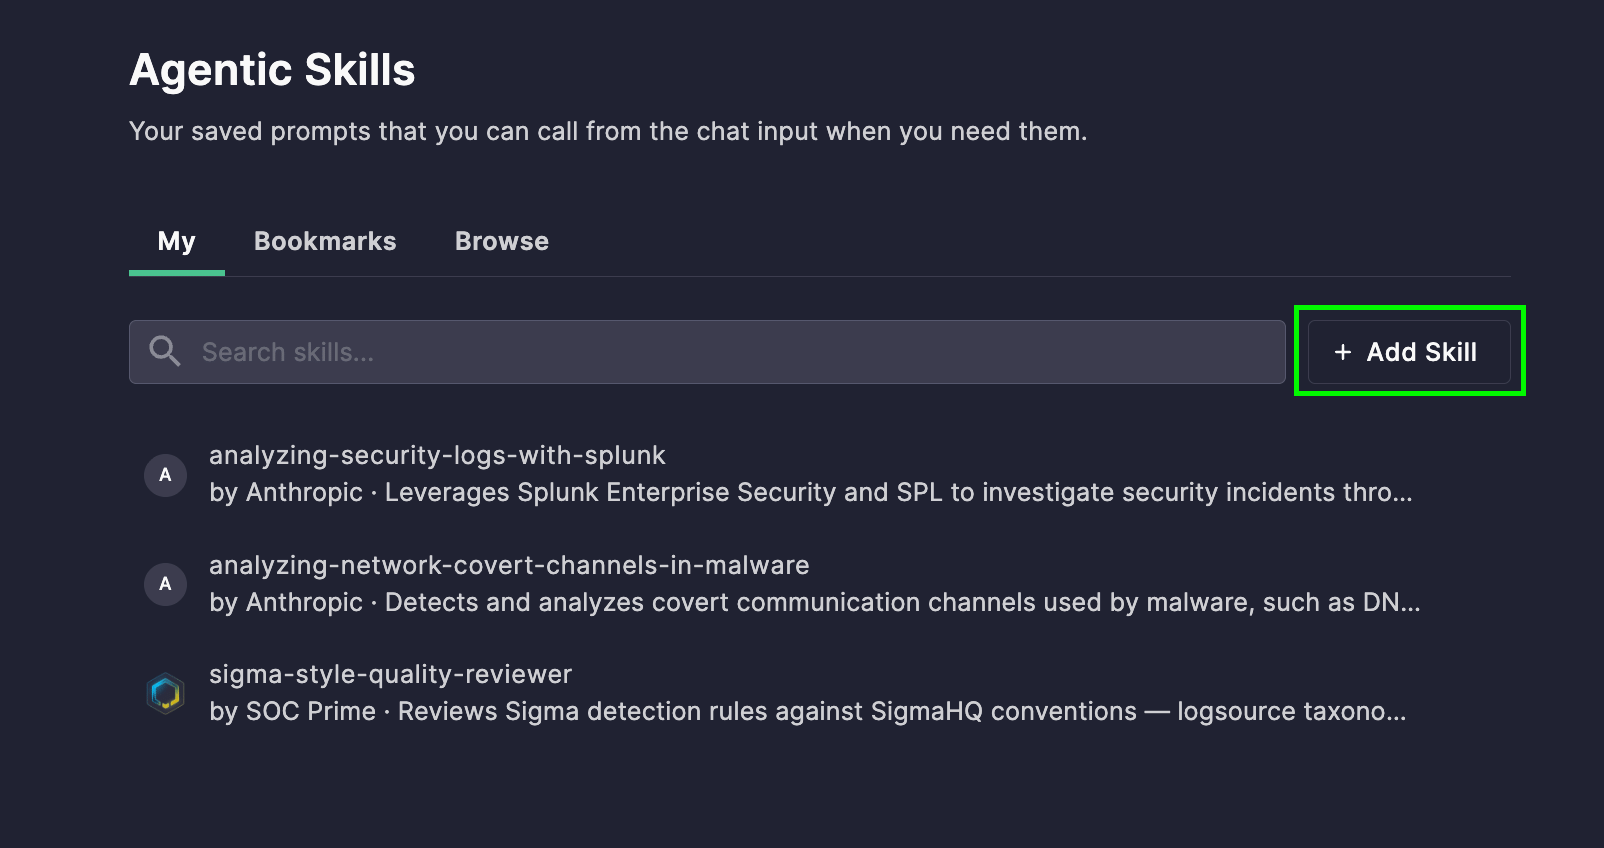
Attack Chains: See the Full Story Behind Every Threat

Every day, your SOC drowns in isolated alerts — a suspicious login here, an odd process spawn there, a strange outbound connection somewhere else. Individually, each one looks like noise. Together, they might be the early signature of a coordinated adversary campaign already unfolding inside your environment. The problem isn’t a lack of data — it’s a lack of connection.

Attack Chains changes that equation. Instead of asking your analysts to manually stitch together dozens of low-confidence signals, Attack Chains does it for them automatically — correlating historical scan results across your SIEM, EDR/XDR, and Data Lake (Prime Hunt), or real-time event streams as they’re generated, before that data even reaches your SIEM (Prime Detect). Either way, it doesn’t correlate against a static, generic rule set — it correlates against Active Threats: newly identified, real-world threats as they’re published to detect potential Attack Chains before they become confirmed incidents. That means your detection logic is only ever as current as the threat landscape itself. 

Where to find it: Attack Chains lives as its own tab inside both Prime Hunt and Prime Detect. If you’re working with historical data, go to Prime Hunt → Attack Chains. If you want real-time correlation before data hits your SIEM, go to Prime Detect → Attack Chains.

Always Watching for What’s New

Once you’re in Attack Chains, the Monitored Threats tab shows every Active Threat your environment is being correlated against. Attack Chains stays current without any effort on your part. The moment a new threat is identified in the wild, it’s already part of what your environment is being checked against — no waiting for a rule update, no manual research cycle. You still decide what matters most to your organization, focusing correlation on the threats most relevant to your industry or risk profile.

Enable or disable individual threats, or apply bulk actions to manage several at once — right from the Monitored Threats list — so your correlation scope always reflects what actually matters to your organization.

And if a threat’s detection coverage isn’t actually working — whether it hasn’t been scanned yet or a rule isn’t properly connected — you’ll see it right away, instead of finding out after the fact. Here’s what that looks like:

A green checkmark means a threat’s detection coverage is fully in place. An issue label flags a gap — click it to see exactly what’s missing.

The Picture Attack Chains Give You

Once a chain forms, it’s not just a correlated pile of events — it’s an investigation-ready story, at both a program-wide and case-by-case level.

At a glance, your Attack Chains Overview gives you a real-time pulse on your overall exposure: how many chains have been built, how many active threats are currently being watched, how many hosts are involved, and how much of your detection coverage is actually firing. It’s the kind of summary that turns “are we being targeted?” into a number you can check in seconds.

Click into any individual chain from the Attack Chains tab, and your team gets:

  • An AI-generated summary of the detected activity, so analysts get immediate context 
  • A visual timeline of adversary techniques, showing exactly how the attack progressed step by step — with techniques already confirmed by detection rules, plus activity caught through fuzzy pattern matching (Prime Hunt) 
  • Threat actor and technique attribution, mapped to industry-standard frameworks, so scoping and context-building start immediately instead of from scratch
  • A clear match, showing how closely the activity lines up with a known attack pattern — so your team knows exactly how seriously to treat it
  • Full asset and environment context — which host, which part of your infrastructure, and which of your data sources picked it up — so there’s no guessing where to look next
  • A direct path back into your existing tools, letting analysts pivot straight into the underlying events without losing time or context
  • A built-in investigation trail, tracking the status of the Attack Chain from first detected to fully resolved, and nothing falls through the cracks

Low-confidence noise is filtered out by the AI, so what reaches your team by default is what actually deserves their attention — with the option to dig into everything else whenever they choose to.

Bringing It All Together: Configuring Attack Chain Correlation

With the threat intelligence and the picture it produces in mind, here’s how you tell Attack Chains exactly how to correlate it:

  1. Set the chain-forming threshold — the minimum percentage of a threat’s technique sequence that must match before Attack Chains are formed
  2. Define the correlation window — how close together in time events must occur to be correlated
  3. Define the lookback window — how far back the engine searches when hunting for related events (Prime Hunt only)
  4. Choose your data sources — include or exclude the SIEM, EDR/XDR, and Data Lake sources (Prime Hunt) or topics (Prime Detect) feeding correlation, and optionally auto-enroll new ones as they’re added
  5. Review data-sharing settings — hostname data needs to be transmitted and stored for correlation to work, which may require explicit consent (Prime Hunt)
  6. Save and click Run — Attack Chain monitoring is live from that point on, continuously checking your environment against the newest threats as they emerge

CHECK AVAILABLE DETECTIONS


The post Attack Chains: See the Full Story Behind Every Threat appeared first on SOC Prime.
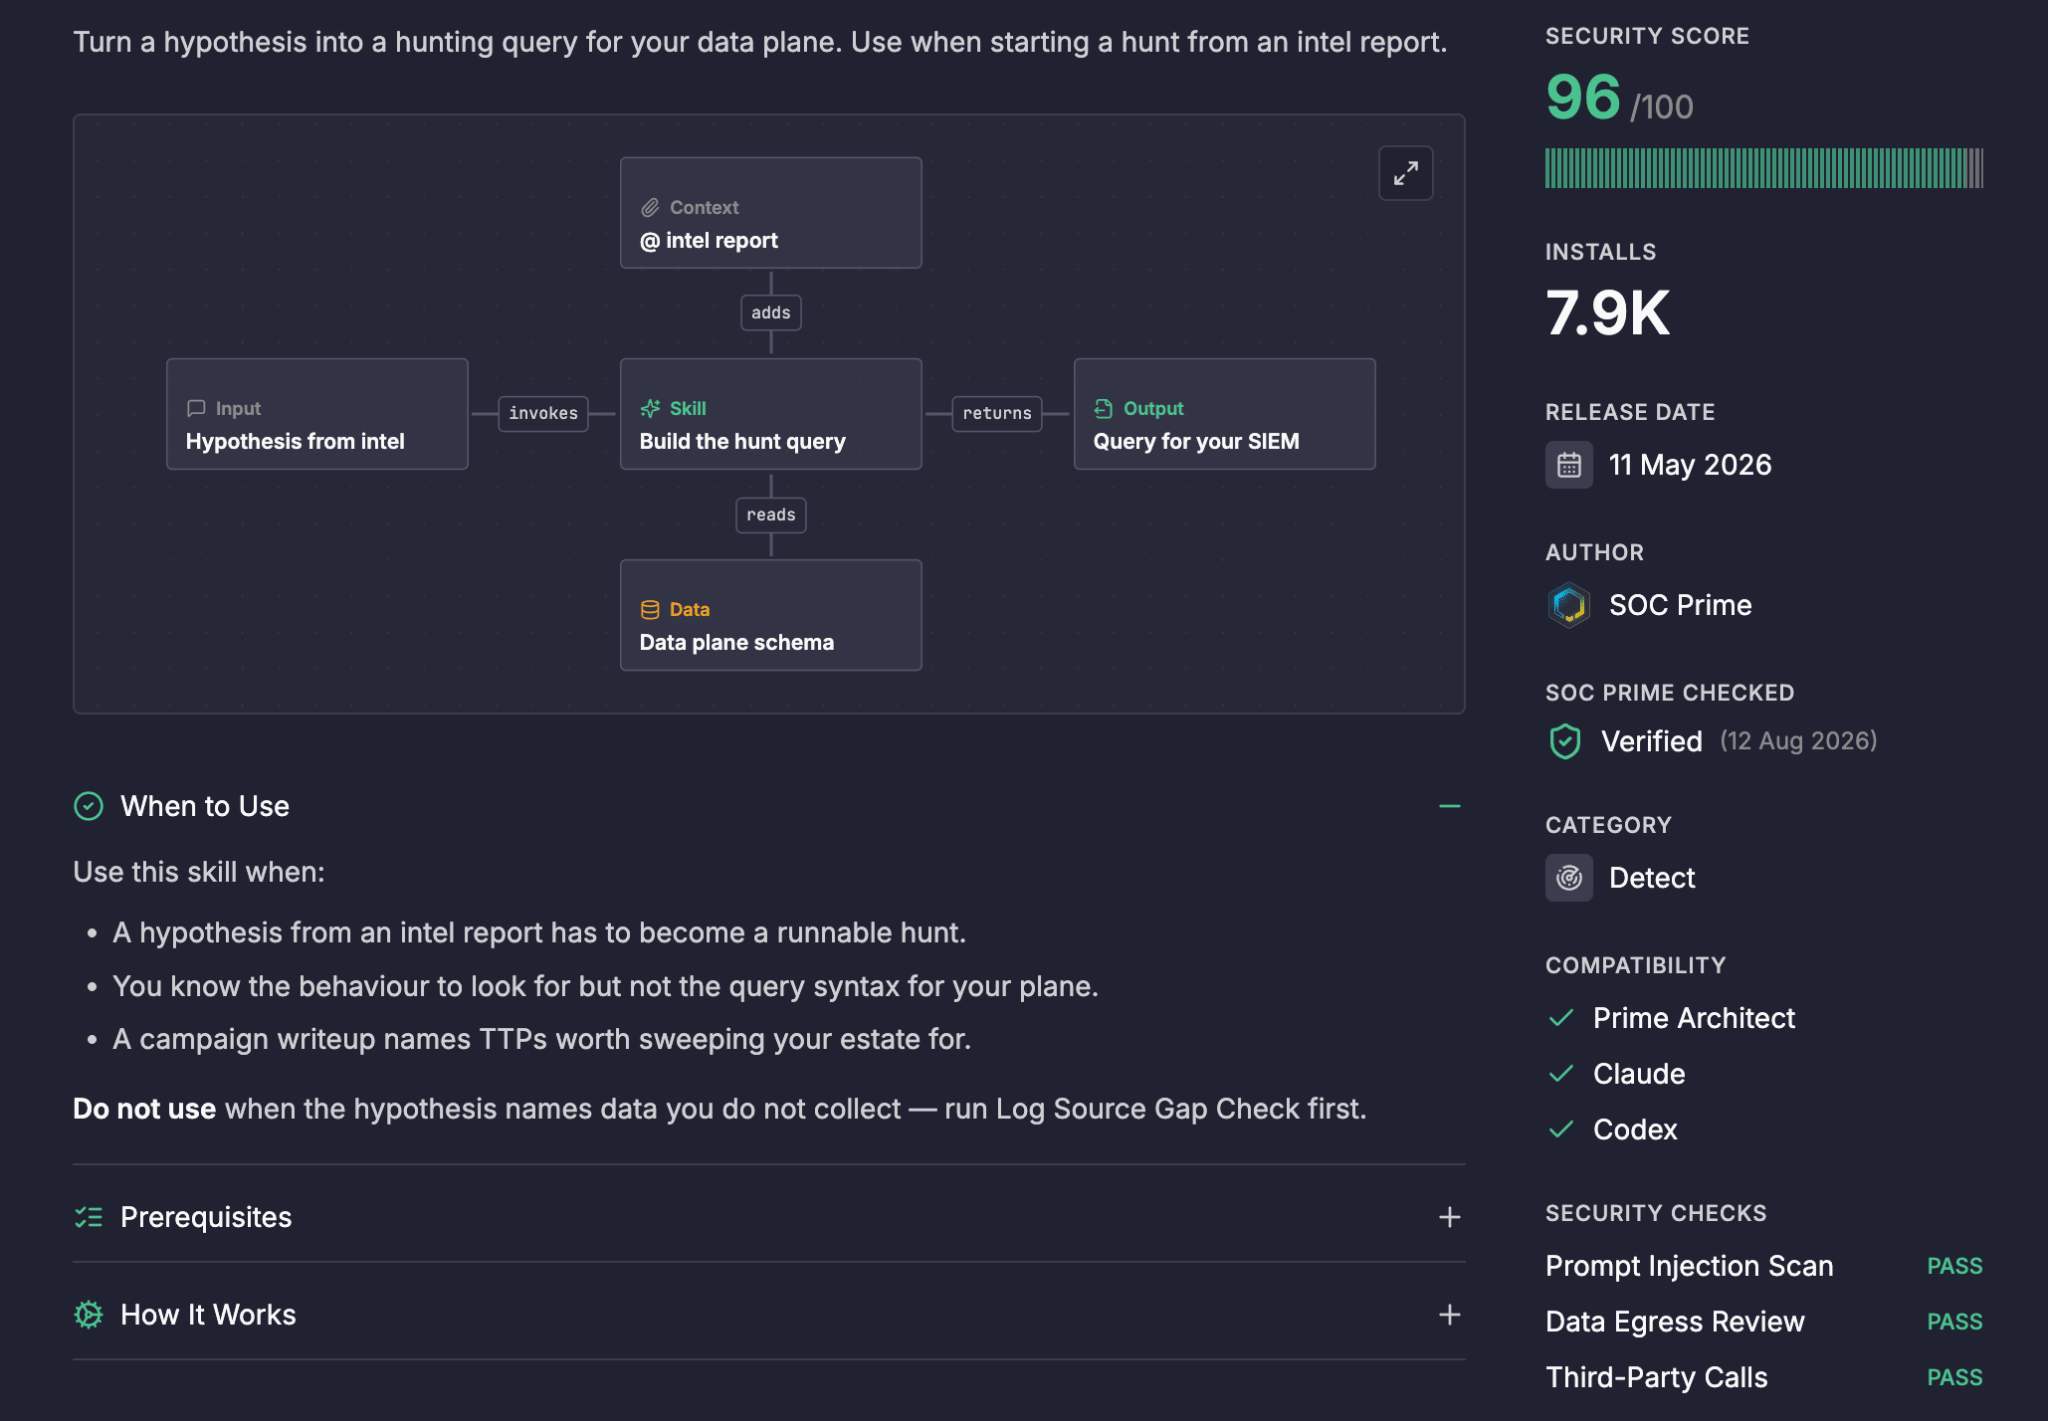
EclecticIQ Intelligence Center 3.8: Built for the way security teams are actually working now

Running a threat intelligence program today means operating across more tools, more workflows, and more organizational complexity than most platforms were originally designed to handle. The intelligence is there. The question is whether the platform is keeping up with how your team actually needs to use it.
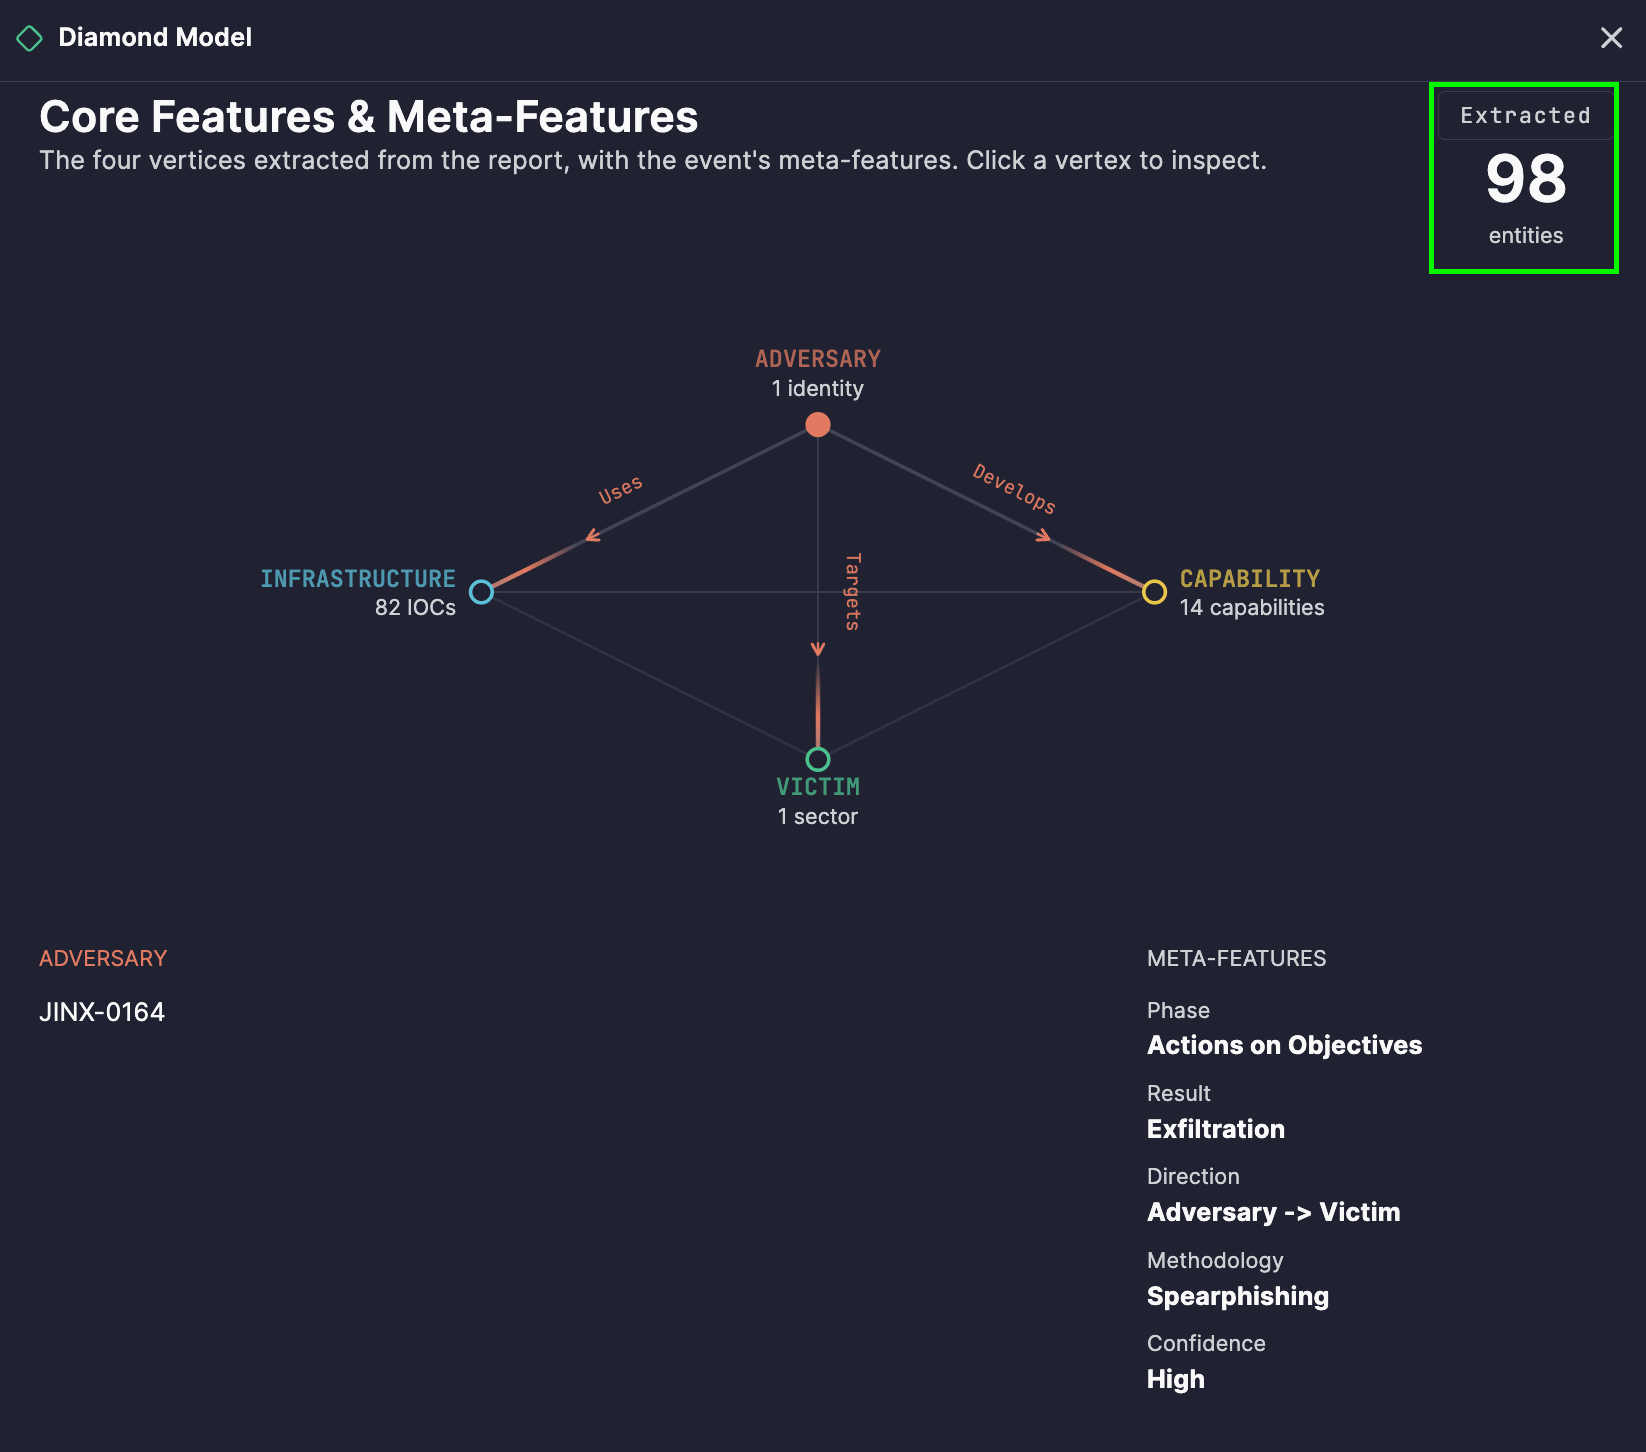
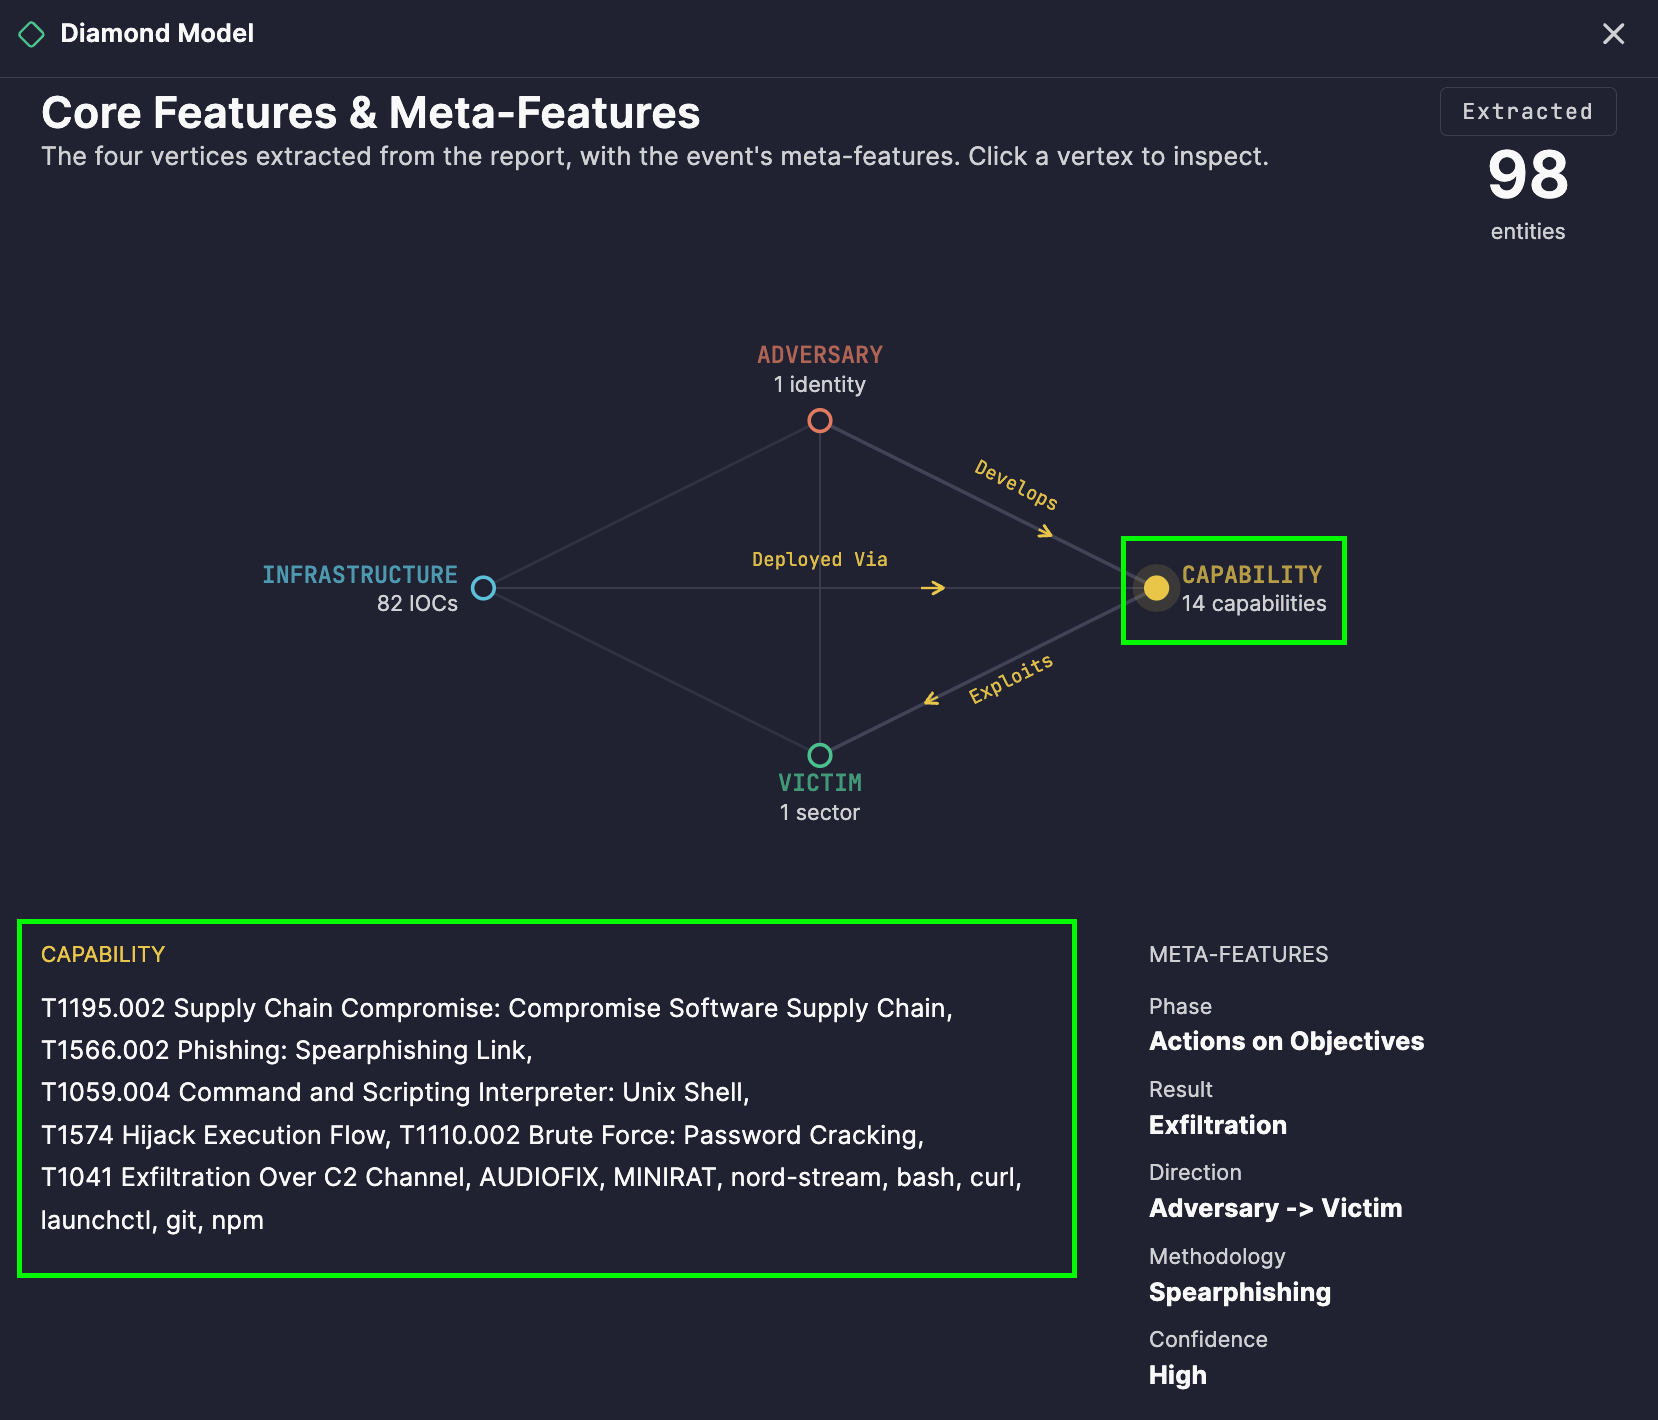
EclecticIQ MCP Server: Connect your AI agents directly to your threat intelligence

SOC and CTI teams have spent the last two years integrating AI tools into real investigative work, and the results have been meaningful. Analysts move faster through reports, surface connections more quickly, and spend less time on the mechanical parts of initial triage. But the threat intelligence platform sitting at the center of that work has remained largely separate from it, a destination analysts navigate to rather than an environment agents can operate inside. The gap between understanding a threat and recording it in a TIP is still, in most teams, a human problem. The EclecticIQ MCP Server is built to close it.

❌