SOC and CTI teams spend a significant part of their day maintaining context that should already be there. The assets they monitor, the technologies they protect, the threat actors they track, this organizational knowledge gets re-entered manually across searches, rules, and requirements, duplicated across individual analyst workflows, and updated inconsistently when environments change. The intelligence keeps up with the threat landscape. The context that scopes it rarely does. That is why Intelligence Center 3.8 introduces Keyword lists, a capability that lets teams define organizational context once and apply it automatically across every workflow.
Notes the April 2026 Dark Web Threat Actor Trend Report summarizes trends in hacktivists and threat actors operating on the deep web and dark web. due to the nature of the sources, some of the information is difficult to fully verify as factual. Major Issues NoName05716 claimed repeated DDoS attacks against dozens of organizations, including […]
Tracking threat actor infrastructure has become increasingly complex. Modern adversaries rotate domains, reuse hosting, and replicate infrastructure templates across operations, making it difficult to connect isolated indicators to broader activity. Checking an IP, a domain, or a certificate in isolation can often return little of value when adversaries hide behind short-lived domains and churned TLS certificates.
As a result, analysts can struggle to see how infrastructure evolves over time or to identify shared traits like favicon hashes, header patterns, or registration overlaps that can link related assets.
To help address this, SentinelLABS is sharing a Synapse Rapid Power-Up for Validin. Developed in-house by SentinelLABS engineers, the sentinelone-validin power-up provides commands to query for and model DNS records, HTTP crawl data, TLS certificates, and WHOIS information, enabling analysts to quickly search, pivot through, and investigate network infrastructure for time-aware, cross-source analysis.
In this post, we explore two real-world case studies to demonstrate how an analyst can use the power-up to discover and expand their knowledge of threats.
Case Study 1 | LaundryBear APT: Body Hash Pivots
When Microsoft published indicators for LaundryBear (aka Void Blizzard), a Russian APT targeting NATO and Ukraine, the threat report included just three domains. Using the power-up’s HTTP body hash pivots, we can expand this seed set to over 30 related domains, revealing the full scope of the campaign’s infrastructure.
Initial Enrichment of Known Indicators
We begin with the s1.validin.enrich command, which serves as a unified entry point for all Validin data sources. Rather than running separate commands for DNS history, HTTP crawls, certificates, and WHOIS records, this single command executes comprehensive enrichment across all four datasets simultaneously.
The resulting node graph immediately reveals initial pivot opportunities—shared nameservers in DNS records, certificate SAN relationships, registration timing patterns, and HTTP fingerprint clusters—providing multiple investigative paths forward.
This rapid reconnaissance phase surfaces the most promising leads before committing to expensive deep pivots, helping analysts choose the optimal next step based on what patterns emerge from the enriched graph.
// Tag the published spear-phishing domain
[inet:fqdn=<phising domain> +#research.laundrybear.seed]

// enrich the initial domain
inet:fqdn#research.laundrybear.seed | s1.validin.enrich --wildcard

// display all unique fqdns related to this seed
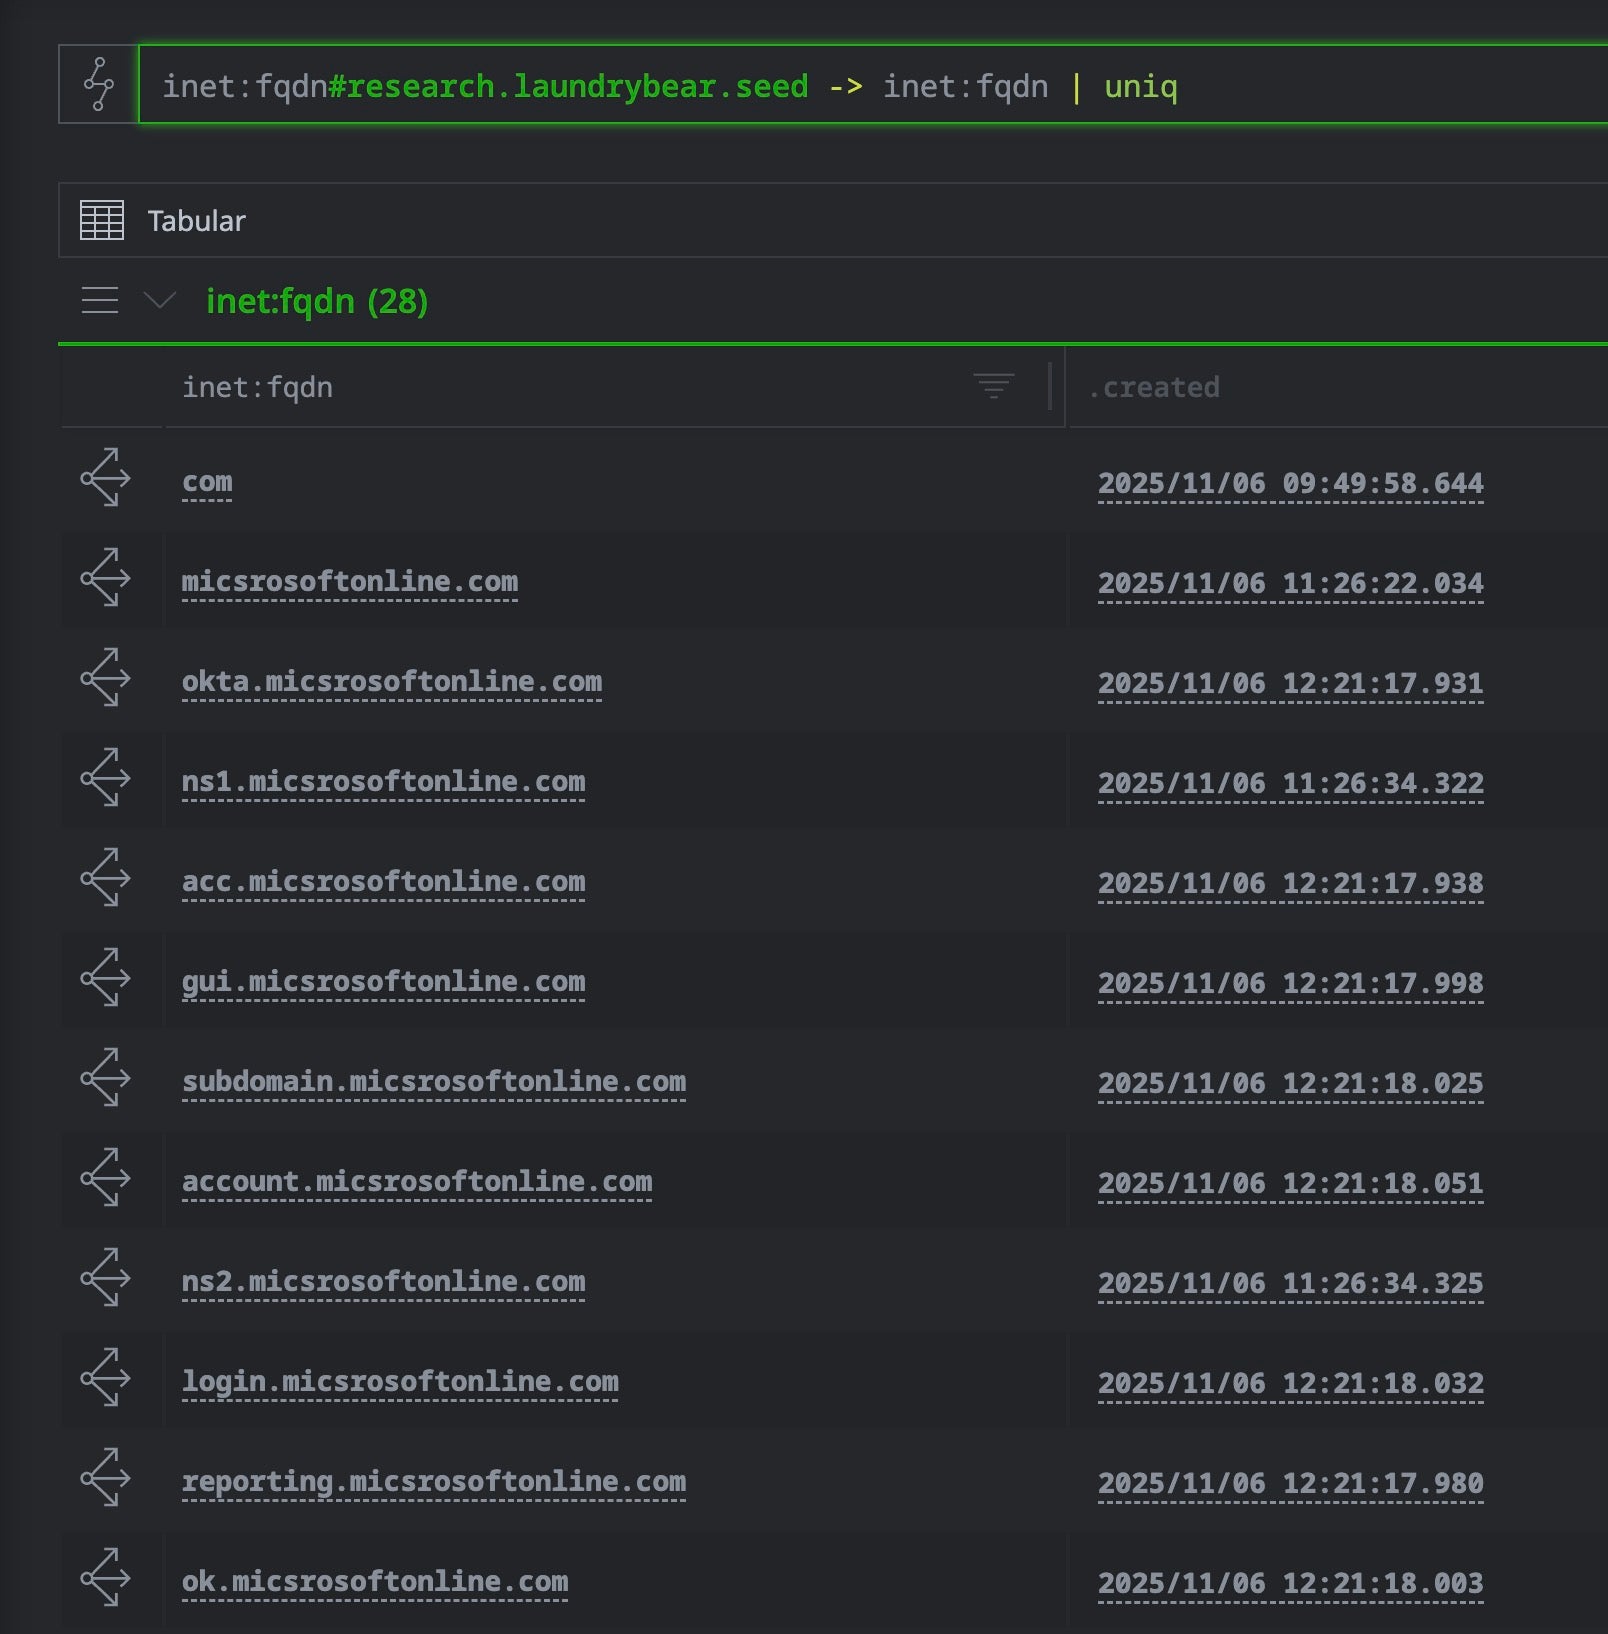
inet:fqdn#research.laundrybear.seed -> inet:fqdn | uniq
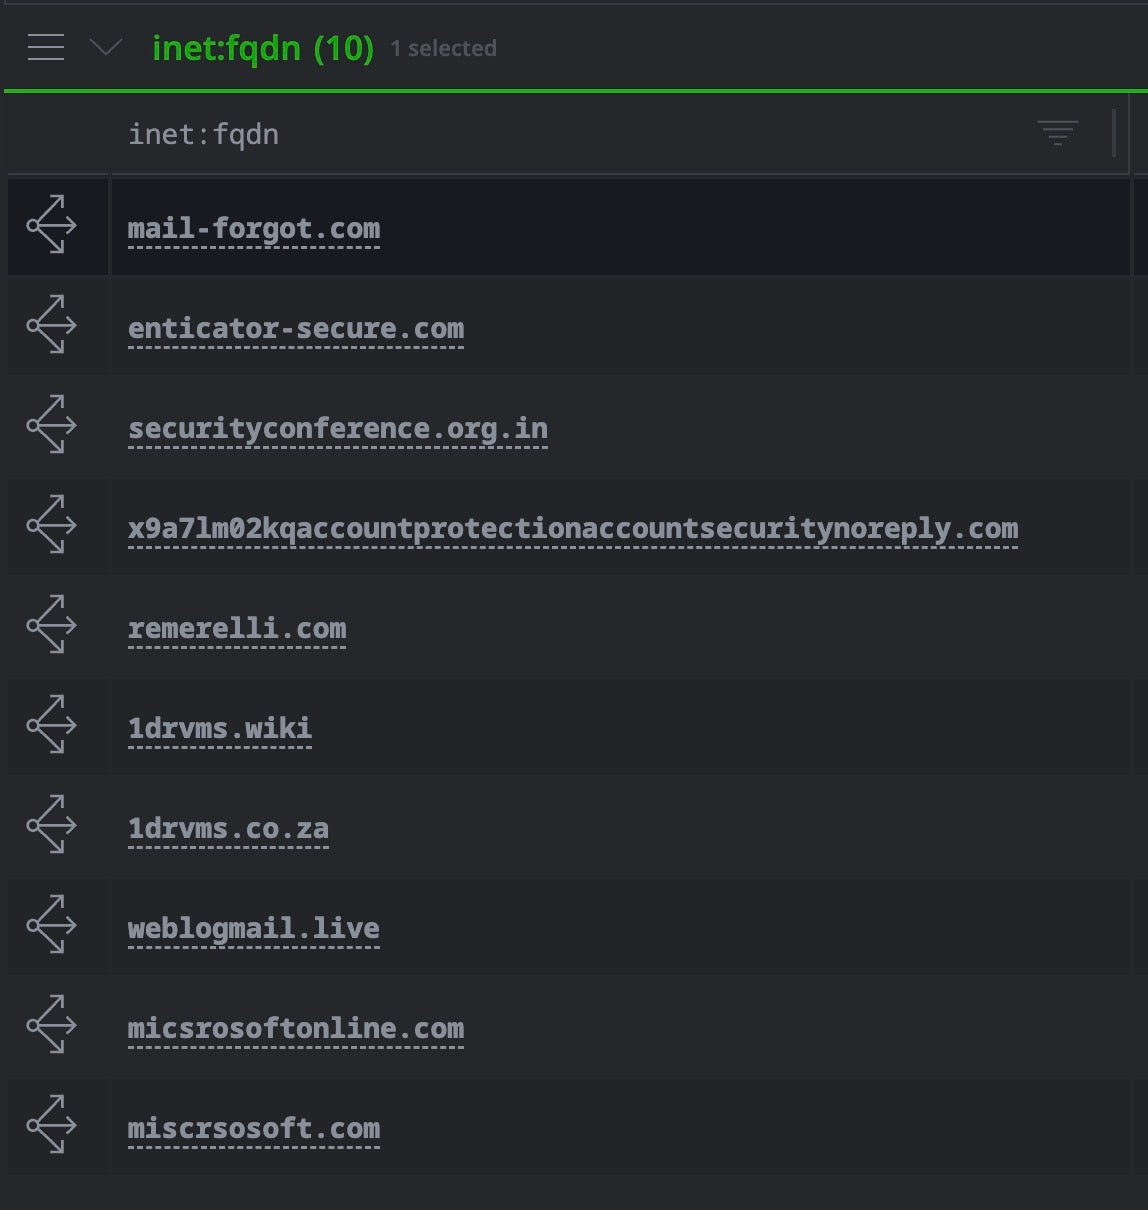
Some of the resulting inet:fqdn nodes after initial workflow in Optic (Synapse UI)
Pivoting from Crawlr Data
The Validin crawler (Crawlr) is a purpose-built, large-scale web crawler operated by Validin that continuously scans internet infrastructure. Querying Validin through the sentinelone-validin power-up provides access to pre-existing crawl observations, allowing instant analysis without active scanning.
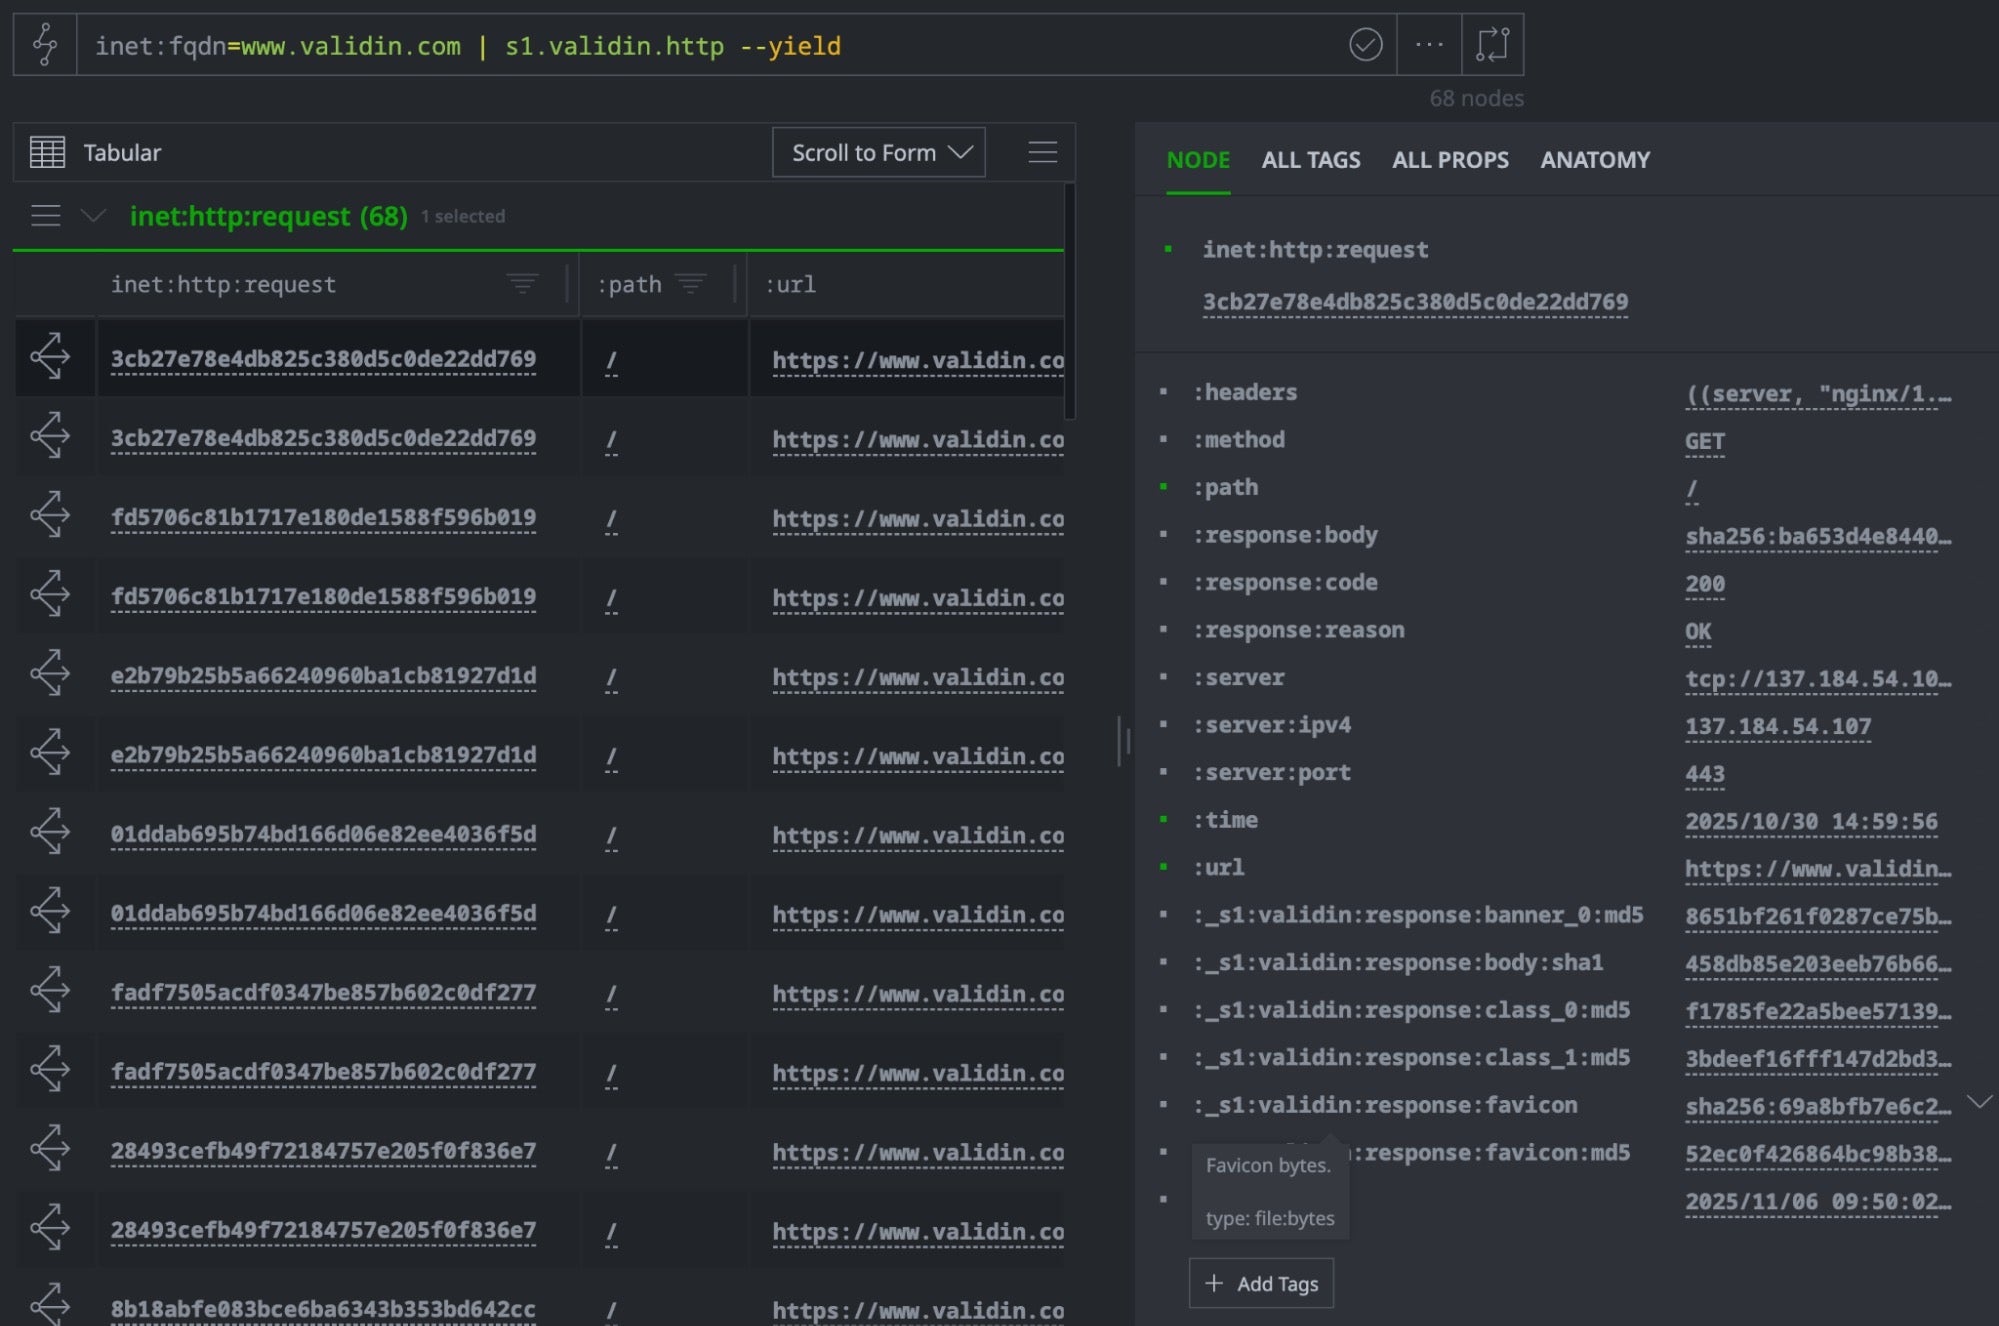
The crawler data for our seed domains was already downloaded during the initial s1.validin.enrich command. This created inet:http:request nodes in Synapse containing multiple HTTP fingerprints stored as custom properties: body hashes (SHA1), favicon hashes (MD5), certificate fingerprints, banner hashes, and CSS class hashes.
Each fingerprint type serves as a pivot point: body hashes reveal identical content, favicon hashes expose shared branding, certificate fingerprints uncover SSL infrastructure, and class hashes detect configuration patterns. Together, these pivots transform the initial three seed domains into a comprehensive infrastructure map.
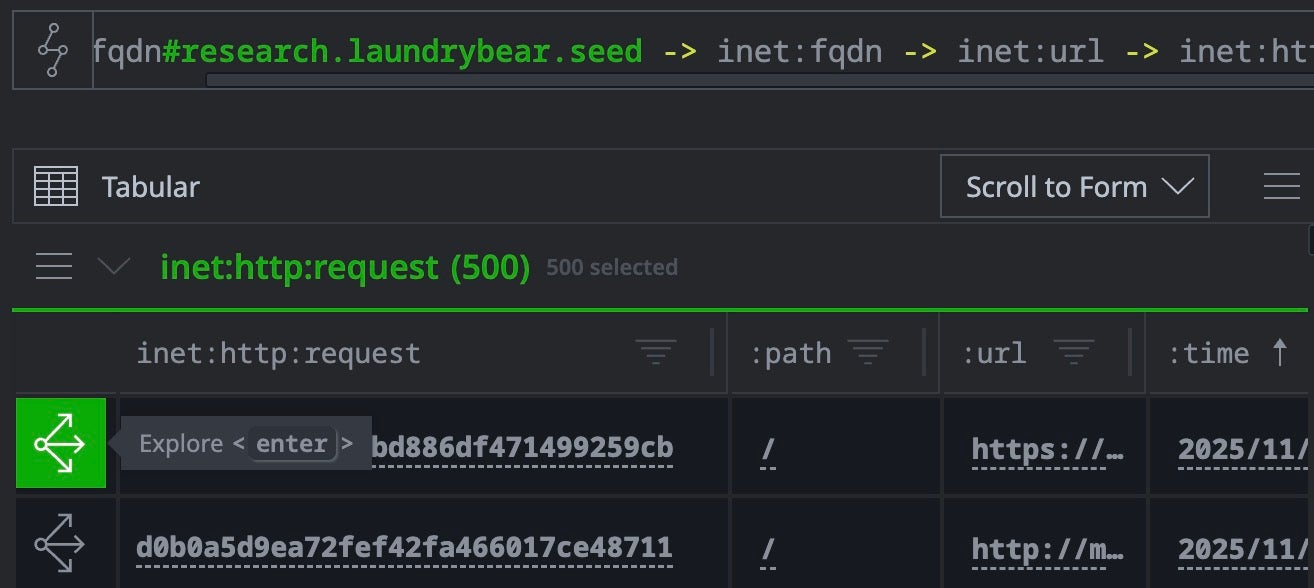
The query starts with our tagged seed domains, pivots to any related FQDNs discovered during enrichment, follows URL relationships, and lands on the actual HTTP request nodes captured by Validin’s crawler. Each inet:http:request node serves as a rich pivot point connecting to multiple content fingerprints and infrastructure properties.
// List all http requests to all the subdomains
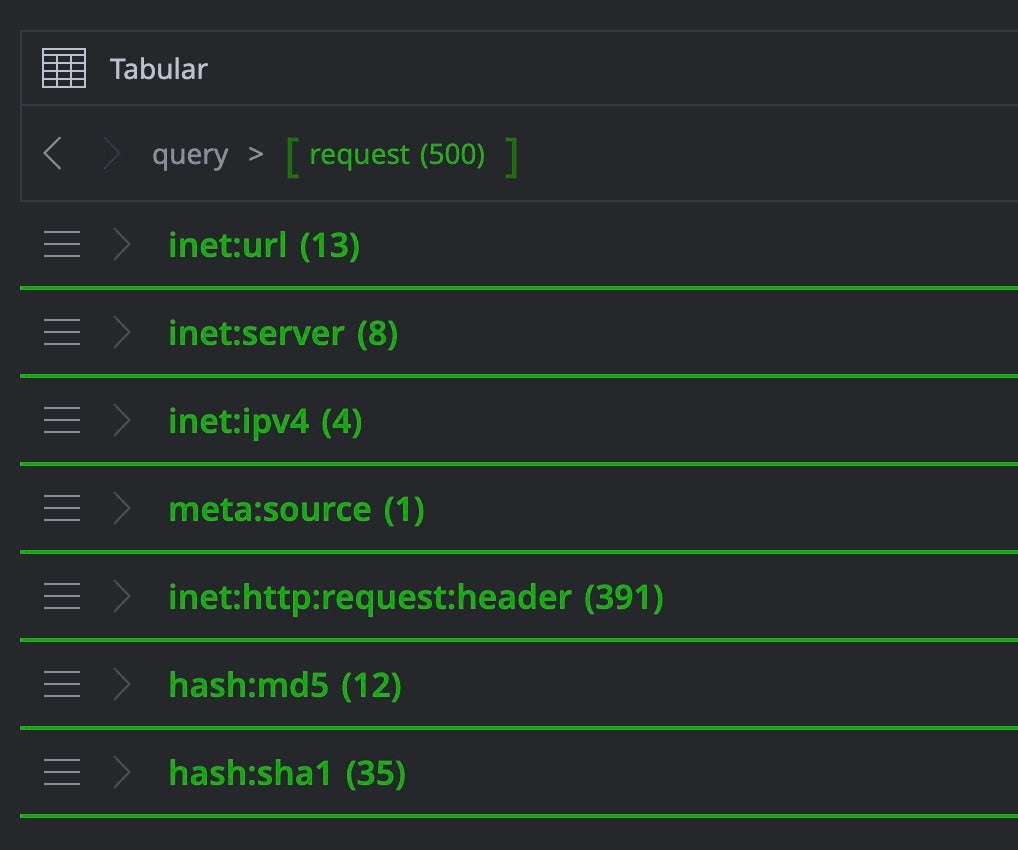
inet:fqdn#research.laundrybear.seed -> inet:fqdn -> inet:url -> inet:http:request
Group pivot in Optic helps to quickly summarize hashes across lifted inet:http:request nodes Collapsed list of nodes yielded from the pivot
HTTP Pivot Discovery
Validin’s Laundry Bear Infrastructure analysis identified synchronized HTTP responses across threat actor infrastructure. We can reach the same discovery using Storm’s HTTP pivot with statistical output.
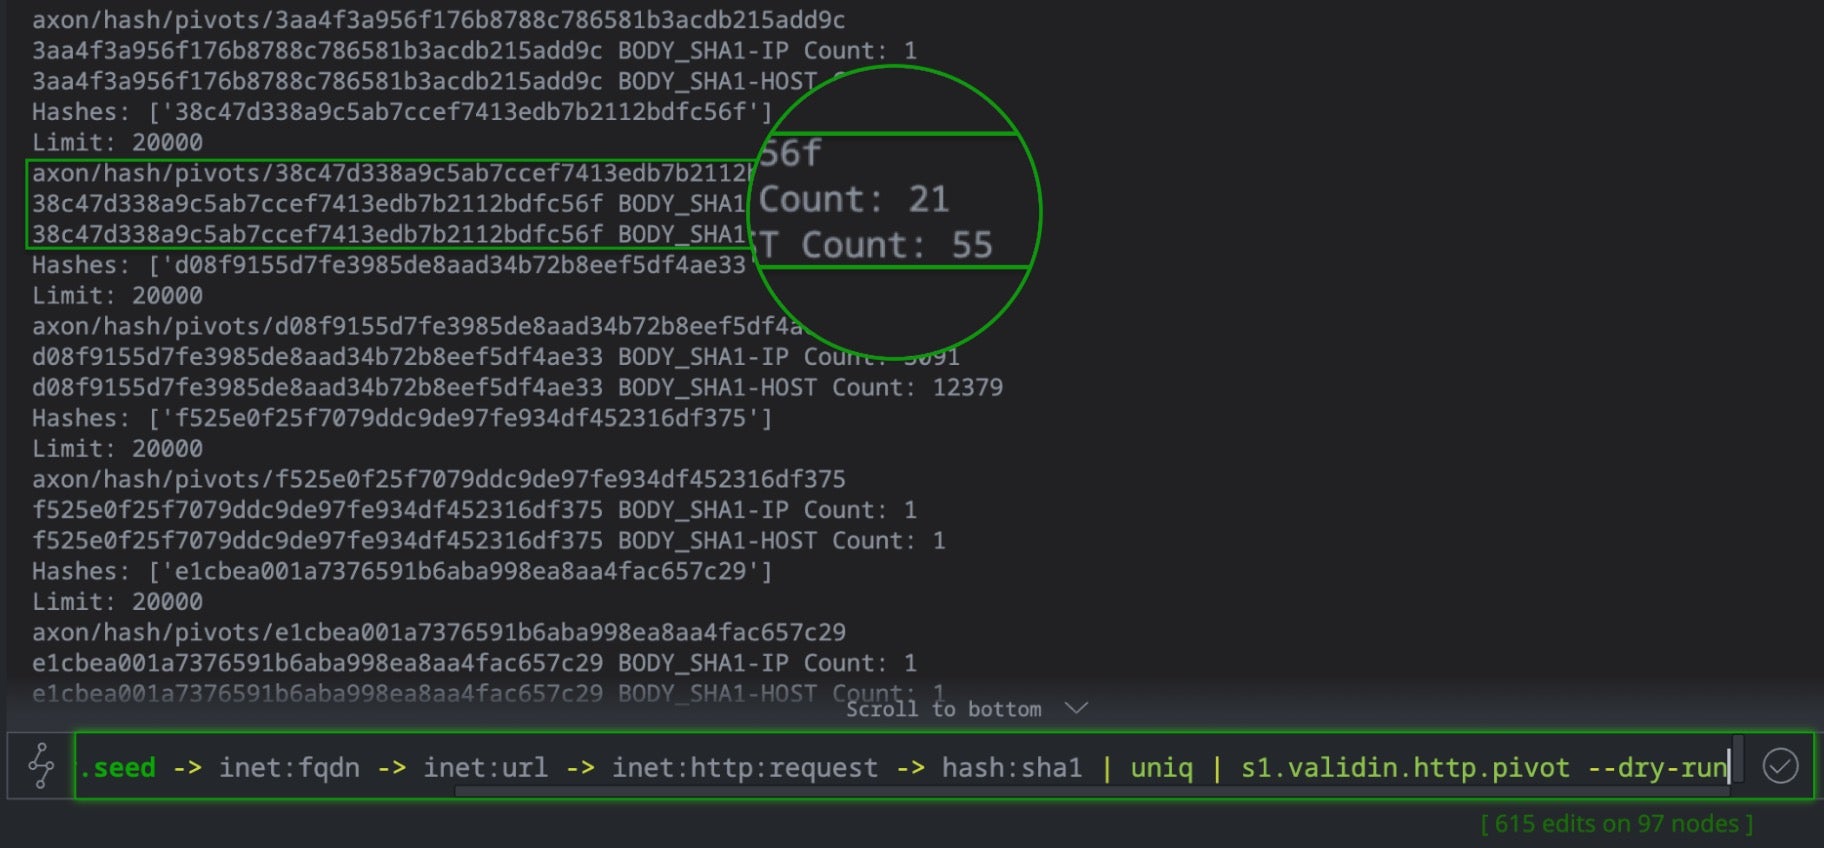
When executing inet:http:request | s1.validin.http --dry-run, the command prints detailed occurrence statistics to the Storm console: how many times each HTTP fingerprint from the input http response (body SHA1, favicon MD5, banner hashes, certificate fingerprints, header patterns) appears in Validin’s database. For example, a body hash might appear on 21 IPs and 55 hostnames, a favicon hash might match 18 IPs and 52 hostnames, while a certificate fingerprint on 15 IPs and 48 hostnames.
The size of these counts is the critical indicator. High counts in the thousands indicate benign infrastructure like CDNs and can be dismissed from consideration. Very low counts (1-5) suggest isolated infrastructure. However, when a particular hash appears in the Validin crawler database with a moderate count (15-55 hosts with the same hash fingerprint in this case), it can indicate synchronized infrastructure provisioning: the exact pattern that characterized Laundry Bear’s coordinated buildout. In short, the --dry-run flag transforms expensive full-graph pivots into rapid statistical reconnaissance.
// Collect all the hash:sha1 indicators gathered in the previous step
and perform a "dry run" with the s1.validin http.pivot to check statistics
inet:fqdn#research.laundrybear.seed
-> inet:fqdn -> inet:url
-> inet:http:request -> hash:sha1 | uniq
| s1.validin.http.pivot --dry-run
After identifying promising body hash pivots through --dry-run statistics, we need to materialize the actual infrastructure and summarize the results. Consider this command:
// materialize and summarize apex domains form single pivot
hash:sha1=38c47d338a9c5ab7ccef7413edb7b2112bdfc56f
| s1.validin.http.pivot --yield
// pivot to apex domains
| +inet:fqdn -> inet:fqdn +:iszone=true | uniq
Resulting inet:fqdn nodes from the http pivot
Omitting the --dry-run flag is critical here; removing the flag allows the Storm command to create and persist all discovered nodes in the Cortex. The full infrastructure graph (HTTP requests, certificates, DNS records) is ingested, making it available for future pivots and correlation with other intelligence sources. The final filtering and deduplication produces a concise summary: “This body hash appears across N distinct apex domains”, transforming raw occurrence statistics into actionable threat intelligence.
Results:
10 apex domains with identical body hash visible immediately (JavaScript redirect)
Most are Microsoft/corporate service typosquats used for credential phishing
22 IP address shared by multiple domains, revealing hosting infrastructure
Note that the query here identifies ten domains in total, two more than reported in Validin’s analysis of the LaundryBear infrastructure. The extra context here comes from our additional use of the official synapse-psl power-up, which ingests and maintains the Mozilla Public Suffix List and ensures that inet:fqdn:zone correctly identifies true organizational boundaries.
Tagging Discovered Infrastructure
Once we’ve identified related infrastructure through hash pivots, we need to tag these findings for tracking and future analysis. Storm provides inline tagging capabilities that mark nodes during the pivot workflow by appending this snippet at the end of a query that produces output to be tagged.
// Tagging
... [+#research.laundrybear.infra]
This workflow expanded three published indicators to 55 domains and 21 IP addresses through body hash pivots, revealing the campaign’s infrastructure scope.
Case Study 2 | FreeDrain: Large-Scale Pivot Operations
FreeDrain, an industrial-scale cryptocurrency phishing network, used 38,000+ lure pages across gitbook.io, webflow.io, and github.io. The campaign templated infrastructure with reused favicons, redirector domains, and phishing pages hosted on Azure and AWS S3—an ideal scenario for demonstrating the power-up’s capabilities.
Discovering Bulk Registration Patterns
During the initial investigation, SentinelLABS identified a set of redirect domains used by FreeDrain operators to funnel victims from legitimate hosting platforms to attacker-controlled phishing infrastructure. These domains were tagged as #research.freedrain.href in our Cortex. To understand the operational infrastructure behind these redirectors in Synapse, we can enrich them through Validin’s WHOIS data:
// Enrich the domains with whois data
inet:fqdn#research.freedrain.href | s1.validin.whois
This enrichment ingests historical WHOIS records for each redirect domain, creating inet:whois:rec nodes with registration dates, expiration information, and critically, registrar relationships.
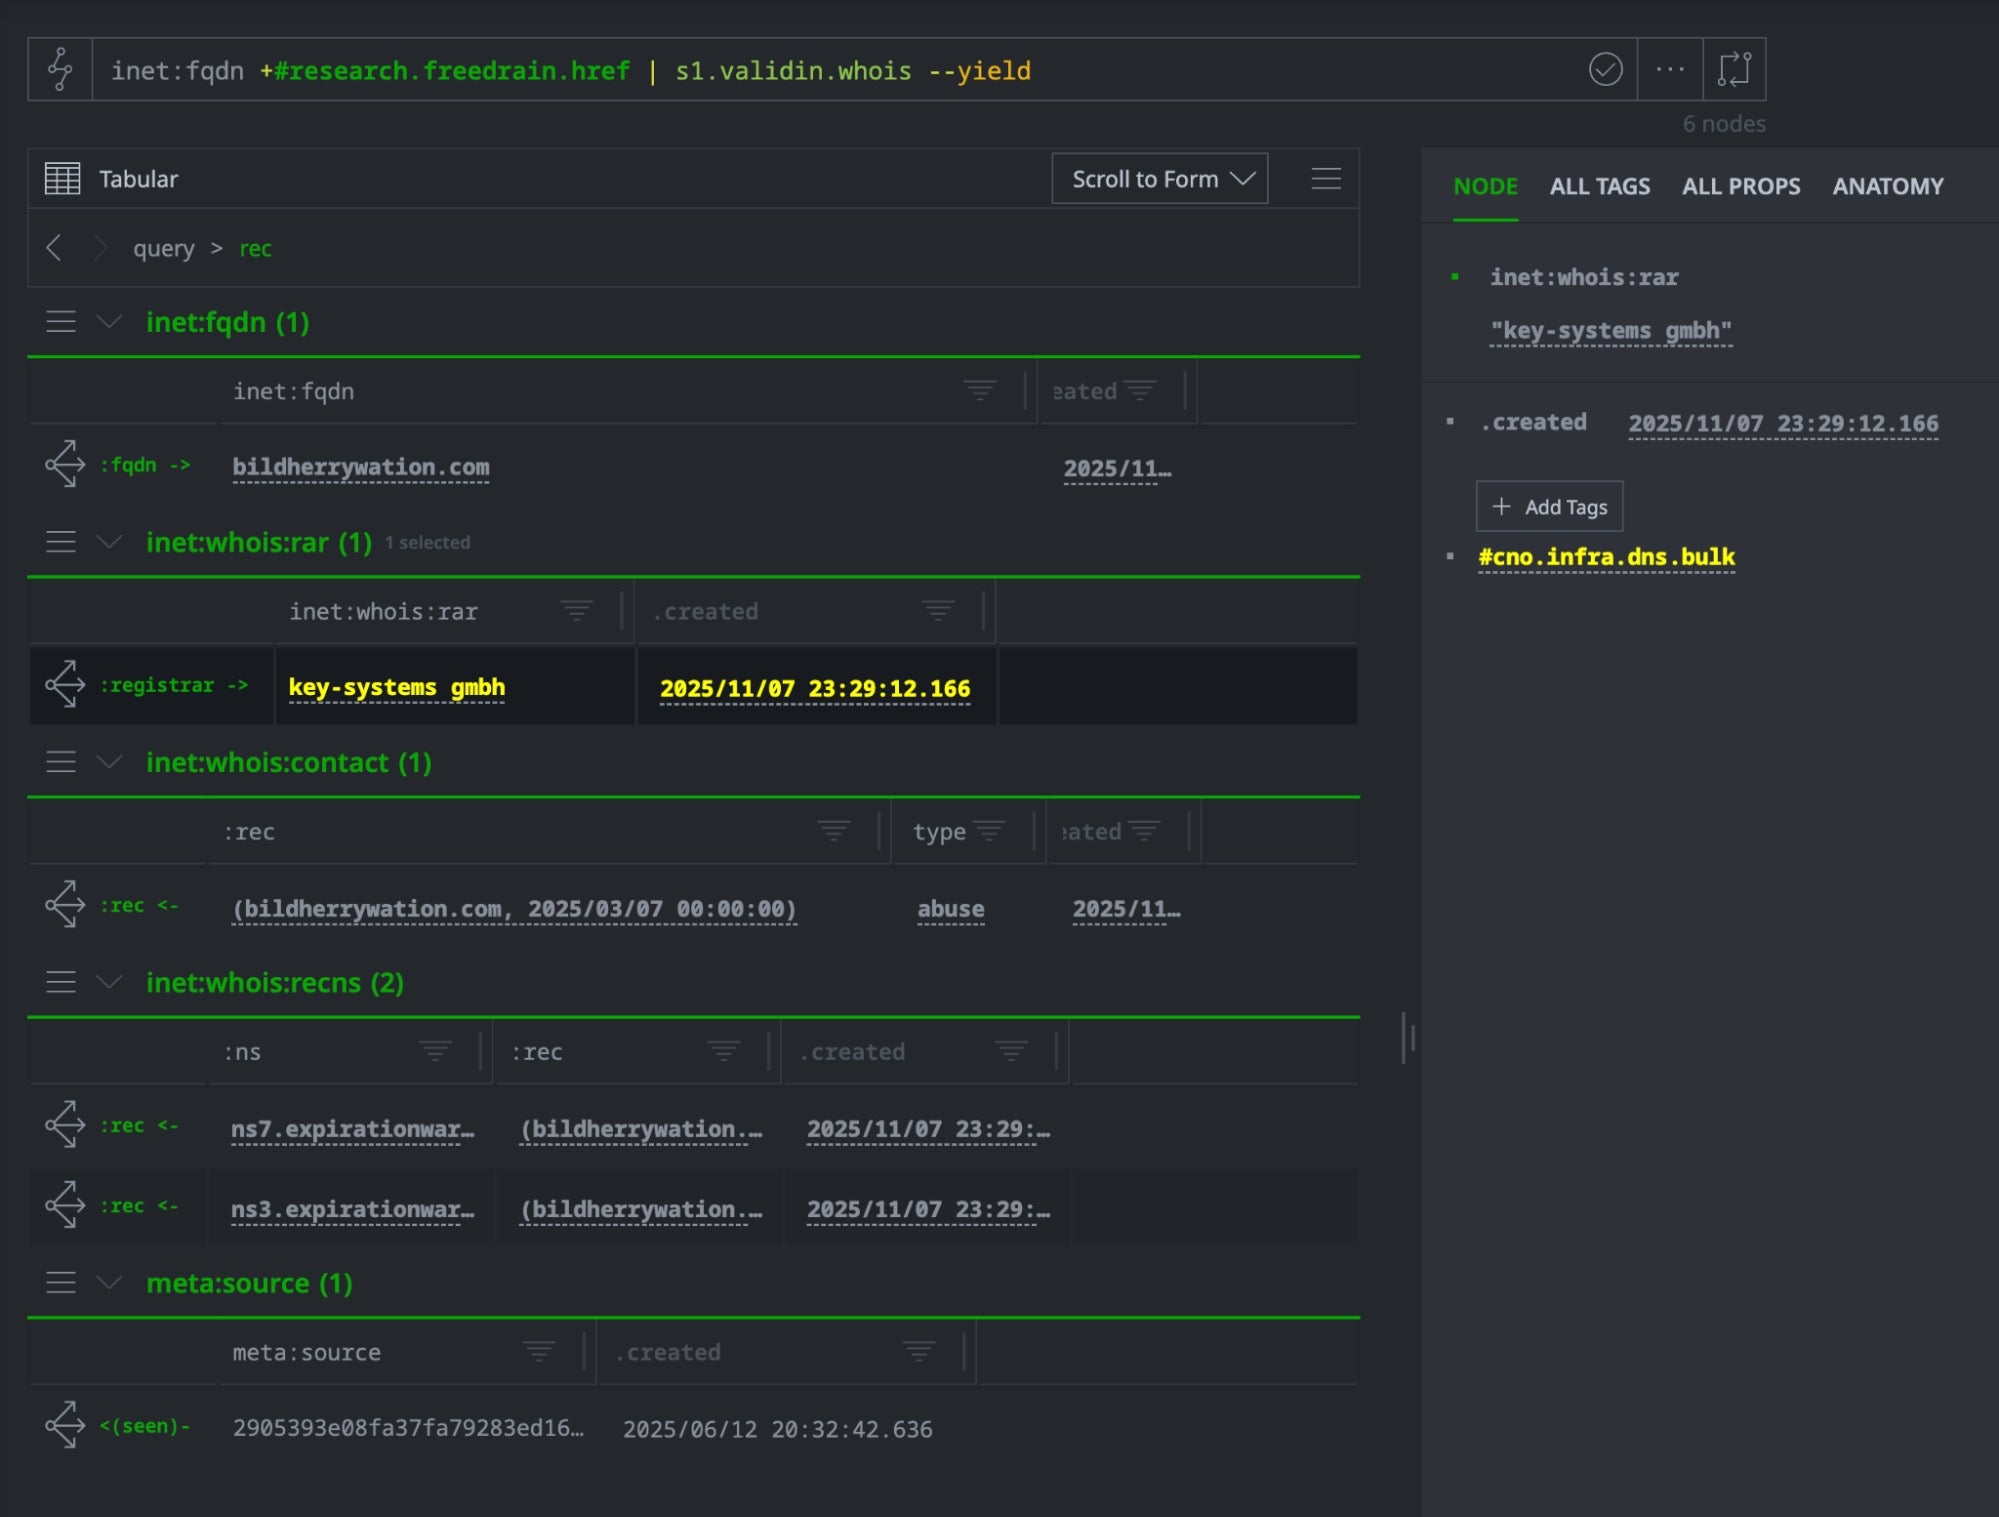
When exploring the enriched graph in Synapse’s UI, several nodes immediately stand out (highlighted in yellow in our default workspace setup), indicating CNO (Computer Network Operations) tags from previous investigations.
Tagged node highlighted in Optic
The highlighting reveals that the shared registrar is already tagged as #cno.infra.dns.bulk, a designation in our environment for DNS registrars known to facilitate bulk domain registrations used in threat operations.
This isn’t a coincidental infrastructure overlap: we’ve immediately connected FreeDrain to a known malicious service provider that’s appeared in previous campaigns. The pre-existing #cno. tag transforms this from a simple infrastructure observation into a high-confidence attribution signal: FreeDrain operators are using the same operational resources as other documented threat actors.
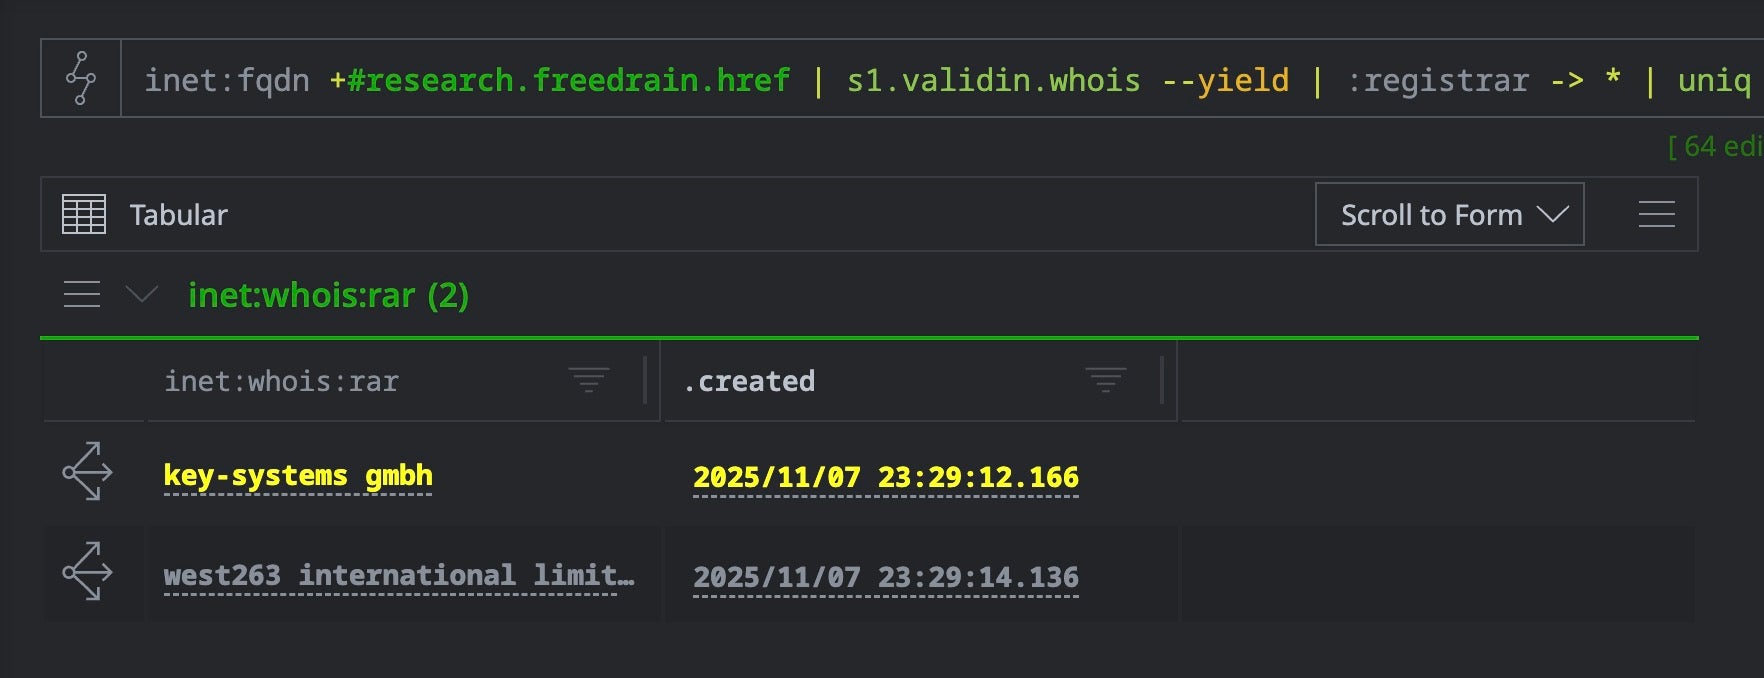
Before pivoting broadly, we can survey the registrar landscape within our FreeDrain redirect domain pool to understand infrastructure diversity:
The FreeDrain case demonstrates how Validin’s WHOIS enrichment can transform large-scale phishing investigations. Starting with a handful of tagged redirect domains, a single enrichment command and two pivot queries exposed the full operational infrastructure—hundreds of domains provisioned through bulk registrars.
This is possible due to Synapse’s ability to correlate new campaign data with historical intelligence: the pre-existing #cno.infra.dns.bulk tags immediately identified FreeDrain’s infrastructure as part of a known malicious service ecosystem, providing attribution context that wouldn’t exist in isolated analysis.
Passive DNS
Domain Enrichments
The sentinelone-validin power-up allows us to enrich a domain and pivot to find details, not only about its current registration but the history of the records. With the –wildcard option, Validin returns the DNS records for all related subdomains.
// Enrich the domain with its registration information, and also include subdomains
[inet:fqdn=<target domain>] | s1.validin.dns --wildcard
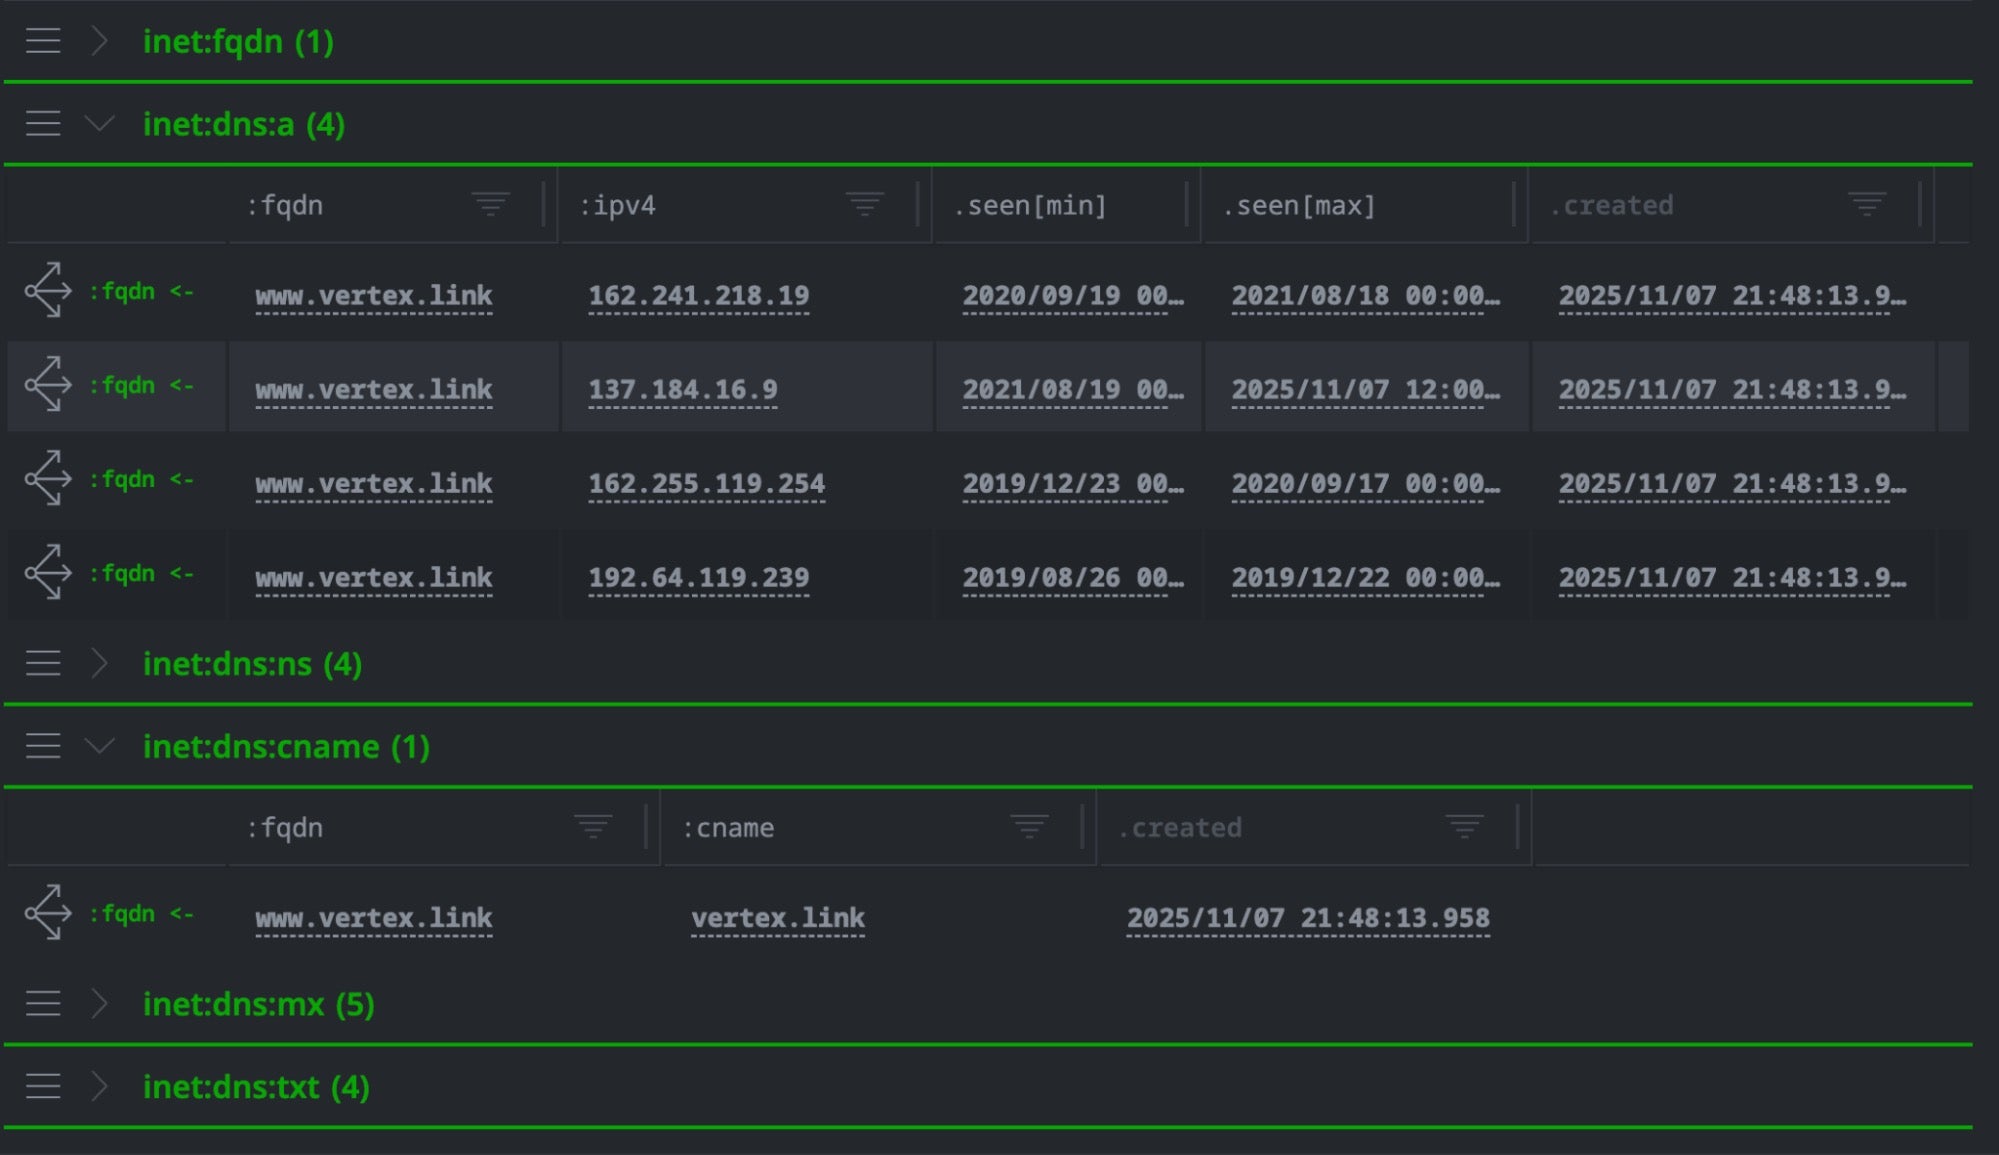
Validin’s historical DNS records showing the observation period in the .seen property
Certificate Transparency
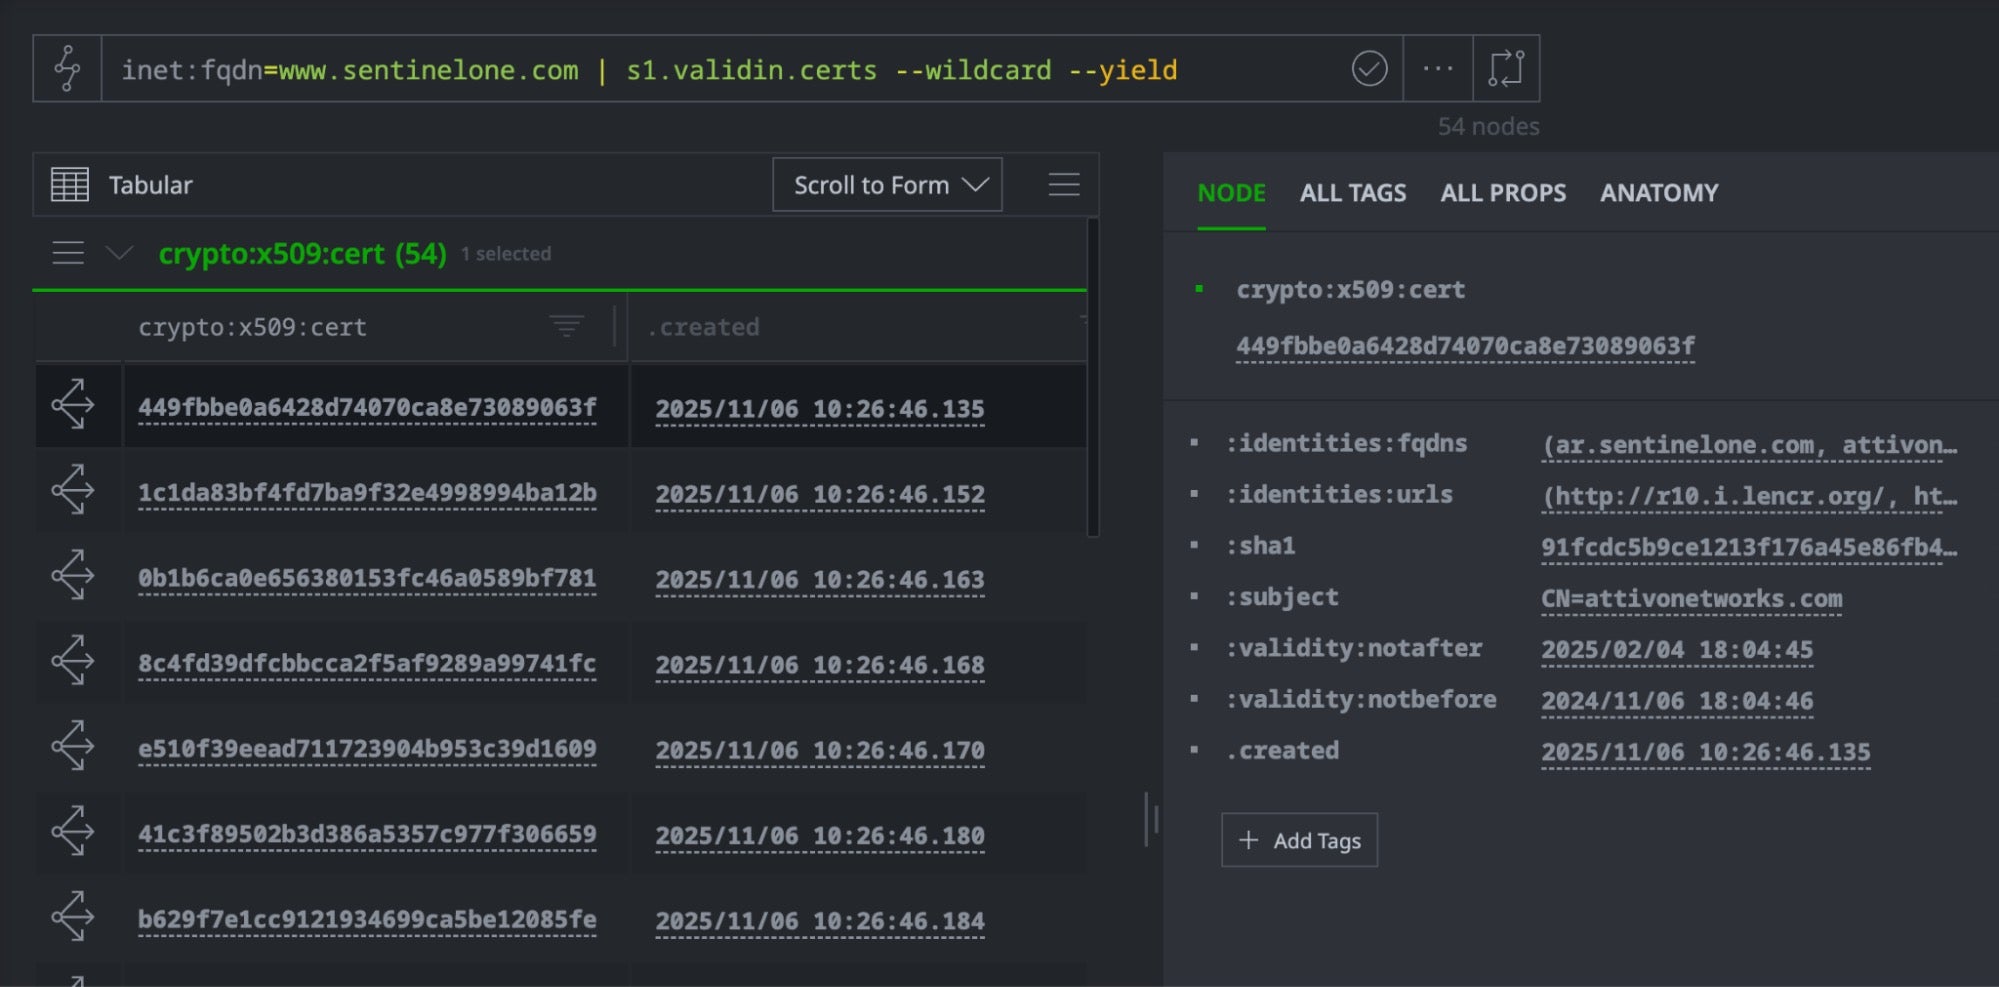
Certificates often include multiple domains in Subject Alternative Name (SAN) fields, revealing infrastructure relationships. The following query can help us to quickly find all certificates issued for a domain and its subdomains:
// Find all domains that share certificates with our target
inet:fqdn=<target domain>
| s1.validin.certs --wildcard --yield
Parsed CT stream history
WHOIS
The sentinelone-validin power-up is able to ingest historical WHOIS registration data, creating several node types that enable temporal analysis of infrastructure:
inet:whois:rec – WHOIS records with registration dates (:created), expiration (:expires), last update (:updated), and registrar information
inet:whois:rar – Registrar entities referenced by WHOIS records
inet:whois:recns – Nameserver associations for each domain registration
inet:whois:contact – Contact records for domain roles (registrant, admin, tech, billing) including name, organization, email, phone, and postal address details
Multiple historical records are created per domain, allowing analysts to track changes in infrastructure over time. For example, domains registered on the same day can indicate batch infrastructure provisioning. A query such as:
inet:fqdn=<target domain> | s1.validin.whois
returns all relevant WHOIS records for the target domain, allowing the analyst to pivot to other domains, registrars, or contacts that share temporal or structural relations.
HTTP Crawler
One of the initial challenges we sought to address with the sentinelone-validin power-up was how to improve visibility into infrastructure that exists even as domains and hosting change. Validin’s crawler collects fingerprints such as page content, headers and favicons that persist across domain rotation and infrastructure churn. Leveraging these fingerprints allows analysts to identify patterns and connections that might otherwise be overlooked.
Host Response Fingerprinting
Validin’s HTTP crawler captures and fingerprints multiple aspects of web server responses—favicons, body content, HTTP headers, TLS banners, and HTML structure. The power-up parses these fingerprints and models them as pivotable properties in Synapse, enabling infrastructure clustering through content similarity.
HTML class hashes – Cluster pages with similar structure
Downloading and Parsing Content
The power-up includes a built-in download capability that retrieves actual file content for deeper analysis. The s1.validin.download command fetches HTTP response bodies, TLS certificates, and favicon images from Validin’s storage, creating file:bytes nodes in the Cortex.
Combined with Synapse’s fileparser.parse, this enables the extraction of embedded indicators such as URLs, email addresses, file hashes, IP addresses, and other IOCs hidden in page content or certificate metadata:
In Synapse, inet:http:request is a GUID node representing a unique HTTP request event in the hypergraph. Each GUID node has a deterministic identifier usually derived from the request’s properties, enabling implicit deduplication and efficient correlation of network artifacts across the graph.
// Download and parse HTTP responses, certificates, and favicons
inet:http:request=
| s1.validin.download --yield
| fileparser.parse
Hash-Based Pivoting
Traditional graph-based investigation requires loading all data into Synapse first, then querying relationships within your local graph. This works well for known datasets but becomes expensive when exploring unknown infrastructure: an analyst may ingest thousands of nodes only to discover they represent CDN infrastructure, shared hosting, or other benign patterns.
The HTTP pivot capability offers an alternative workflow: querying hashes directly via Validin’s API before loading data into Synapse. This enables selective enrichment, allowing the analyst to explore and evaluate potential pivot paths externally before committing to graph expansion.
// Pivot from a favicon hash to find related domains
hash:md5= | s1.validin.http.pivot --category FAVICON_HASH

// Pivot from an HTTP request node's embedded hashes
inet:http:request= | s1.validin.http.pivot --yield

// Discover related infrastructure via body hash
hash:sha1= | s1.validin.http.pivot --first-seen 2024/01/01
This approach provides flexibility: assess pivot scope first, then selectively load relevant data.The --dry-run flag shows result counts without creating nodes, letting the analyst preview results before ingestion.
The HTTP pivot command supports multiple content fingerprints:
The sentinelone-validin power-up combines multiple data sources in ways that traditional tools cannot. Using this capability, the analyst can retrieve DNS history, HTTP crawl results, certificates and WHOIS records for a domain, all in one query. For example:
inet:fqdn=<target domain> | s1.validin.enrich
This single command populates the Cortex with a rich node graph, giving the analyst a unified view of the target infrastructure and enabling deeper correlation and pivoting across multiple sources.
Try It Yourself
SentinelLABS has open-sourced the sentinelone-validin power-up so other Synapse users can leverage these capabilities:
Before deploying the power-up to a production environment, test the environment locally. It is possible to test the power-up with the open-source version of Vertex Cortex as follows
Use the compose file at docker-compose.yml to bring up a local Cortex
Load the sentinelone-validin package
Open a Storm shell connected to it
# From the repository root
docker compose up -d cortex
docker compose --profile tools run --rm loadpkg
docker compose --profile tools run --rm storm
The Storm shell connects to cortex and you can run the examples from this post, for example:
inet:fqdn=<target domain> | s1.validin.enrich
Storm Query Tips
Deduplicate: add | uniq after broad pivots.
Bound results: use --first-seen/--last-seen on s1.validin.* commands.
Control fanout: add | limit during exploration to keep result sets manageable.
Tag iteratively: tag intermediate sets (e.g., +#rep.investigation.2026_1.stage1) to branch workflows and compare clusters.
Conclusion
Using the LaundryBear and FreeDrain campaigns as case studies, we’ve explored how the sentinelone-validin power-up leverages Validin’s multi-source enrichment and HTTP fingerprinting to reveal wider campaign infrastructure within Synapse, from just a handful of indicators.
The integration makes it easier to follow how infrastructure changes over time, trace shared resources across campaigns, and connect what might first appear as isolated indicators. With this richer context available directly in Synapse, analysts can move from collection to understanding with greater speed and confidence in their conclusions.
The SentinelLABS team welcomes feedback and pull requests on the sentinelone-validin GitHub repository to help refine and extend its capabilities for the wider research community.
The EclecticIQ AI features have already been helping you work faster and smarter, from using AI assistant as your on-demand research partner, to querying complex data sets using NLP search, aligning requirements with Intelligence Compass, and extracting key entities with AI entity extraction. With the upcoming 3.6 release of Intelligence Center, we’re expanding the EclecticIQ AI Suite with the productivity-boosting features: Summarization , Content generation with templates and Translation. These tools are built to help you move faster, go broader, and stay focused on what matters most.
Cyber threats evolve rapidly, with advanced persistent threats (APTs) and zero-day malware bypassing traditional defences. SOC analysts need a faster, more integrated way to analyse suspicious files and URLs - without switching between multiple tools.
Imagine this: You’re sipping your morning coffee and scrolling through your emails, when you spot it—a vulnerability report for your open source project. It’s your first one. Panic sets in. What does this mean? Where do you even start?
Many maintainers face this moment without a clear roadmap, but the good news is that handling vulnerability reports doesn’t have to be stressful. Below, we’ll show you that with the right tools and a step-by-step approach, you can tackle security issues efficiently and confidently.
If you discovered that the lock on your front door was faulty, would you attach a note announcing it to everyone passing by? Of course not! Instead, you’d quietly tell the people who need to know—your family or housemates—so you can fix it before it becomes a real safety risk.
That’s exactly how vulnerability disclosure should be handled. Security issues aren’t just another bug. They can be a blueprint for attackers if exposed too soon. Instead of discussing them in the open, maintainers should work with security researchers behind the scenes to fix problems before they become public.
This approach, known as Coordinated Vulnerability Disclosure (CVD), keeps your users safe while giving you time to resolve the issue properly.
To support maintainers in this process, GitHub provides tools like Private Vulnerability Reporting (PVR), draft security advisories, and Dependabot alerts. These tools are free to use for open source projects, and are designed to make managing vulnerabilities straightforward and effective.
Let’s walk through how to handle vulnerability reports, so that the next time one lands in your inbox, you’ll know exactly what to do!
Here’s the thing: There are security researchers out there actively looking for vulnerabilities in open source projects and trying to help. But if they don’t know who to report the problem to, it’s hard to resolve it. They could post the issue publicly, but this could expose users to attacks before there’s a fix. They could send it to the wrong person and delay the response. Or they could give up and move on.
The best way to ensure these researchers can reach you easily and safely is to turn on GitHub’s Private Vulnerability Reporting (PVR).
Think of PVR as a private inbox for security issues. It provides a built-in, confidential way for security researchers to report vulnerabilities directly in your repository.
Heads up! By default, maintainers don’t receive notifications for new PVR reports, so be sure to update your notification settings so nothing slips through the cracks.
PVR solves the “where” and the “how” of reporting security issues. But what if you want to set clear expectations from the start? That’s where a SECURITY.md file comes in handy.
PVR is your front door, and SECURITY.md is your welcome guide telling visitors what to do when they arrive. Without it, researchers might not know what’s in scope, what details you need, or whether their report will be reviewed.
Maintainers are constantly bombarded with requests, making triage difficult—especially if reports are vague or missing key details. A well-crafted SECURITY.md helps cut through the noise by defining expectations early. It reassures researchers that their contributions are valued while giving them a clear framework to follow.
A good SECURITY.md file includes:
How to report vulnerabilities (ex: “Please submit reports through PVR.”)
What information should be included in a report (e.g., steps to reproduce, affected versions, etc.)
Pairing PVR with a clear SECURITY.md file helps you streamline incoming reports more effectively, making it easier for researchers to submit useful details and for you to act on them efficiently.
Once you confirm the issue is a valid vulnerability, the next step is fixing it without tipping off the wrong people.
But where do you discuss the details? You can’t just drop a fix in a public pull request and hope no one notices. If attackers spot the change before the fix is officially released, they can exploit it before users can update.
What you’ll need is a private space where you and your collaborators can investigate the issue, work on and test a fix, and then coordinate its release.
GitHub provides that space with draft security advisories. Think of them like a private fork, but specifically for security fixes.
By using draft security advisories, you take control of the disclosure timeline, ensuring security issues are fixed before they become public knowledge.
Some vulnerabilities are minor contained issues that can be patched quietly. Others have a broader impact and need to be tracked across the industry.
When a vulnerability needs broader visibility, a Common Vulnerabilities and Exposures (CVE) identifier provides a standardized way to document and reference it. GitHub allows maintainers to request a CVE directly from their draft security advisory, making the process seamless.
A CVE is like a serial number for a security vulnerability. It provides an industry-recognized reference so that developers, security teams, and automated tools can consistently track and respond to vulnerabilities.
For maintainers, it helps ensure a vulnerability is adequately documented and recognized in security databases.
For security researchers, it provides validation that their findings have been acknowledged and recorded.
CVEs are used in security reports, alerts, feeds, and automated security tools. This helps standardize communication between projects, security teams, and end users.
Requesting a CVE doesn’t make a vulnerability more or less critical, but it does help ensure that those affected can track and mitigate risks effectively.
Good job! You’ve fixed the vulnerability. Now, it’s time to let your users know about it. A security advisory does more than just announce an issue. It guides your users on what to do next.
What is a security advisory, and why does it matter?
A security advisory is like a press release for an important update. It’s not just about disclosing a problem, it’s about ensuring your users know exactly what’s happening, why it matters, and what they need to do.
A clear and well-written advisory helps to:
Inform users: Clearly explain the issue and provide instructions for fixing it.
Build trust: Demonstrate accountability and transparency by addressing vulnerabilities proactively.
Trigger automated notifications: Tools, like GitHub Dependabot, use advisories to alert developers with affected dependencies.
Use plain language: Write in a way that’s easy to understand for both developers and non-technical users
Include essential details:
A description of the vulnerability and its impact
Versions affected by the issue
Steps to update, patch, or mitigate the risk
Provide helpful resources:
Links to patched versions or updated dependencies
Workarounds for users who can’t immediately apply the fix
Additional documentation or best practices
📌 Check out this advisory for a well-structured reference.
A well-crafted security advisory is not just a formality. It’s a roadmap that helps your users stay secure. Just as a company would carefully craft a press release for a significant change, your advisory should be clear, reassuring, and actionable. By making security easier to understand, you empower your users to protect themselves and keep their projects safe.
Publishing your security advisory isn’t the finish line. It’s the start of helping your users stay protected. Even the best advisory is only effective if the right people see it and take action.
Beyond publishing the advisory, consider:
Announcing it through your usual channels: Blog posts, mailing lists, release notes, and community forums help reach users who may not rely on automated alerts.
Documenting it for future users: Someone might adopt your project later without realizing a past version had a security issue. Keep advisories accessible and well-documented.
You should also take advantage of GitHub tools, including:
Dependabot alerts
Automatically informs developers using affected dependencies
Encourages updates by suggesting patched versions
Proactive prevention
Use scanning tools to find similar problems in different parts of your project. If you find a problem in one area, it might also exist elsewhere
Regularly review and update your project’s dependencies to avoid known issues
CVE publication and advisory database
If you requested a CVE, GitHub will publish the CVE record to CVE.org for industry-wide tracking
If eligible, your advisory will also be added to the GitHub Advisory Database, improving visibility for security researchers and developers
Whether through automated alerts or direct communication, making your advisory visible is key to keeping your project and its users secure.
With the right tools and a clear approach, handling vulnerabilities isn’t just manageable—it’s part of running a strong, secure project. So next time a report comes in, take a deep breath. You’ve got this!
You’ve got questions? We got answers! Whether you’re handling your first vulnerability report or just want to sharpen your response process, here is what you need to know.
1. Why is Private Vulnerability Reporting (PVR) better than emails or public issues for vulnerability reports?
Great question! At first glance, email or public issue tracking might seem like simple ways to handle vulnerability reports. But PVR is a better choice because it:
Keeps things private and secure: PVR ensures that sensitive details stay confidential. No risk of accidental leaks, and no need to juggle security concerns over email.
Keeps everything in one place: No more scattered emails or external tools. Everything—discussions, reports, and updates—is neatly stored right in your repository.
Makes it easier for researchers: PVR gives researchers a dedicated, structured way to report issues without jumping through hoops.
Bottom line? PVR makes life easier for both maintainers and researchers while keeping security under control.
2. What steps should I take if I receive a vulnerability report that I believe is a false positive?
Not every report is a real security issue, but it’s always worth taking a careful look before dismissing it.
Double-check details: Sometimes, what seems like a false alarm might be misunderstood. Review the details thoroughly.
Ask for more information: Ask clarifying questions or request additional details through GitHub’s PVR. Many researchers are happy to provide further context.
Check with others: If you’re unsure, bring in a team member or a security-savvy friend to help validate the report.
Close the loop: If it is a false positive, document your reasoning in the PVR thread. Transparency keeps things professional and builds trust with the researcher.
3. How fast do I need to respond?
* Acknowledge ASAP: Even if you don’t have a fix yet, let the researcher know you got their report. A simple “Thanks, we’re looking into it” goes a long way.
* Follow the 90-day best practice: While there’s no hard rule, most security pros aim to address verified vulnerabilities within 90 days.
* Prioritize by severity: Use the Common Vulnerability Scoring System (CVSS) to gauge urgency and decide what to tackle first.
Think of it this way: No one likes being left in the dark. A quick update keeps researchers engaged and makes collaboration smoother.
4. How do I figure out the severity of a reported vulnerability?
Severity can be tricky, but don’t stress! There are tools and approaches that make it easier.
Use the CVSS calculator: It gives you a structured way to evaluate the impact and exploitability of a vulnerability.
Consider real-world impact: A vulnerability that requires special conditions to exploit might be lower risk, while one that can be triggered easily by any user could be more severe.
Collaborate with the reporter: They might have insights on how the issue could be exploited in real-world scenarios.
Take it step by step—it’s better to get it right than to rush.
5. Should I request a CVE before or after publishing an advisory?
There’s no one-size-fits-all answer, but here’s a simple way to decide:
If it’s urgent: Publish the advisory first, then request a CVE. CVE assignments can take 1–3 days, and you don’t want to delay the fix.
For less urgent cases: Request a CVE beforehand to ensure it’s included in Dependabot alerts from the start.
Either way, your advisory gets published, and your users stay informed.
6. Where can I learn more about managing vulnerabilities and security practices?
There’s no need to figure everything out on your own. These resources can help:
Mythic provides flexibility to agent developers for how they want to describe and execute techniques. While this is great, it also means that when operators hop from agent to agent, they can have issues with slight differences between similar commands. Because of this, there have been some requests within the Mythic community to provide a feature similar to Sliver’s amazing Armory project so that, if desired, there can be a more standardized way of executing beacon object files (BOFs) and .NET assemblies.
Introducing Forge
Forge in Mythic
Mythic uses Docker to provide a plug-and-play framework of adding/removing agents and communication profiles dynamically. This means that adding a new Docker container to Mythic simply adds that new agent. You can use that agent to build payloads, get callbacks, and run commands, but that’s all specific to that one agent. The commands from Apollo are not available to another agent like Poseidon, so how can Mythic provide some standardized command across multiple agents?
Mythic 3.3 introduced the concept of a “Command Augmentation” container that in many ways acts the same as a normal agent container. This container brings along new commands to Mythic; however, instead of having them tied to a specific agent, they’re automatically added to all callbacks that meet certain criteria. This criteria can be callbacks on certain operating systems or callbacks based on certain other agents. These “Command Augmentation” containers process the command like normal, but instead of handing that finished command to the agent for execution, it’s handed to another agent’s container for further processing.
Forge is the first “Command Augmentation” container released on the MythicAgents GitHub organization. The Forge Docker image is built with all of Flangvik’sSharpCollection compiled assemblies and Sliver’s Armory of compiled BOFs. Forge offers a few management commands that allow you to list out collections of commands, register assemblies/BOFs within your callbacks, add support for other agents, and more. Let’s look at two examples of what Forge can do.
.NET Assembly Support
Forge Collections SharpCollection
The forge_collections command allows you to list out the available commands that are part of a collection. The SharpCollection and SliverArmory collections exist by default, but you can add new ones at any time. In the output above, we can see the ability to re-download the command (this fetches the .NET versions again from GitHub and can be helpful if there’s a new version released), to register the command (make it available to execute), and some information about the command name and what the assembly does. Clicking the download or register buttons will register the command within this callback and all callbacks that have support with Forge. Let’s say we click the register button for the Rubeus entry. We’ll get a new command we can issue called forge_net_Rubeus; the name of this command allows you to easily identify commands added as part of Forge and if this is a .NET command or a BOF command.
New assembly commands always have the same arguments: the argument string that’s passed to the .NET assembly, the version of the assembly to use, and if this should be executed via execute_assembly (fork-and-run) or inline_assembly (in process).
Forge .NET Parameters
These parameters are always the same for each .NET assembly because in the offensive security community, .NET assemblies are made to take in a single string and do the parsing themselves instead of using named parameters.
BOF Support
Forge Collections Sliver Armory
BOF support in Forge works a little differently thanks to the amazing work that the Sliver team did for their Armory plugins. Unlike .NET assemblies, BOFs have a very specific set of arguments they take, in a specific order, and with specific formats. Many people use BOFs with Cobalt Strike, so they have Aggressor Scripting files created for them that describe these parameters. Unfortunately, this format isn’t usable outside of Cobalt Strike, but the Sliver team went above and beyond to convert many of these to JSON. As part of this, the Sliver team has forked versions many common BOF projects (e.g., https://github.com/sliverarmory/CS-Situational-Awareness-BOF) where they store compiled versions of the BOFs and this converted JSON data in tagged releases.
Forge hooks into their work by fetching the latest tagged release for the command you want to register and extracts the object files along with the extension.json file that describes the BOF’s arguments. Since Mythic already supports defining commands with named parameters, their types, and their orders, Mythic can use the extension.json file to dynamically create Mythic styled parameters.
BOF Argument Support
In this example, the BOF command forge_bof_sa-netgroup , takes three parameters: a number (0 or 1 based on the description) and two strings. Due to Sliver’s format, we can even identify which arguments are required and which ones are optional. Unfortunately, we miss additional context about default values that could be pre-populated, so that’s still up to the individual BOFs or for them to call out in their parameter descriptions.
When an operator submits this task, Forge looks up the associated extension.json file and converts these named parameters back into a normal Mythic TypedArray format that is then passed to a supporting agent’s command (like Apollo’s execute_coff ) for processing before a callback picks it up.
Normally, BOF execution requires an operator to upload the right object file, know the exact types and orderings of parameters for the bof (ex: zisZZZ), and provide the right values in that order. This would require execution like some_bof_command zisZZZ test 3 0 bob testing.com Mozilla. Naturally, this is error prone and not very operator friendly. With Forge, you could instead issue a task like forge_bof_myBof -location test -loops 3 -useAdmin 0 -user bob -domain testing.com -useragent Mozilla. Notice how, especially with all of the parameters being tab-completable, it’s much more operator friendly, especially if you don’t already know all of the parameters needed for the BOF.
Forging Forward
Forge is based on a series of JSON files on disk that describe things like what agents work with Forge, what collections are available, and what commands are available in each collection. You aren’t limited to SharpCollection and SliverArmory though. With the forge_create command, you can upload your own .NET assembly or BOF files (including extension.json) and have those turned into new commands on the fly. If you want to set this up ahead of time though, you can always edit the JSON files directly on disk or through the Mythic UI.
Forge comes with default support for the Apollo and Athena agents, but pull requests are always welcome to provide default support for other agents as well. Additionally, only Flangvik’s SharpCollection and Sliver’s Armory are pre-installed in the container. If the community has other sources of tooling they’d like to see pre-installed, PRs are also welcome.
Mythic has many different kinds of containers and features available, so hopefully Forge will inspire the community about other kinds of “Command Augmentation” containers they can make.
If you aren’t already aware, the BloodHound slack has open invites with a thriving community that discusses Mythic in the #mythic channel. I’m also available on Twitter, BlueSky, and Mastodon if you want to reach out.

 Entrar