As strikes continue on Iran’s nuclear facilities, the real danger isn’t the explosion, but what happens if critical safety systems fail—and how that risk could spread across the Gulf.
A Bellingcat investigation has identified nine Facebook groups with a combined membership of more than 70,000 people, in which coded language has helped illegal wildlife dealers evade bans on the platform for years. Facebook says it prohibits any form of animal trading on its platform.
Investigating the operators behind all nine groups, Bellingcat identified six Facebook profiles that led back to a single broker in Jakarta, Indonesia. This investigation was carried out in partnership with Mongabay. You can read their report in English here and in Bahasa Indonesia here.
In an open Facebook group, brazenly titled “West Bogor Animal Selling and Trading Forum,” one member posts an advert for a vulnerable rhinoceros hornbill.
Screenshots of an online advertisement for a rhinoceros hornbill chick, a protected and vulnerable species, posted on Facebook on July 11, 2025.
Commenting on the advert, another member warns: “Just be careful not to get caught.”
Screenshot of a Facebook conversation, translated from Bahasa Indonesia and posted in July 2025. Annotated by Bellingcat.
“That’s the risk,” replies the seller.
Under Indonesian law, the capture, trade, or possession of a rhinoceros hornbill is punishable by up to five years’ imprisonment or a fine of up to Rp100 million (US$6,000). (According to Statistics Indonesia, the average monthly wage in August 2025 was just over Rp3 million or US$180.)
Meta also states that the buying and selling of animals on its platforms is prohibited. However, in this group, along with eight others identified by Bellingcat, animals have been traded in plain sight for years, including wild and protected species. Three of the nine groups have been live on Facebook for at least five years. Four have been active for 12 months or more, and the remaining two were created in 2025.
Screenshots of tortoises, monkeys, and owls for sale, posted in Facebook adverts in October 2025.
In one of the most active groups, West Bogor Animal Selling and Trading Forum, more than 200 adverts were posted in a single week. Of these, 18 advertised vulnerable species, including these two infant silvery gibbons.
Screenshots of two infant silvery gibbons advertised on Facebook on May 10, 2025.
Otters were also frequently posted in the group. Popular in the Southeast Asian pet trade, most otter species are protected due to declining numbers in the wild. However, because many of the adverts were for infants, it was not always possible to determine which otter species was being sold, and therefore whether it was protected.
“Using Codes So The Group Stays Safe”
Despite Facebook’s total ban on animal trading, including pets, in the group titled: Civet/Pet Buying and Selling in the Greater Jakarta Area, members were instructed in the “About” tab to “prioritise using codes so the group stays safe from being banned.”
Screenshot of the group’s About description. Translated and annotated by Bellingcat.
Alphanumeric codes were used to discuss animal prices in eight of the nine groups identified by Bellingcat. According to the Indonesian news outlet Jateng Today, the use of pricing codes, intended to circumvent Facebook’s automated moderation systems, is not uncommon among animal traders on the platform.
Such codes use the letters A, B, and C to denote different Indonesian rupiah denominations. A stands for a Rp100,000 note (about US$6), while B represents a Rp50,000 note (about US$3). An accompanying number specifies the quantity, so A3 indicates three Rp100,000 notes.
Screenshot of a conversation on Facebook discussing the price of animals. Blurring by Bellingcat.
In the post below, one member asks, “A2 dapet apa?” – “What does A2 (Rp 200,000; US$12) get you?”
Screenshot from the Facebook group ‘Buying and Selling civets/pets in the Greater Jakarta area,’ posted on Facebook, August 6, 2024.
The post received 69 replies, with members offering everything from otters to owls, civets and geckos.
The term “Wc” – a common shorthand in animal trading groups for “wild-caught” – was also frequently used across all nine groups. Under Indonesian law, even if a species is not listed as vulnerable or protected, capturing and selling wild animals without a permit is illegal.
Asked whether its moderation systems could detect cost codes (as text or embedded in images) or key terms such as WC (when found next to images of animals), Meta responded:
“Bad actors constantly evolve their tactics to avoid enforcement, which is why we partner with groups like the World Wildlife Fund and invest in tools and technology to detect and remove violating content.”
The Operators
While investigating the operators behind all nine groups, Bellingcat identified six Facebook profiles that led back to one individual broker based in Jakarta.
By navigating to the “People” tab in one of the groups, a list of admins and moderators appears, including an account referenced below as AB. Despite AB’s profile being locked, a search with the term “wa.” (WhatsApp’s click-to-chat feature) returned dozens of animal adverts alongside a phone number.
Screenshot of AB’s Facebook post including a phone number. Posted June 11, 2025.
Using the phone number to search for AB’s historic posts, six out of the nine groups under investigation were found to have adverts for vulnerable species, including this advert for a binturong.
Screenshot of an advert for a “Bintu” short for binturong. Posted by AB, September 2024.
Listed as vulnerable by the International Union for Conservation of Nature (IUCN), keeping a binturong, let alone trading it commercially, is prohibited under Indonesian law.
AB has also advertised this “Celepuk Wc”, a wild-caught scops owl, seen below. Although the species itself is not protected, selling a wild-caught owl in Indonesia without a permit (which are tightly regulated) violates Indonesian law.
Owls for sale, posted by AB. Left: Labelled “Wc” for wild-caught. Right: “BC” for bred in captivity.
By following the phone number shared by AB, five more Facebook profiles were uncovered. The six profiles frequently shared similar adverts, often within days of each other, for the same species, sometimes featuring a similar interior background, and always listing the same telephone number.
Six different accounts posting similar-looking animal adverts, while all using the same contact phone number.
Late last year, one of the accounts referenced below as W, posted this wreathed hornbill, a protected species in Indonesia.
Screenshot of an advert for a wreathed hornbill. Posted by Waa, November 2025.
Of the six profiles, only one, named Azie Soka Smithh has ever posted personal data, including a profile picture of a man with a child.
An advert for a civet, posted by Azie Soka Smithh and tagging the same phone number as used by the other five accounts.
Further investigation into Azie Soka Smithh confirmed their presence on other platforms, including Telegram and Instagram. However, their full legal name remained unknown. While searching for visual clues to their location, it became apparent that the vast majority of images had been tightly cropped, revealing little about their whereabouts – except for a handful of images that appeared to have been taken at the same location: a pet shop.
In the adverts shown below, a poster can be seen on the wall behind the cage displaying the shop name Station Sato Exotic and a phone number. Of all the images seemingly taken in the same shop, none featured species protected under Indonesian law. However, the long-tailed macaque shown below is considered endangered according to IUCN due to declining numbers in the wild.
Adverts posted by two different accounts but with the same shop name and phone number visible in the background. The right image features a long-tailed macaque.
A Google search for the shop’s name and number returned a Google Maps listing for Station Sato Exotic. A man named “beni” had left a five-star rating as well as several dozen photos and videos of the pet shop’s interior, including one that appeared to show a man sitting next to an identical poster as seen in the animal adverts.
Screenshot of Beni’s Google review, including (right) a video of a man sitting beside a poster for Station Sato Exotic. Posted July 2021.
According to beni’s Google account, his full name is Beni Abdul Hamid (translated from Arabic). His bio reads: “We sell various kinds of accessories, cages, animal feed, etc” (translated from Bahasa Indonesia).
Of the 16 photos and 25 videos posted by Beni, several showed a left hand holding animals up to the camera, with a distinctive mole visible on the wrist. A seemingly identical mole appeared in several of the adverts posted by the six Facebook accounts sharing the same phone number. Notably, the mole and wrist were not seen holding species protected under Indonesian law. However, the long-tailed macaque shown below is considered endangered according to IUCN.
A distinctive mole appears in multiple animal adverts posted by (left) Beni on Google Listings, (centre) AB on Facebook and (right) another of the six accounts using the shared phone number. The centre and right images feature a long-tailed macaque.
Upon visiting Station Sato Exotic, our partners at Mongabay confirmed that Google reviewer Beni Abdul Hamid was in fact the owner. His son, Jordan Bastian, who was present on the day, told their reporter he now manages the shop on his father’s behalf.
Bastian confirmed that it was his wrist and mole in the adverts and that he had taken all of the photos inside the shop. However, he said he was not behind any of the six Facebook accounts and that they were most likely run by a local broker. He explained that his business relies on a network of brokers operating on Facebook and WhatsApp. He sends them photos of the animals he has for sale, and they handle sourcing and organising everything with the buyer in exchange for a cut of the profits.
“I’m a broker. I’m involved in marketing the animals, so I provide the photos,” said Bastian. “I don’t want to know about the buyer.”
When shown the Facebook account for Azie Soka Smithh, Bastian confirmed that the man in the profile picture was a local broker, but one who seldom visited the shop.
Station Sato Exotic Pet Shop also has an online presence on Tokopedia, a major Indonesian marketplace. The platform’s guidelines prohibit the sale of endangered species, but are not clear regarding the sale of other animals, including pets.
Of Station Sato Exotic’s 71 current listings, the large majority have been miscategorised. Animals are listed as tools, toys, aquarium decorations and books. They are also miscategorised as other species; for example, birds and squirrels have been listed as hamsters or reptiles.
One advert features a vulnerable cuckoo species, the Sunda Coucal. Endemic to Java and numbering fewer than 10,000, this bird has been listed as vulnerable since 1994.
Screenshot of Station Sato Exotic’s Tokopedia page promoting the sale of a vulnerable cuckoo species. The page reports that four birds have already been sold.
Asked whether he had sold many animals via Tokopedia, Bastian said his account had been blocked after he was banned for selling squirrels. When shown the advert above for the Sunda Coucal, he said he was surprised to learn it was classified as vulnerable. Tokopedia did not respond to requests for comment regarding an advert for a vulnerable species appearing on their platform.
On the sale of protected or vulnerable species more broadly, Bastian admitted he had in the past, but has since stopped, describing “the risk is big” and saying he prefers to “play it safe.”
After contacting the local authorities for comment, three officers from the West Java Natural Resources Conservation Agency (BBKSDA) made a surprise visit to Station Sato Exotic, due to the shop having previously been reported for selling protected species. Head of Conservation Stephanus Hanny said that upon arrival, “We went inside and checked every animal… We did not find any protected species.” He added that even the sale of non-protected wildlife requires a permit, which the shop does not currently hold. However, since it’s not a criminal offence, Hanny said they could only issue the owners with a warning.
Bellingcat also contacted the phone number associated with Azie Soka Smithh. The person replied, confirming they managed all six accounts but denied selling any animals, including protected and vulnerable species. “I’m just a hobbyist. An animal lover,” they said.
Support Bellingcat
Your donations directly contribute to our ability to publish groundbreaking investigations and uncover wrongdoing around the world.
Given that the account had been found advertising vulnerable and protected species for sale, the Indonesian Director General of Forestry Law Enforcement, Dwi Januanto Nugroho, said authorities would investigate. Asked how their team of investigators was adapting to the illegal wildlife trade growing online, Nugroho replied:
“Criminal behaviour continues to reproduce itself in order to survive. In fact, it can evolve faster than the law enforcement system itself. In response …cyber patrols and desk analysis via the operations room will continue to be intensified, while we further optimise support from volunteer networks, working partners, and public participation.”
After contacting Meta, all six accounts, including Azie Soka Smithh, and all nine groups, totalling 70,000 members, were shut down. Meta confirmed: “We removed the Facebook groups and profiles in question for violating our Restricted Goods and Services Policy.”
Merel Zoet and Claire Press contributed to this report.
Bellingcat is a non-profit and the ability to carry out our work depends on the kind support of individual donors. If you would like to support our work, you can do so here. You can also subscribe to our Patreon channel here. Subscribe to our Newsletter and follow us on Bluesky here and Mastodon here.
Explore how outdated data management practices hinder efficiency and innovation. By challenging familiar habits, organizations can simplify data processes, improve systems, and cultivate a culture of problem-solving.
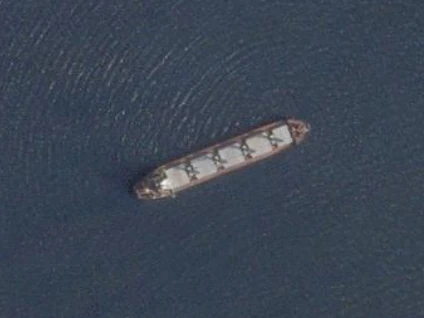
A shipwreck in India, an ammunition seizure in Senegal, and a raid on an oil tanker in Malaysia – all three incidents involve ageing vessels, operating with false papers and one recurring figure: Captain Suniel Kumar Sharma.
In a recent interview with the Financial Times, Sharma said his most prominent flag registry, the International Maritime Safety Agency of Guyana (IMSAG), was no longer operational. However, a Bellingcat investigation has found certificates issued by IMSAG as recently as December 2025. In the same interview, Sharma denied setting up any more registries. Yet Bellingcat has found evidence of a newly launched website linked to Sharma offering flag registration in Nicaragua.
The Basra Star became a local tourist attraction during the five years it lay rusting on the beach. Instagram post, December 2025.
The insurance report states Basra Star was sailing under a Samoan flag and its classification society (the company that certifies the vessel as seaworthy) was Ascent Navals.
Two years before MT Basra Star ran aground, the Samoan government and the IMO issued a warning about a fraudulent company called Ascent Navals, and its director, Captain Suniel Kumar Sharma, for appearing to operate on behalf of Samoa, but without official authorisation.
Bellingcat contacted the vessel’s owners, Shat Al Arab Marine Supply LLC, the insurance surveyors, Uday Bhogate & Associates, and Ascent Navals and its director, Suniel Kumar Sharma. None responded to requests for comment.
Nearly two years after Basra Star was shipwrecked, another ageing vessel, Eolika (IMO 8214968), was found operating under a false flag while laden with illicit cargo. At the port of Dakar, Senegalese customs officers boarded the 39-year-old cargo ship and discovered three concealed containers of ammunition, reportedly worth US$5.2 million. Eolika was flying a false Guyana flag.
In an open letter, the IMO, together with the Guyana authorities, denounced the flag under which Eolika was sailing as false. They warned of a fraudulent company, the International Maritime Safety Agency of Guyana (IMSAG), for flagging vessels without authorisation from any flag state. Guyana’s police force said it would investigate “this rogue enterprise led by Captain Suniel Kumar”, together with Interpol.
There is no suggestion that Sharma or IMSAG took part in the transport of illicit goods. The IMO warning was issued in response to IMSAG supplying false paperwork, which then enables vessels to operate without oversight. Flying a false flag for a registry that doesn’t exist voids any insurance, risks crew safety and threatens environmental harm, as seen with the Basra Star.
Support Bellingcat
Your donations directly contribute to our ability to publish groundbreaking investigations and uncover wrongdoing around the world.
Nora (left) and Rcelebra (right) moored together during an unauthorised ship-to-ship transfer off Penang. Source: MMEA/Facebook
Both captains and 53 members of the crew were detained. The cargo of crude oil was valued at more than RM512 million (US$130 million), according to the MMEA.
53 crew members were arrested, according to MMEA. Source: MMEA/Facebook
However, within days, both tankers were released. Fined the maximum penalty of RM300,000 (US$76,000) for an unauthorised ship-to-ship transfer, the MMEA acted to enforce Malaysia’s environmental and maritime safety laws, but not International and UN sanctions. Asked if this was within its remit, the MMEA did not respond to our request.
There is no indication that Sharma or IMSAG knowingly issued flags to criminal actors. But by providing false paperwork, the IMO warn that fraudulent flag registries are enabling high-risk vessels to continue operating.
The promise of investment and the signing of an MoU
Crucial to understanding how IMSAG has continued to operate as a fraudulent registry for so long is that it was once legitimate.
Back in 2021,Guyanan media described how IMSAG was making investments of US$35 million, creating hundreds of jobs, and constructing a state-of-the-art training facility – all presented as a way to grow Guyana’s maritime industry.
Sharma (centre) and his wife (centre-right) pose with Guyanese officials after announcing a US$35M investment in Guyana’s maritime industry, March 2021. Source: Ministry of Public Works/Facebook.
Screenshot of Guyana’s official notice terminating all relations with Sharma. Source: MARAD.
Whilst the MoU was in effect, IMSAG had served as Guyana’s official international ship registry. The domain imsag.org was used to register and flag vessels on its behalf. But after the MoU was terminated, instead of shutting the company down, IMSAG continued to operate without Guyana’s authorisation. A redacted version of the MoU is still live and being promoted on IMSAG’s website.
Screenshot from imsag.org, January, 2026. The yellow box added by Bellingcat highlights the continued promotion of the MoU, which Guyana terminated in 2021.
In a recent interview with the Financial Times, Sharma confirmed he had set up a ship registry in Guyana, but said it had been “discontinued” after the authorities withdrew consent. He also said the domain imsag.org was “not operational just informative”.
Bellingcat recently downloaded 230 vessel certificates for 87 ships from imsag.org, including the sanctioned tanker recently seized by the Malaysian authorities, Nora.
Nora is still broadcasting the call sign ‘8RKK9’ as shown in this certificate issued by IMSAG.
Counter to Sharma’s claims that IMSAG was no longer operational, all 230 certificates found by Bellingcat were issued well after the MoU was terminated in March 2021, including some as recently as December 2025. Of the 87 certified vessels 63 were oil tankers, with an average age of 24 years. Diana 1 (IMO 9212229), for example – a 26-year-old oil tanker last seen in Libya – was issued a certificate by IMSAG on June 26 2025.
According to Equasis data, Diana 1 hopped to a false Guyana flag on July 1 2025.
Screenshot of Equasis data for Diana 1 showing flag as Guyana False.
Neither Sharma nor IMSAG responded to our request for comment regarding our findings that IMSAG had continued issuing certificates as recently as December 2025, despite Guyana having terminated the MoU and withdrawn its authorisation.
For a full list of the 87 vessels, including certificates and details of our methods, click below to expand:
See full certificate list and methodology
The table below lists all 87 vessels and 230 certificates that Bellingcat found records for on imsag.org. Hover over each certificate for details, or click to see an archived screenshot. Each vessel’s flag history has been pulled from the maritime database Equasis to compare when the vessels switched to the Guyana flag and when they were issued a certificate from IMSAG.
Methods:
The IMSAG website allowed users to search using either a “Certificate Number” or an “Official Number.” The search returned information about a vessel, including the dates on which certificates were issued. While these certificate numbers were not publicly disclosed, Bellingcat found a seafarer certificate via a Google search for “site:imsag.org filetype:pdf”, which locates PDFs hosted on IMSAG’s website. By changing the URL to look for ship certificates instead, imsag.org returned a vessel certificate for the oil tanker, Tranquilus.
Bellingcat then tested sequential variations of certificate and official numbers, returning 230 certificates issued by IMSAG. As not all certificate numbers were sequential, this index represents only a partial view of IMSAG’s recent activity.
Expanding Operations in Nicaragua
In Sharma’s interview with the Financial Times, he denied he was setting up any more registries and said he had left the maritime sector entirely. Yet Bellingcat has found evidence of a new registry with links to Sharma that appears to be offering flag registration in Nicaragua.
In July 2025, the domain niataregister.com was launched, promoting the Nicaragua International Aquatica Transportation Administration (NIATA).
The website is active. Bellingcat found a certificate issued as recently as February 2 for the sanctioned tanker and member of the shadow fleet, Al Jafzia (IMO 9171498, sanctioned under the name Chil 1).
Screenshot of a vessel certificate issued for Al Jafzia, February, 2026.
Despite multiple requests, the Nicaraguan authorities did not respond to our questions as to whether they had heard of NIATA or had any official partnership with the company.
According to the IMO’s GISIS database, Nicaragua has not approved any organisation to issue flags on its behalf. The IMO also confirmed directly to Bellingcat that Nicaragua had provided no further information beyond what was visible in GISIS at the time of publication.
Bellingcat downloaded all publicly available forms from NIATA’s website. Analysing document metadata revealed the creator of the documents as ‘Oceaniek Technologies’.
Screenshots: (left) form downloaded from the NIATA website, December 2025; (right) form metadata showing author as Oceaniek Technologies.
Navigating to the Oceaniek Technologies homepage (shown below), under the headline ‘Our Products’ 11 companies were promoted in a looping carousel up until August of last year. It now features only five, spanning a wide range of industries, including a cricket league, a hospital and streaming services.
Top – Oceanik Technologies homepage. Bottom – four of the 11 companies promoted up until August of last year. Shown left to right: IMSAG, a cricket league, streaming services, and a hospital. Screenshots captured August, 2025.
The managing director of Oceanik Technologies, according to his own LinkedIn, is Suniel Sharma. Sharma has also been photographed by local Indian media, cited as the “MD of Oceanik Technologies”.
Screenshot of Sharma’s LinkedIn profile from December 19 2025.
Also among the 11 companies promoted up until August of last year were the Nautilus Times and Nautilus Register.
Screenshots taken August, 2025.
Promoting vessel classification services, Nautilus Register, appears as an entity of interest in OpenSanctions due to its ties with several sanctioned vessels, including members of the shadow fleet. Sharma’s own LinkedIn lists him as the Director General of the Nautilus Register.
Screenshot of Sharma’s LinkedIn profile, dated 19 Dec.
Bellingcat confirmed nautilusregister.net is still active, issuing classification certificates as recently as January 2026 (shown below). The IMO told Bellingcat that Nautilus Register is not listed as a recognised organisation in their database, GISIS.
Certificate issued January 13 2026, via nautilusregister.net. Metadata contained within the PDF listed Sharma as the author.
A search for the second company, Nautilus Times, led to a website offering dozens of training courses, from cadetship to firefighting, as well as competency training.
Competency training is a requirement for all seafarers. Crew members may attend a course in any jurisdiction, but it’s then up to the flag state (the country in which the vessel is registered) as to whether that training is recognised.
According to the Nautilus Times website, a crew member can enrol in any one of six jurisdictions, as shown below, including Guyana and Nicaragua.
Screenshot of the Nautilus Times website offering competency training fees for six jurisdictions, highlighted by a yellow box. Annotations by Bellingcat.
After contacting all six jurisdictions, the official Maritime Administration Department (MARAD) of Guyana confirmed that Nautilus Times was not authorised to issue certificates to seafarers on their behalf. They reiterated that they had no relationship with Nautilus Times or Sharma. St Maarten has previously said that it does not have an international flag registry and therefore does not issue competency certificates. No other jurisdictions replied to our request.
Bellingcat contacted both the Nautilus Times and Sharma to ask why the site was advertising courses on behalf of Guyana and St Maarten without their authorisation. Neither replied to our request for comment.
Finally, two more companies embedded in the carousel on Oceaniek Technologies’ homepage, but deleted after August 2025, were the MSTA Registry and Aruba Maritime.
Screenshots of two of the 11 companies promoted in a carousel embedded on Oceanik Technologies’ homepage. Captured August 2025.
Subscribe to the Bellingcat newsletter
Subscribe to our newsletter for first access to our published content and events that our staff and contributors are involved with, including interviews and training workshops.
Neither Oceaniek Technologies nor Sharma responded to our request for comment regarding the nature of these companies’ connection to Oceaniek Technologies.
Merel Zoet and Claire Press contributed to this report.
Bellingcat is a non-profit and the ability to carry out our work depends on the kind support of individual donors. If you would like to support our work, you can do so here. You can also subscribe to our Patreon channel here. Subscribe to our Newsletter and follow us on Bluesky here and Mastodon here.
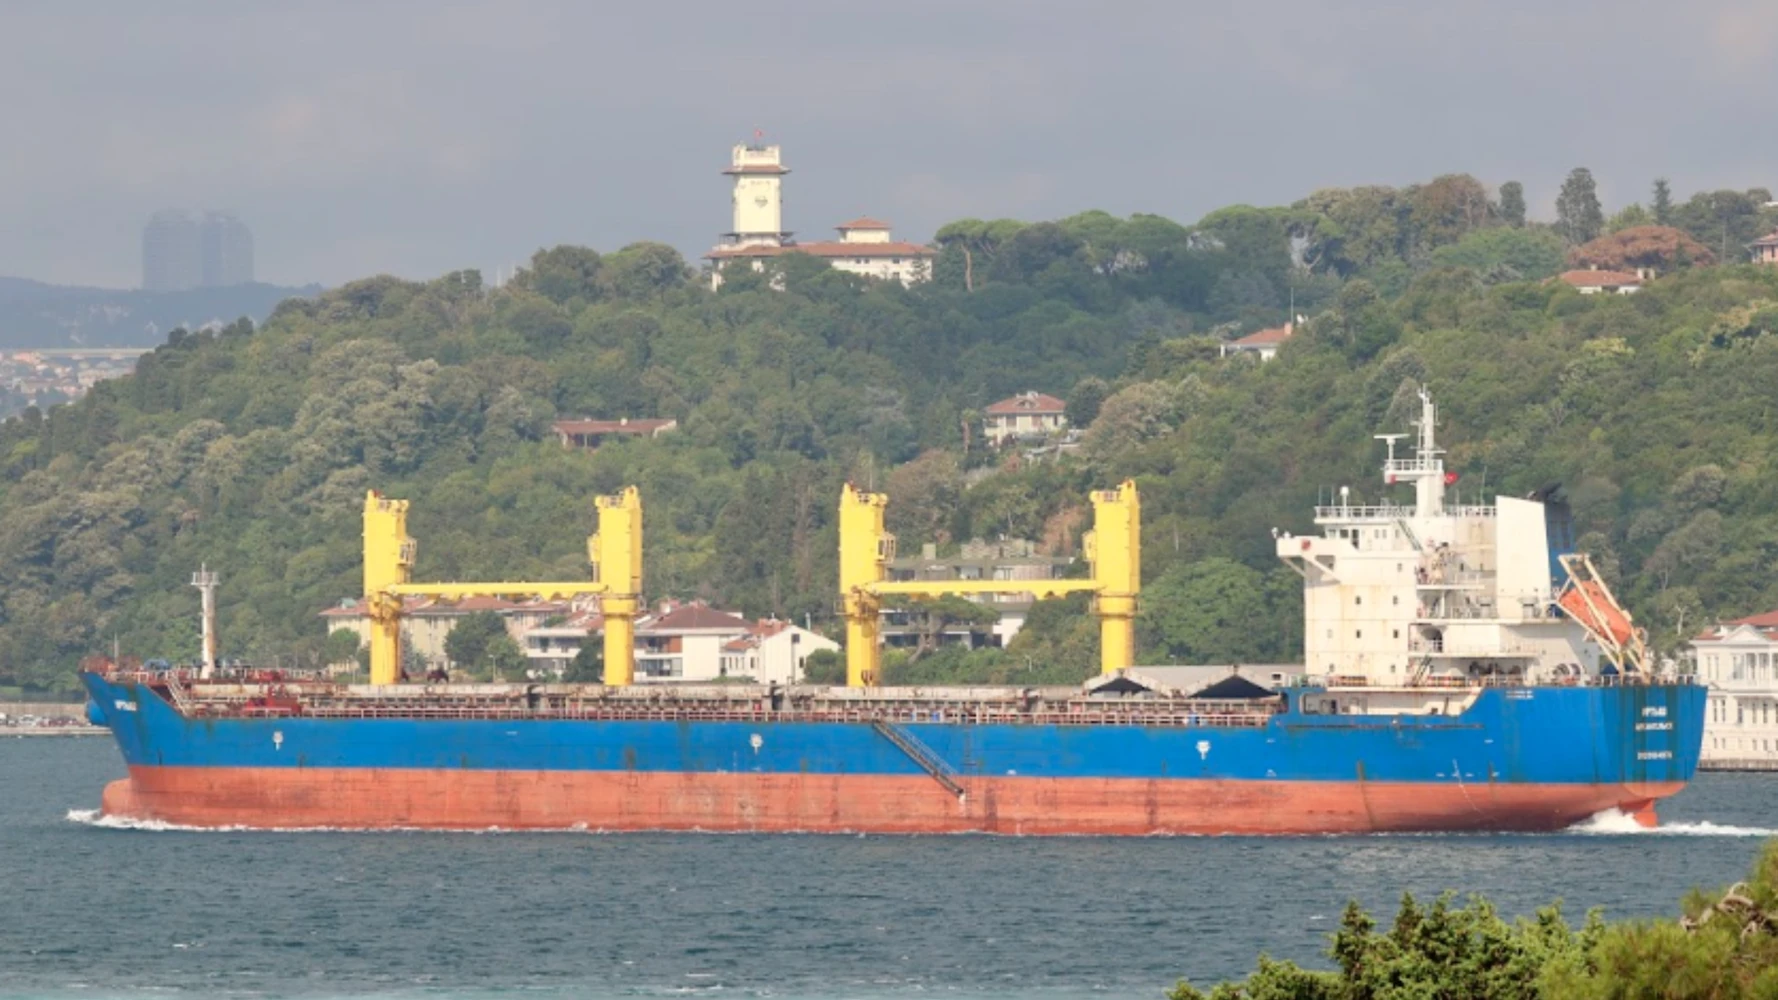
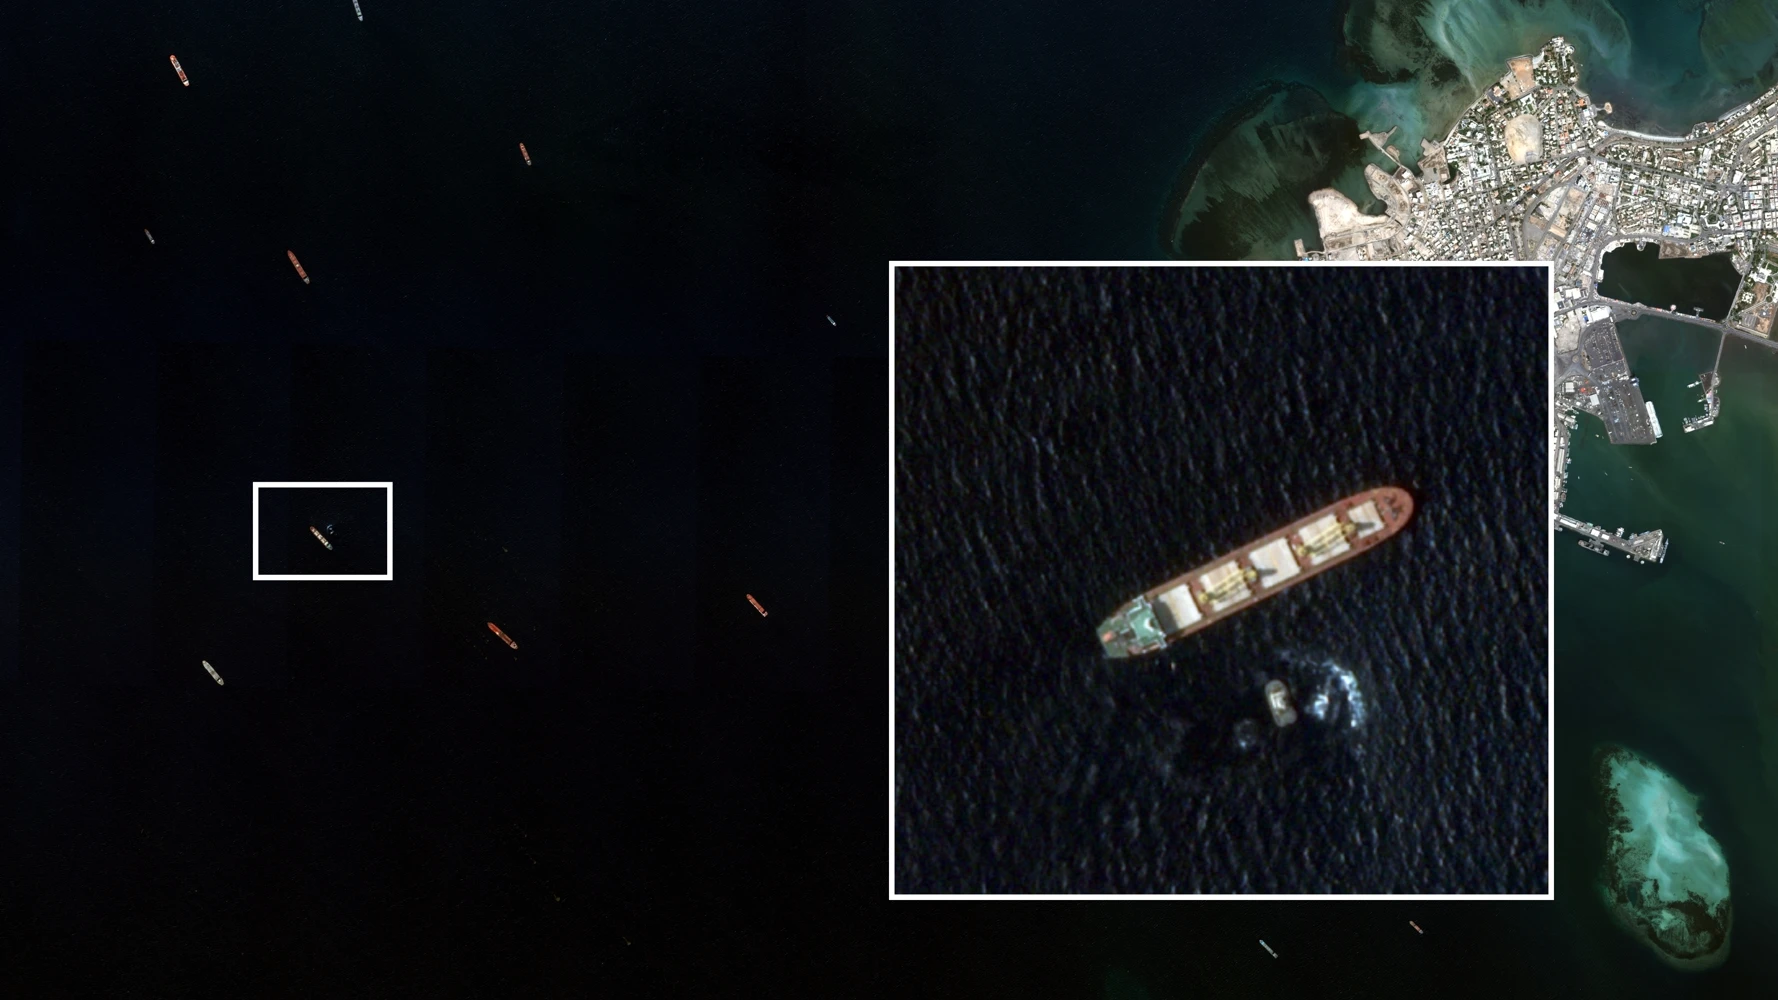
An investigation by Bellingcat has identified yet another Russian-flagged bulk carrier, Irtysh (IMO: 9664976), operating in defiance of Western sanctions by exporting grain from occupied Crimea to Houthi-controlled Yemen.
Following the same pattern of deceptive methods used by other vessels involved in what Ukraine describes as “grain theft,” Irtysh disabled its location tracking en route to and from the Port of Sevastopol. The vessel also made a mandatory stop in Djibouti for inspection by the United Nations Verification and Inspection Mechanism (UNVIM) for Yemen before sailing on to the Port of Saleef, Yemen.
The majority of UN member states have repeatedly voted against Russia’s invasion of Ukraine. UNVIM told Bellingcat: “As a UN mandated body UNVIM does not have the authority to block shipments based on unilateral national or regional sanctions.” They added: “The UNVIM mandate is limited to verifying compliance with the UN Security Council resolutions related to Yemen.”
However, experts have previously highlighted to Bellingcat that even with the limitations of that remit the fact that grain shipments from occupied Ukrainian territories are passing through UN inspection mechanism creates an awkward situation.
Bellingcat mapped Irtysh’s journey by combining Automated Identification System (AIS) data from Lloyd’s List Intelligence and satellite analysis. During the investigation, two additional vessels were also identified with their tracking systems disabled while loading grain in Sevastopol: Matros Pozynich (IMO: 9573816) and Zafar (IMO: 9720263).
All cargo vessels must be inspected in Djibouti before proceeding to Houthi-controlled ports. AIS data showed Irtysh anchored off Djibouti for six days.
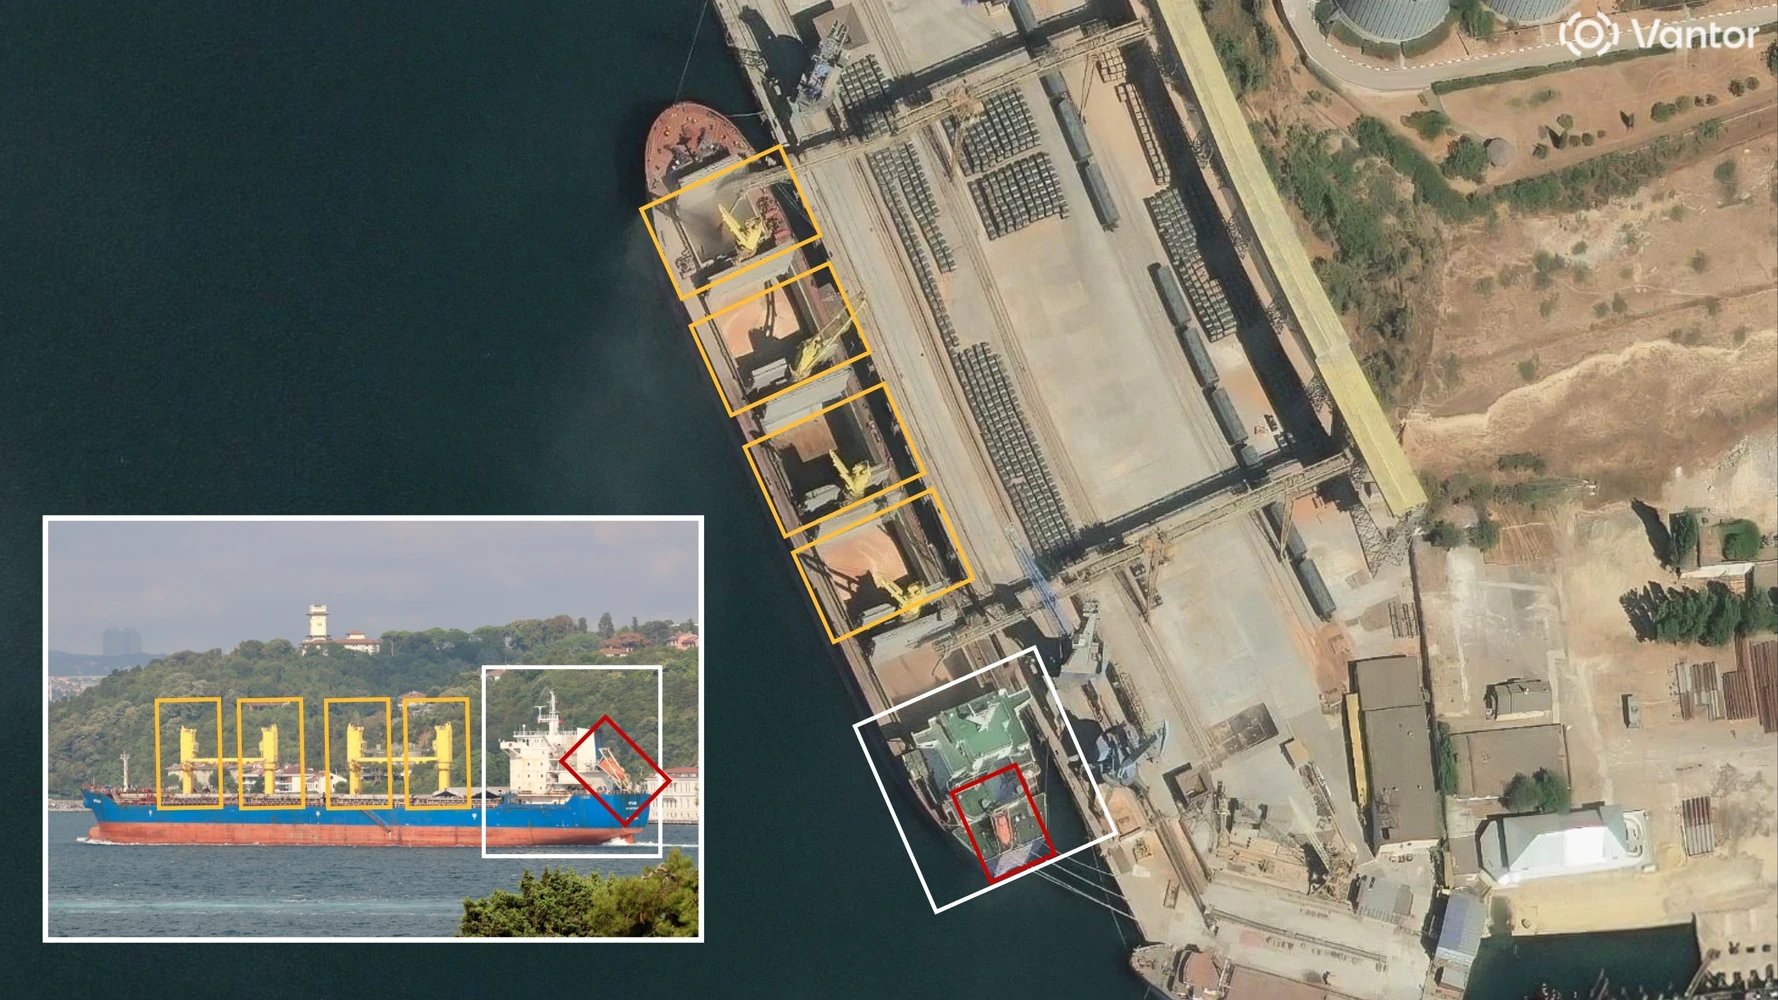
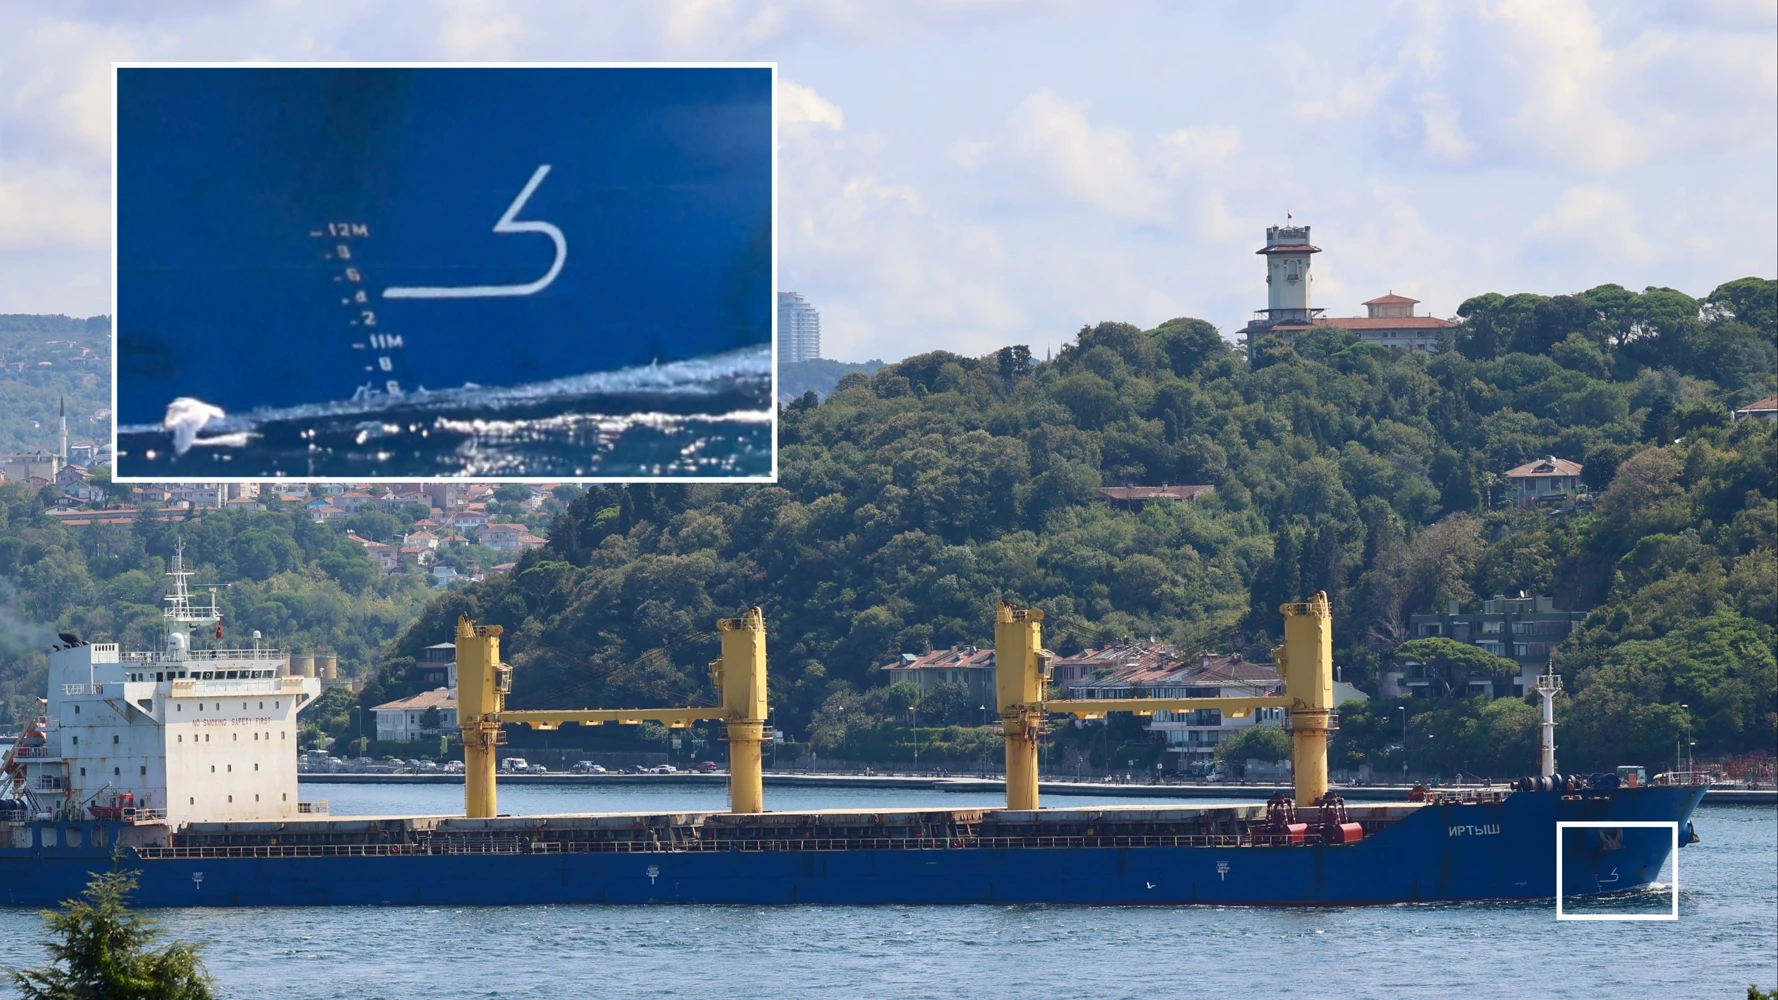
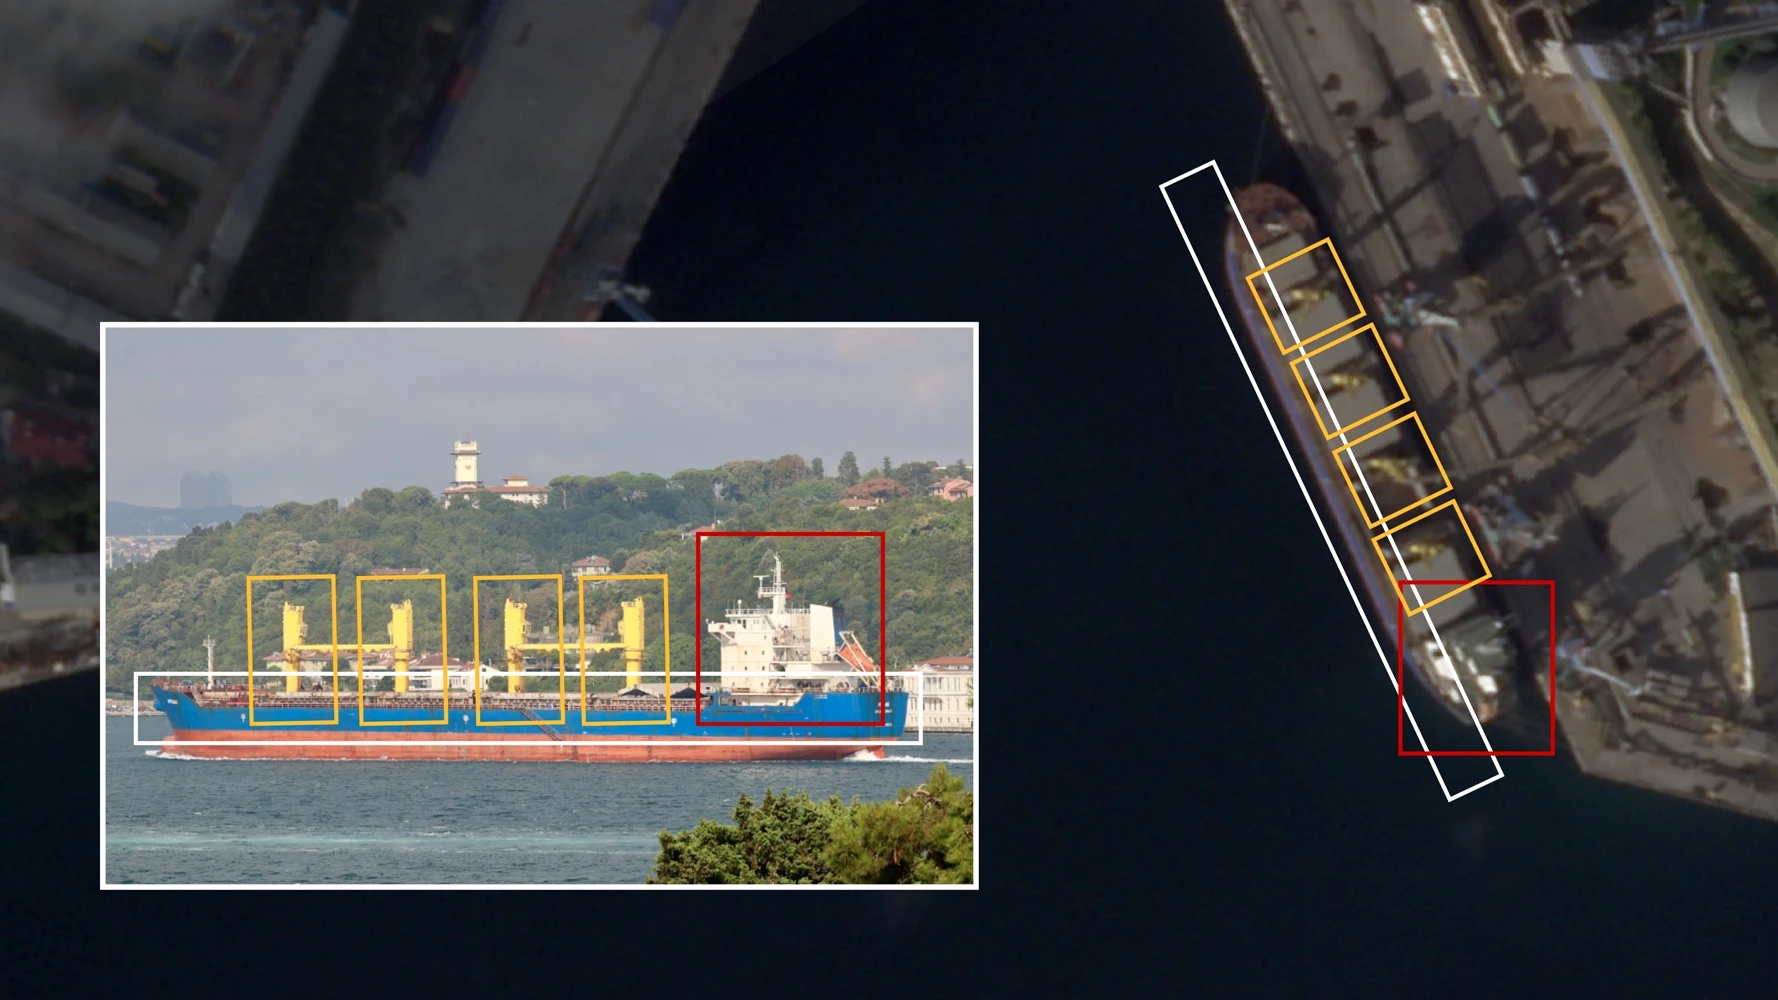
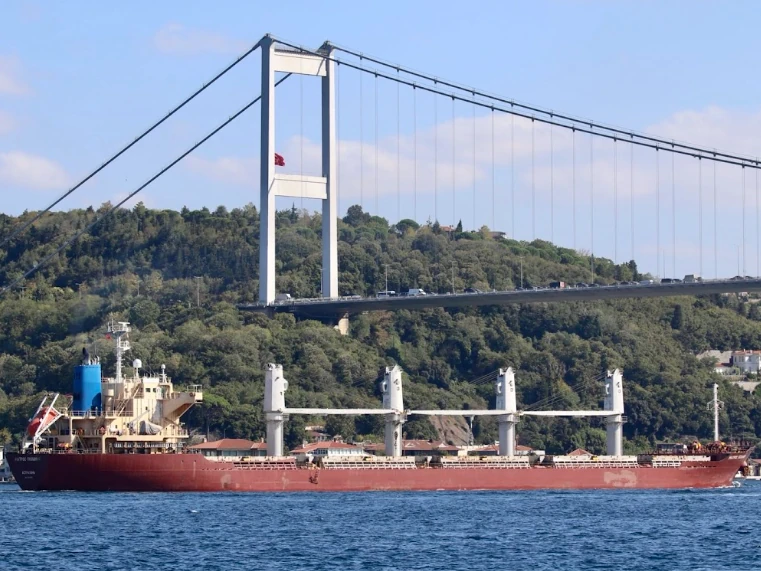
Two days later, Matros Pozynich switched its AIS back on before sailing through the Bosphorus Strait, just as Irtysh had. With its hull sitting low in the water, the vessel was photographed passing through Turkish waters seemingly fully laden.
After calling at Djibouti, likely for inspection by UNVIM, AIS data shows the bulk carrier departing for Saleef, Yemen, on Oct. 8. At time of publication, Matros Pozynich remains in anchorage off the Port of Saleef, Yemen.
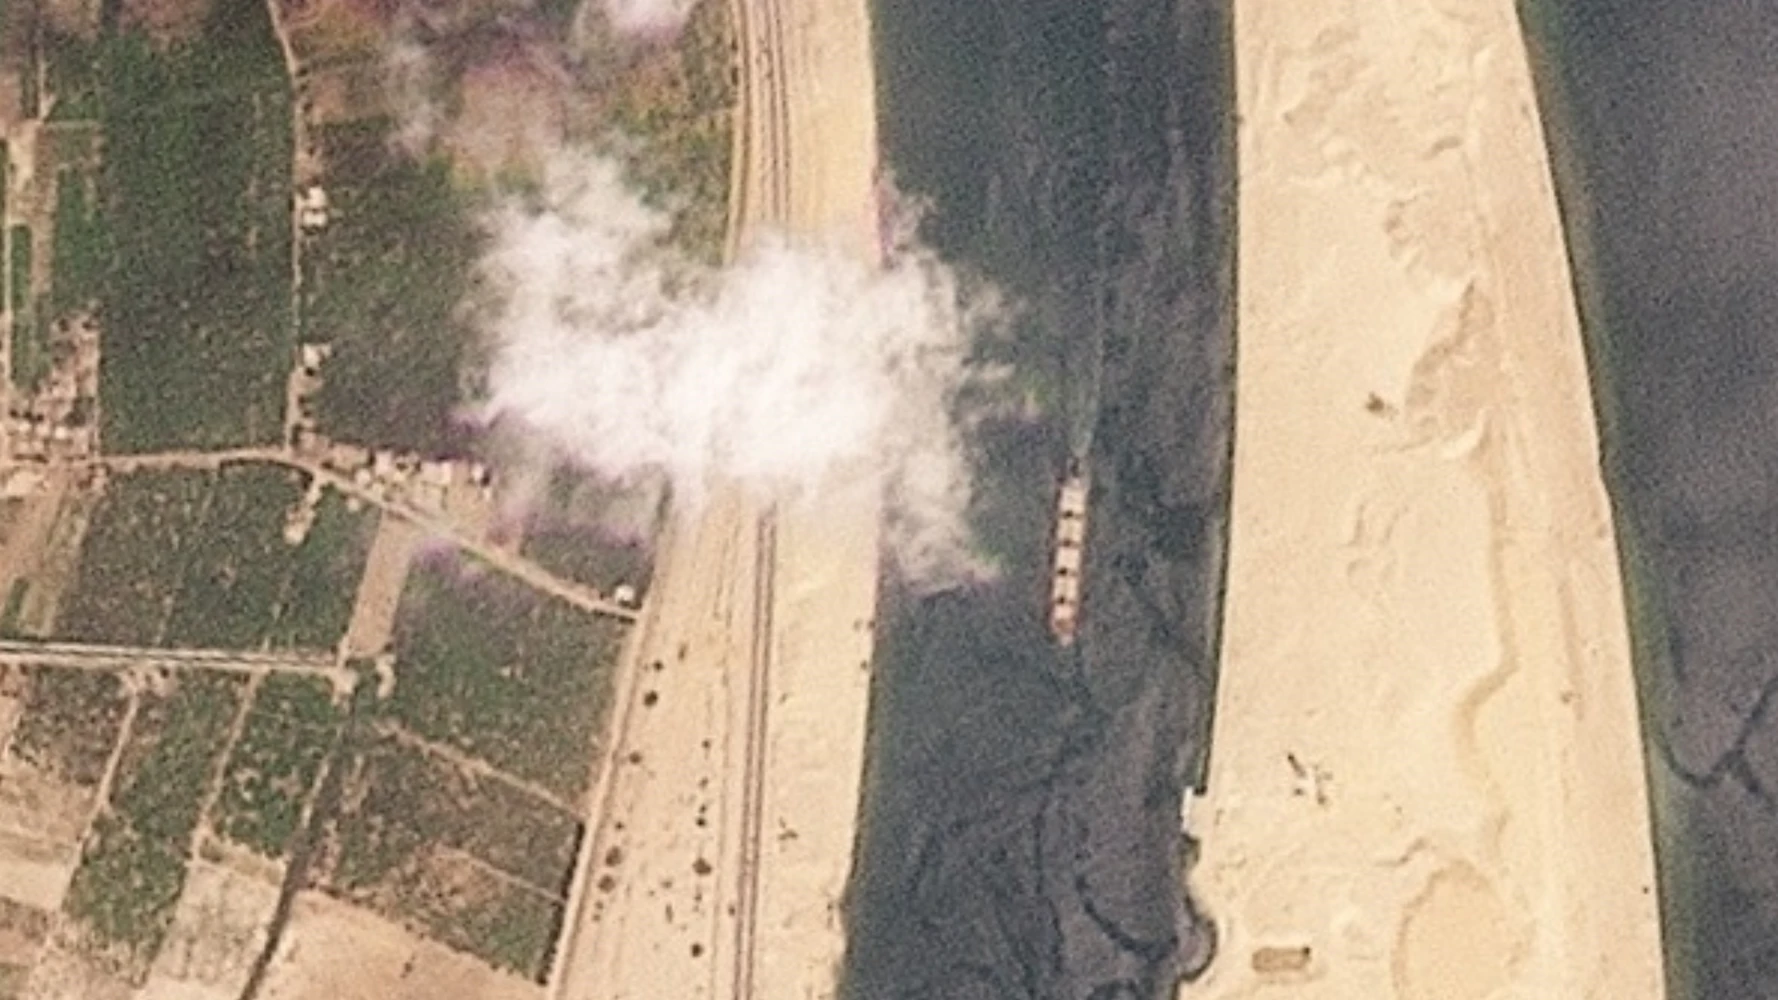
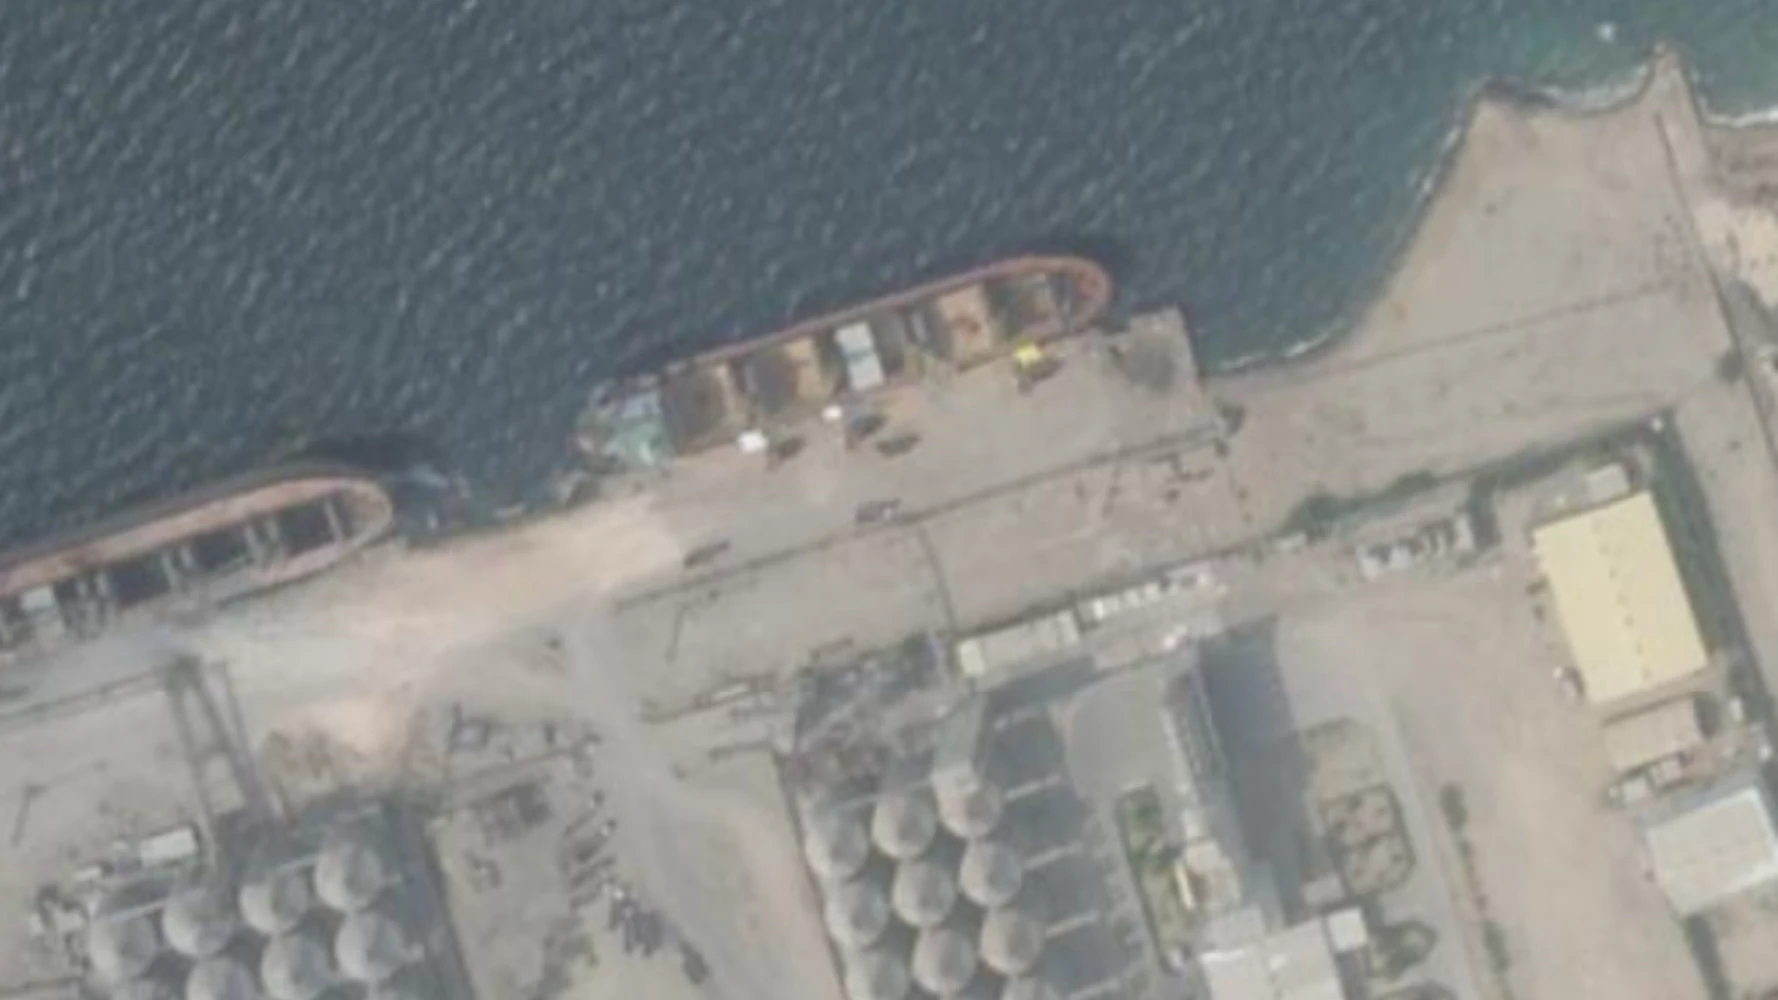
A third vessel, also previously implicated for smuggling grain, Zafar, was captured by satellite imagery with its AIS turned off at the Port of Sevastopol from Sept. 23.
At the time of publication, Zafar had not sailed to Yemen via Djibouti. Instead, it was anchored off the Port of Alexandria, Egypt – another known location for offloading grain from occupied Ukraine, according to OCCRP reporting.
“Grain Theft”
Ukraine has repeatedly tried to dissuade countries from purchasing shipments loaded with what it describes as stolen grain from occupied regions.
The Port of Sevastopol and the Avlita grain terminal remain under European,UK and US sanctions. While no UN sanctions specifically target the port, a majority of UN member states have passed resolutions condemning Russia’s invasion of Ukraine and of its occupation of Crimea since 2024.
Support Bellingcat
Your donations directly contribute to our ability to publish groundbreaking investigations and uncover wrongdoing around the world.
Both Irtysh and Matros Pozynich delivered grain to the Houti-controlled Port of Saleef via Djibouti – the UNVIM inspection point for Yemen. After ten years of war, the UNHCR reports that tens of thousands of people in Yemen are living in famine-like conditions, with a further five million people experiencing food insecurity.
UNVIM confirmed to Bellingcat that the Irtysh was inspected “in line with UNVIM operational protocols” on Sept. 7 and cleared by the Saudi-led coalition Evacuation and Humanitarian Operations Cell (EHOC) – a body entirely separate from the UN – on Sept. 8.
Asked whether UNVIM was aware the vessel had picked up grain from a port under Western sanctions, the agency replied: “The UNVIM mandate is limited to verifying compliance with the UN Security Council resolutions related to Yemen. Unilateral national sanctions or measures beyond that scope are outside the UNVIM mandate.”
Neither the Russian government nor its foreign ministry responded to requests for comment.
Yörük Işık, Bridget Diakun, Peter Barth, Galen Reich, Claire Press and Merel Zoetcontributed to this report.
Bellingcat is a non-profit and the ability to carry out our work is dependent on the kind support of individual donors. If you would like to support our work, you can do so here. You can also subscribe to our Patreon channel here. Subscribe to our Newsletter and follow us on Twitter here and Mastodon here.
Late last month, fires engulfed Namibia’s most visited wildlife reserve – Etosha National Park. An analysis of satellite imagery by Bellingcat has found that more than a third of the park was affected, impacting crucial grazing lands for endangered species, including black rhinos, giraffes and elephants.
Wildfires began on Sept. 22 and swept through the reserve and surrounding areas for five days before an emergency government meeting on Saturday, Sept. 27. After days of extensive burning, the government deployed 500 troops to the region the following day.
Etosha National Park – SWIR Band Imagery, Sept. 20, 25, 27 and 30. Source: Copernicus
Optical satellite imagery from NASA shows an area of at least 6,000km² was impacted, including agricultural areas beyond the park’s northern border, in the time taken for the government to call an emergency meeting.
Satellite imagery shows the main wildfire rapidly spreading north and east. The development of a second fire, visible in the bottom right-hand corner from the 25th onwards, has not been included. Source: NASA.
The satellite imagery below from Sept. 25 shows burn marks from the fires breaching the park’s northern border, surrounding villages and farmland. Speaking to local media, residents and volunteers said the fire was impossible to extinguish without more support, including fire trucks and helicopters.
Park border outline is breached Sept. 25, with the fire extending further north into farmland by Sept.30. Source: Copernicus.
By Oct. 1, international media reports stated between 7,500 to 8,500 km² of the park had been scorched by the fire. Bellingcat’s analysis of NASA satellite imagery showed at least 7000km² – more than a third of the national park – was affected.
As a vast area of savanna grassland, fires – often ignited by lightning – are a natural part of the park’s ecosystem, says Prof. Theo Wassenaar, a specialist in biodiversity conservation from Namibia University. However, the scale of this most recent fire is rare.
“Savanna without fires is not a savanna” says Prof. Wassenaar. But “this Etosha fire was notable because it was very large,” he says – “a gigafire (more than 1,000,000 ha)”.
The Namibian Ministry of Environment, Forestry and Tourism did not respond to our request for comment on the time taken to deploy troops to fight the fire.
However, in a public release the Ministry said: “The wildfire crisis in Etosha National Park and surrounding areas poses a significant threat to Namibia’s biodiversity, local livelihood and critical infrastructure.
Origins of the fire
In a post on Facebook, Prime Minister Tjitunga Elijah Ngurare claimed the fires “began on 22 September 2025 in the south-western part of the park due to suspected charcoal production activities on bordering commercial farms.”
NASA FIRMS data matches the Prime Minister’s statement, indicating the fire originated just beyond the park’s south-western borders. As seen below, NASA FIRMS employs a colour classification system to show how long ago an active fire was detected. The yellow square below indicates this latest Etosha wildfire was first detected at 15:25 on Sept, 22.
NASA FIRMS data from Sept. 22 shows a single yellow square just beyond the park’s borders, marking the earliest fire event that day. Orange and red squares indicate more active fires detected later the same day. Source: NASA FIRMS.
Further analysis of the yellow square’s location using satellite imagery confirms fire damage occurred on Sept.22, the first day of the event. Weather data from the same day, via Zoom.Earth, also supports this, with the fire’s outward spread aligning with a north-easterly wind direction.
Google Earth imagery also confirmed the presence of a small village and several charcoal kilns near the location identified as the earliest active fire by NASA FIRMS. However, without an extensive ground investigation, the exact cause of the fire cannot be determined.
Charcoal kilns, blackened earth, and small dark mounds suggest ongoing charcoal production near the yellow square location identified by NASA FIRMS. Source: Google Earth.
The Ministry did not respond to Bellingcat’s request for comment as to why they suspect the fire began in this location.
Casualties of the Fire
Within days of the fires engulfing large swathes of the park, an image of an injured elephant, badly burned, began circulating on social media.
In response to a flurry of commentators challenging the authenticity of the image, the Minister of Environment, Forestry and Tourism, Indileni Daniel, told reporters at a press conference they could not confirm the image had been taken within Etosha Park, nor could the elephant be confirmed as one of the casualties of the most recent fires. At that time, the only confirmed animal losses – identified by government helicopters monitoring the area – were nine antelopes, one elephant and one injured pangolin.
In an interview with a local news outlet, Network Media Hub, the photographer Koos Reyneke described taking the photo of the injured elephant near a watering hole “just before Charl Marais Dam.” Bellingcat was able to geolocate the image to Ozonjuitji m’ Bari, a waterhole close to the Charl Marais Reservoir.
Top: Facebook post by Koos Reyneke featuring a burned elephant (left). Bottom – YouTube video from 2023. Both geolocated to Ozonjuitji m’Bari, as tagged in Google Maps.
Three termite mounds are visible in both the photographer’s image of the burned elephant posted to Facebook and in a 2023 YouTube video filmed in Etosha Park. Termite mounds can take years to build and may last for hundreds of years. Additional matching features include the horizon line rising to the left, similar bush patterns, and the mud pool in the foreground, which is overflow water from the nearby waterhole.
Shadow analysis using SunCalc – a tool that helps users analyse the position of the sun and shadows to estimate the time an image was taken – lined up with the photographer’s statement that the photos, including that of the injured elephant, were captured at around noon on Sept. 28.
Zooming in on a photo of a jackal with a clearly visible shadow, SunCalc estimated the shadow length to be 42% of the animal’s height. By recreating the sun and shadow positions, SunCal calculated the photo was taken at 11:47 on Sept, 28.
Prime Minister Tjitunga Elijah Ngurareposted on Facebook on Sept.29, stating, “All fires contained / mop-up and monitoring continues.” The Ministry says it will continue conducting aerial surveys by helicopter to assess the extent of the damage. NASA FIRMS continued to detect active fires in Etosha up until Oct. 5.
Bellingcat is a non-profit and the ability to carry out our work is dependent on the kind support of individual donors. If you would like to support our work, you can do so here. You can also subscribe to our Patreon channel here. Subscribe to our Newsletter and follow us on Bluesky here and Mastodon here.
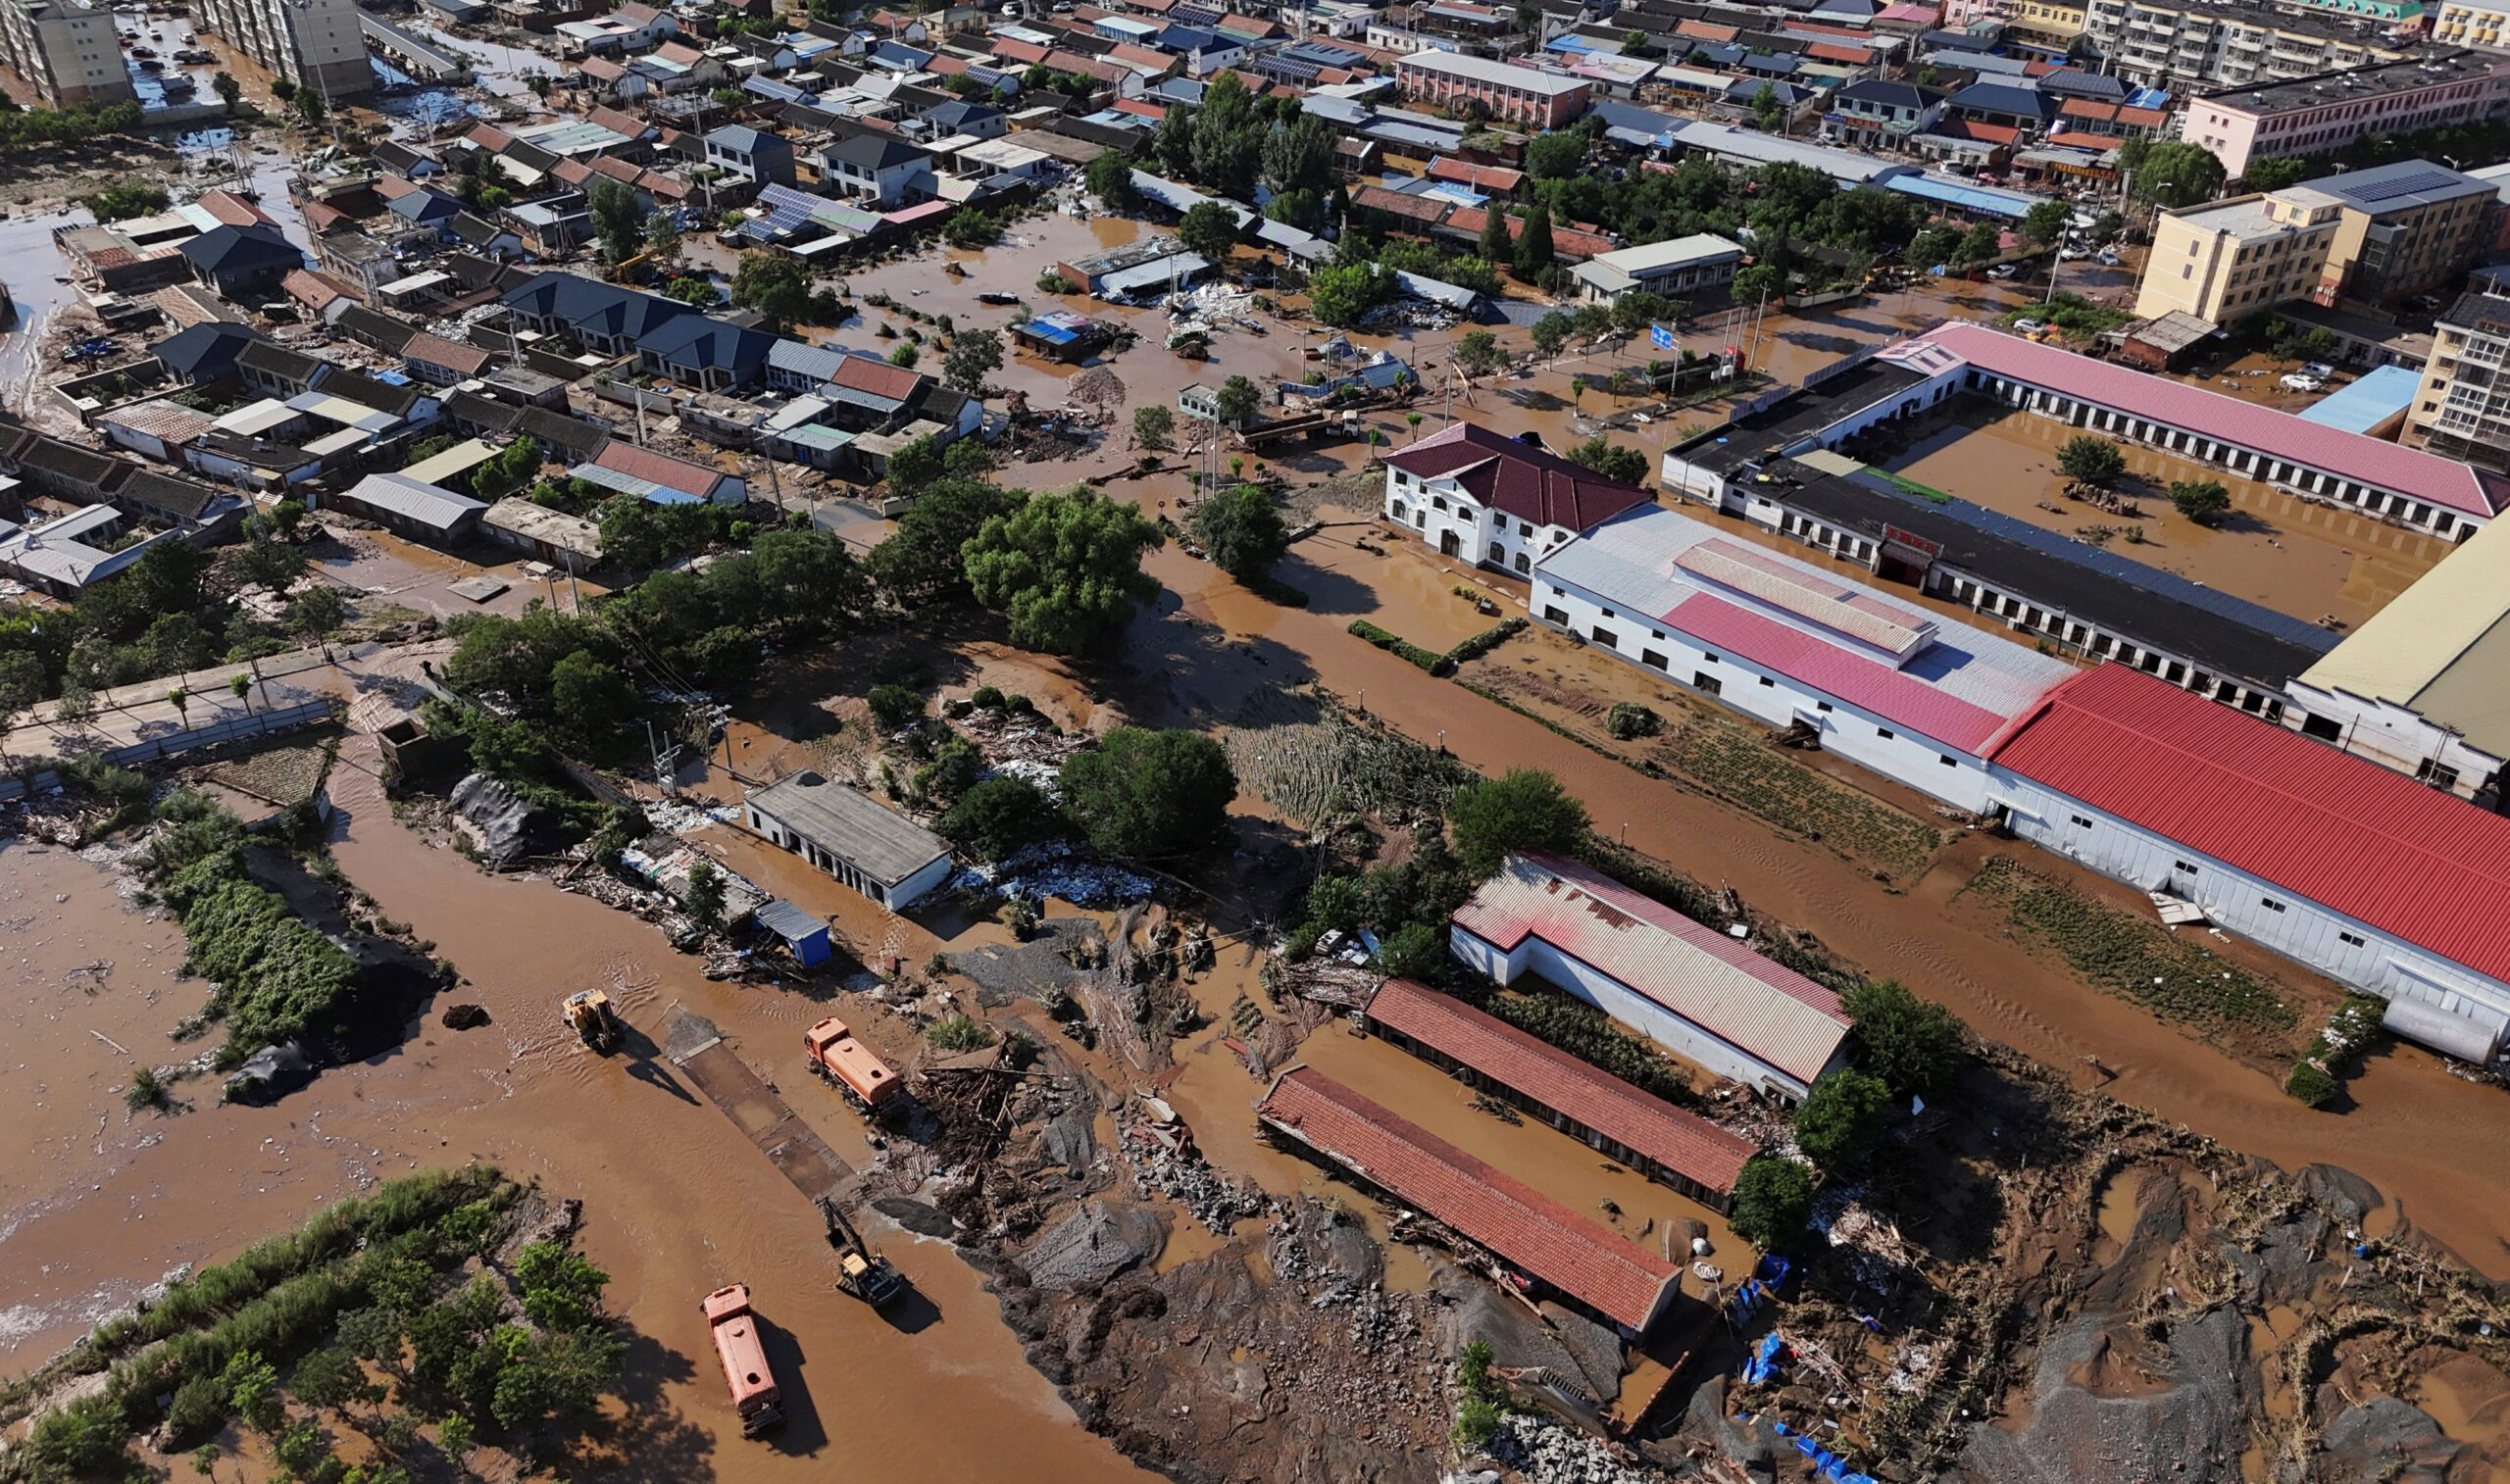
Earlier this week, the Beijing authorities placed all 16 of its districts on high alert in anticipation of torrential rain. More than 40 people have since been confirmed dead, and 80,000 evacuated citywide due to the floods.
But what can open source data tell us about the damage caused?
Satellite imagery has allowed us to track the impact on both urban and rural areas. On social media, however, a deluge of AI-generated fakes have continued to draw far more views than many genuine eyewitness videos.
“Gaps” in the city’s readiness
In northeast Beijing, near the largest reservoir in northern China, the highest death toll was recorded in the town of Taishitun. Thirty-one of the confirmed fatalities were from an elderly care home situated near the banks of the Qingshui River, which runs through the town.
Taishitun Village, Miyun District, Beijing. Compares 18/07/2025 to 30/07/2025. Credit: Planet.
Yu Weiguo, a Communist Party secretary for the Miyun District, which includes Taishitun, said at a press conference that there were “gaps” in the city’s readiness.
“Our knowledge of extreme weather was lacking. This tragic lesson has warned us that putting the people first, putting human life first, is more than a slogan,” Yu said.
A loss of food and farmland
Across Hebei Province, which neighbours Beijing, agricultural land was also heavily affected. In Jiuying Village, more than 1,300 hectares of farmland, much of it low-lying cornfields, was submerged, according to Reuters. Satellite data from the area north and east of Jiuying Village shows the scale of the flash floods.
Jiuying Village, Hebei Province. Compares 17/07/2025 to 30/07/2025. Credit: Planet.
Zooming out even further, Copernicus’ False Colour (Urban) band shows flooded areas in dark blue, highlighting the impact across Hebei Province.
Copernicus’ False Colour (Urban) band shows flooded farmland across Hebei Province in blue. Credit: Copernicus.
A deluge of AI on Youtube
Yet on other open platforms, such as social media and video sharing sites, the picture became complicated by accounts posting mis-and-disinformation.
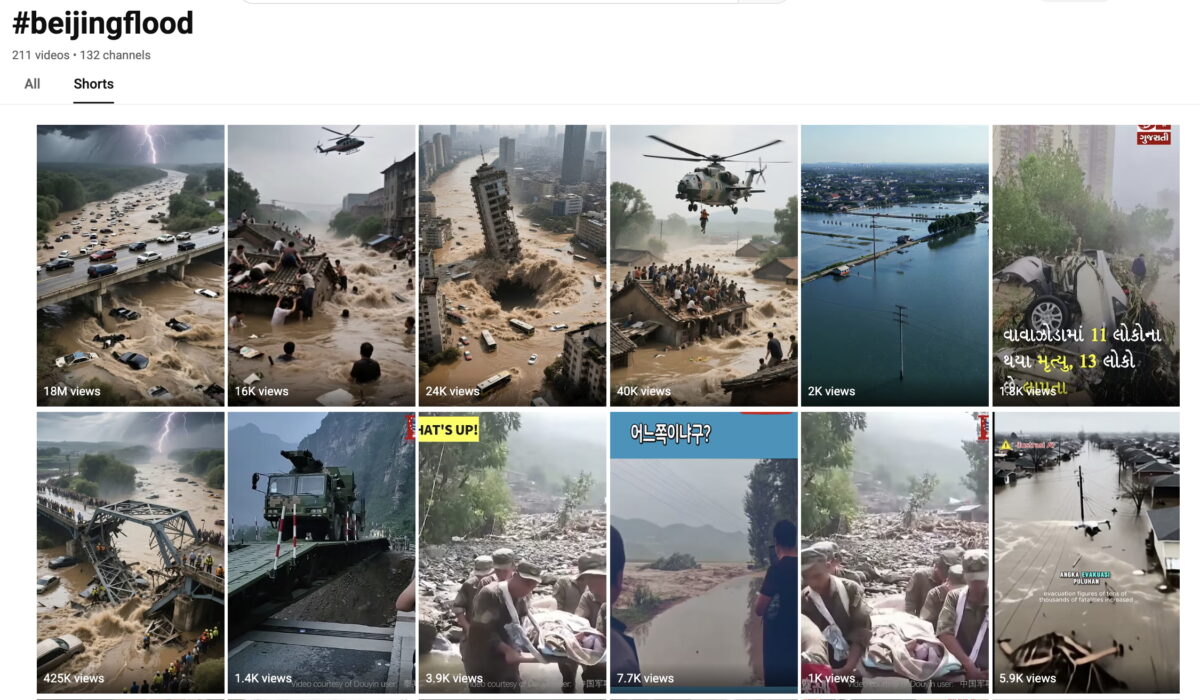
Searching in English, the results for #beijingflood on YouTube Shorts revealed multiple AI-generated thumbnails, one of which surpassed 18 million views. Meanwhile, shorts containing real footage struggled to climb past 1,000 views.
Top five results with the highest views for #beijingflood were all AI generated videos. Credit: YouTube.
All five of the top results carried the hallmarks of AI generated content: cars randomly appearing and disappearing, disproportionately sized objects, and overly dramatised scenes lasting only a few seconds.
On Facebook, when searching for “Beijing flood,” multiple AI-generated fake posts claimed actor Jackie Chan had died in the floods. Using AI-generated photos of Chan lying in a hospital bed or a casket, these posts collectively gathered more than 150,000 likes.
Credit: Facebook
By comparison, Chinese social media platforms, including Baidu’s Haokan Video, Weibo and Douyin appeared to display very few AI-generated videos. Instead, the vast majority appeared to be genuine posts documenting the real-world impact of the floods.
Montage of videos found on Haokan and geolocated by Bellingcat to several districts in Beijing.
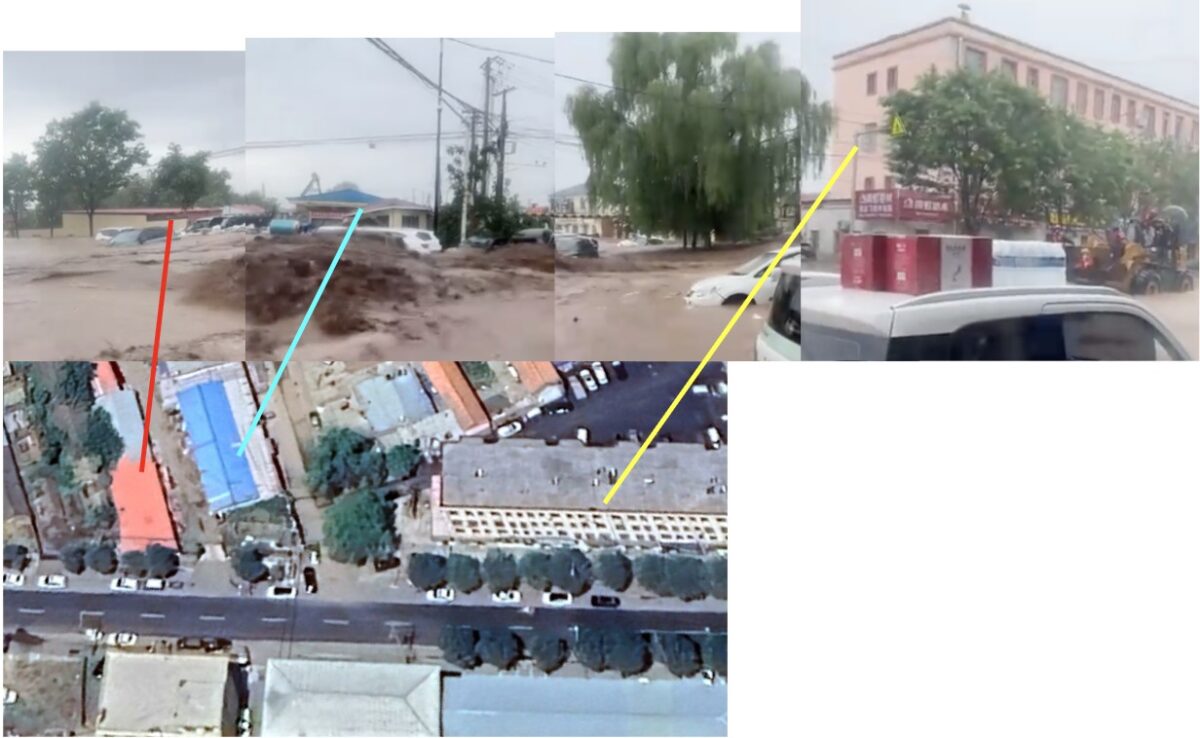
In an attempt to verify a sample of what we were seeing, Bellingcat geolocated several videos. Note that Google and Baidu use different coordinate systems. We identified any landmarks in Baidu Maps, before finalising our geolocations in Google Earth Pro.
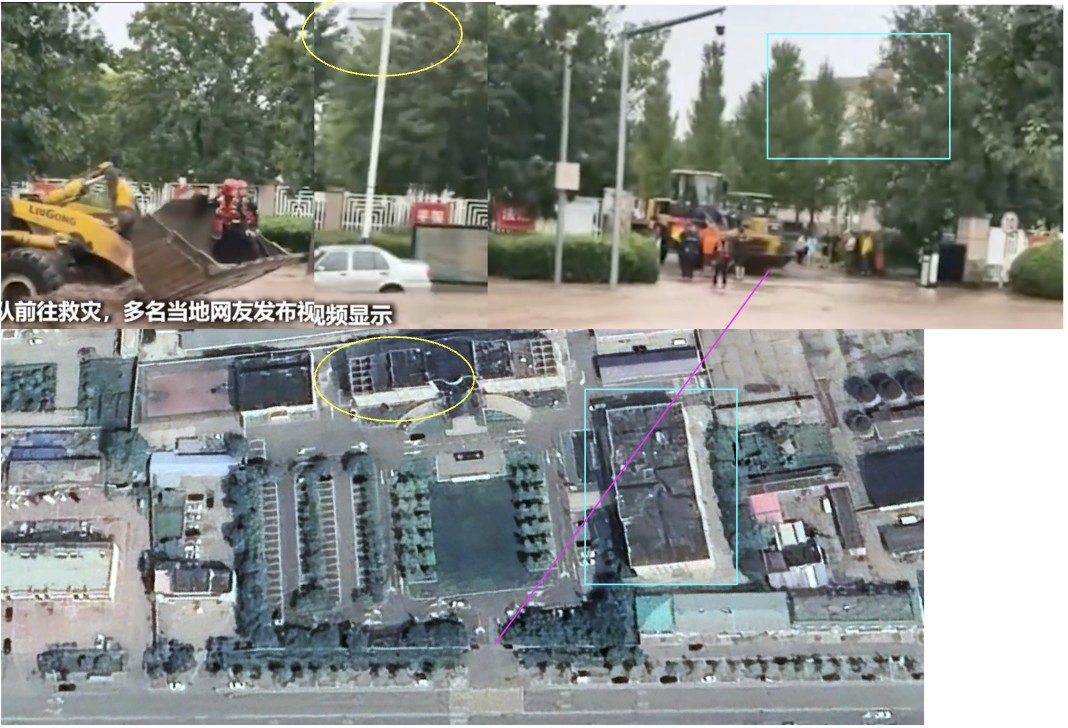
The two buildings in the background, along with the trees, bushes, fence and entrance, can all be matched to the government office in Taishitun. Credit: Bellingcat.
Later, in another clip from the same video, a bulldozer can be seen, again not far from the Taishitun government office.
The red roof, blue roof, and four-storey building, as well as the trees and streets, all matched the same location near to the Taishitun government office.Credit: Bellingcat.
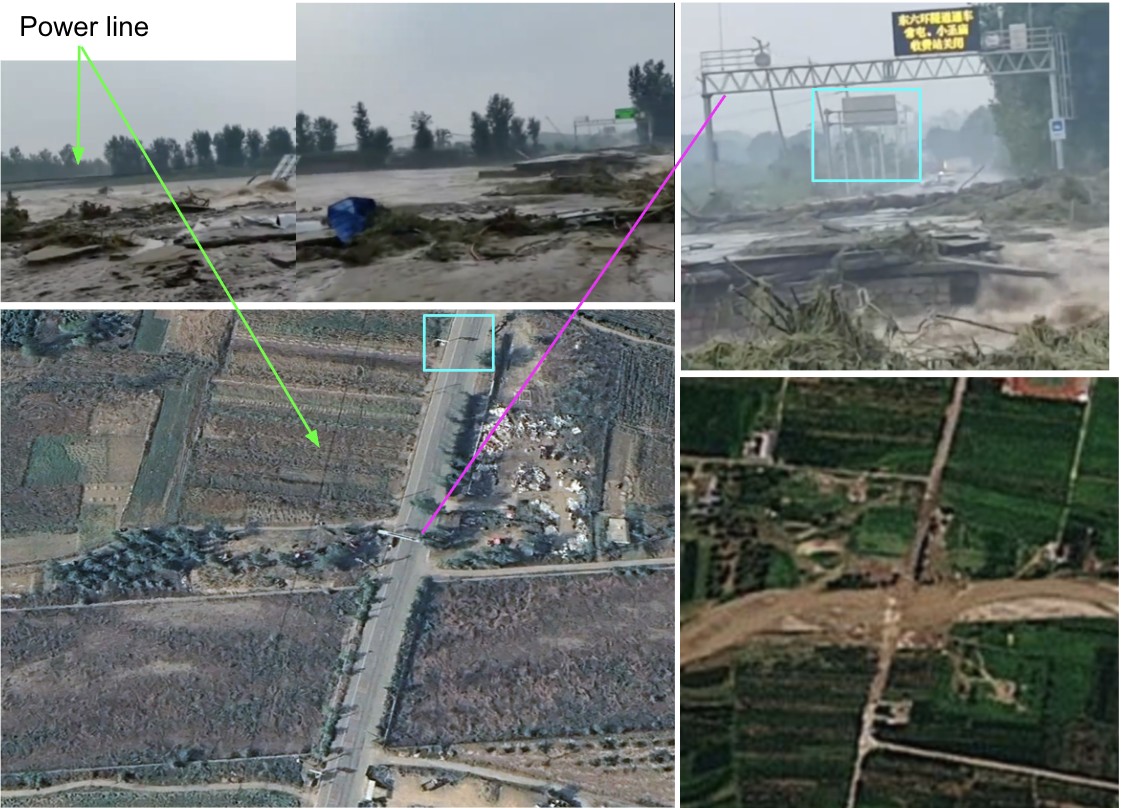
The power line, road sign, surrounding metal frame, billboard and trees all match details in the satellite image, bottom left. Bottom right, PlanetScope imagery from 30 July shows the river engulfing the bridge. Credit: Bellingcat.
Whilst searching Chinese social media platforms, some recycled footage from past floods could be seen. For example, on Douyin, the Chinese version of TikTok, one of the top results when searching for “Beijing flood” was a video from 2021 showing a mudslide in Japan where buildings and trees were engulfed.
Bellingcat reached out to the Beijing Municipal People’s Government for comment but did not receive a reply at the time of publication.
Driving food insecurity and competition for resources, climate change can also indirectly intensify conflict risks.
Analysing trends in both climate and conflict data is therefore not only critical for humanitarian response teams but also for journalists and researchers looking to understand the compounding impacts of weather-related hazards and violence on displaced communities.
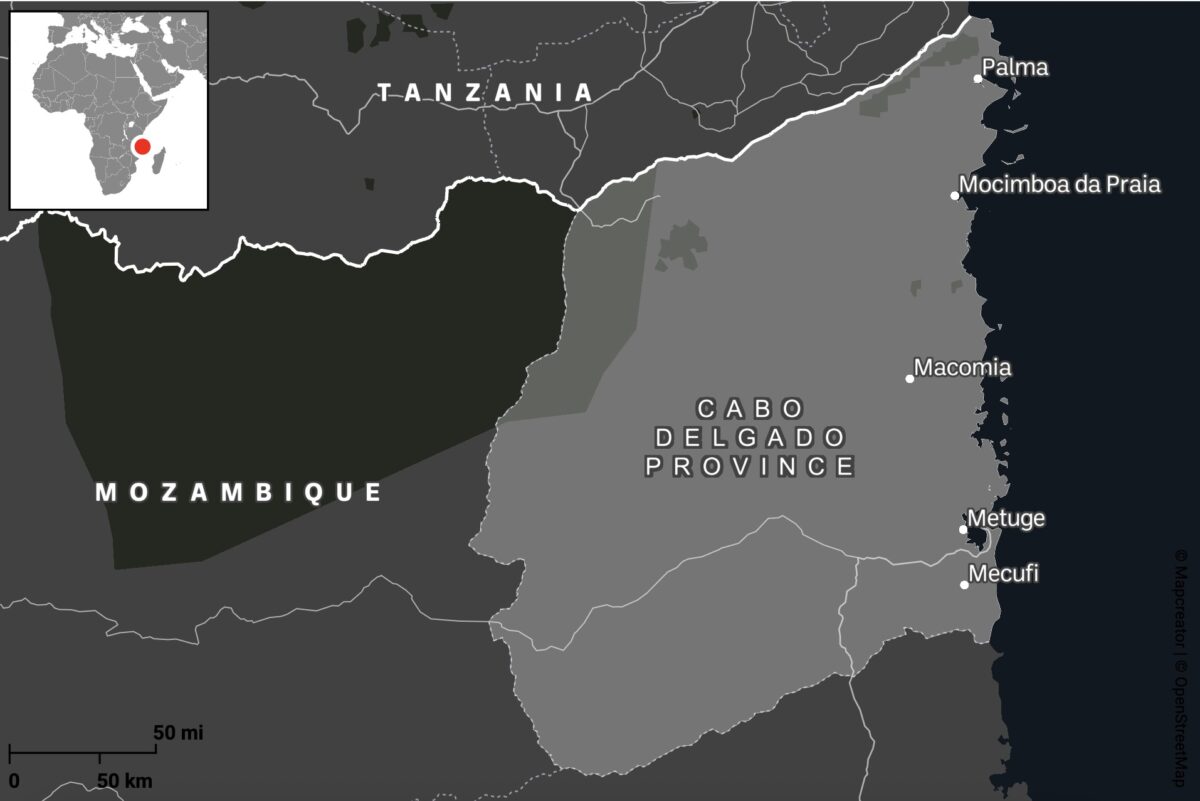
Cabo Delgado is a region besieged not only by cyclones but also by years of conflict. What began in 2017 as a series of localised attacks by Islamist militias has since escalated into an ongoing regional civil war between government forces and the Islamic State Central Africa Province (ISCAP). Close to a million people have been displaced, with extreme weather events including Cyclone Kenneth in 2019 and Cyclone Gombe in 2022 only adding to the unfolding humanitarian disaster.
Step 1: Sourcing Conflict Incident Data
Armed Conflict Location and Event Data (ACLED) provides real-time monitoring of global political violence and unrest by providing geo-referenced records of protests, riots, and violence targeting civilians.
Most of ACLED’s data originates from public sources, including local media reports and social media posts, making it heavily dependent on the presence or absence of local journalism. This reliance can create gaps in the data. However, on occasion, ACLED may also gather intelligence from local partners on the ground.
Each event entry includes key attributes such as dates, locations, involved actors, casualty figures and event descriptions. The data can be downloaded as CSV files with XY coordinates for spatial analysis. It is important to acknowledge that these coordinates often represent approximate locations, frequently defaulting to the nearest city centre rather than the precise location, which reduces spatial accuracy for detailed analysis.
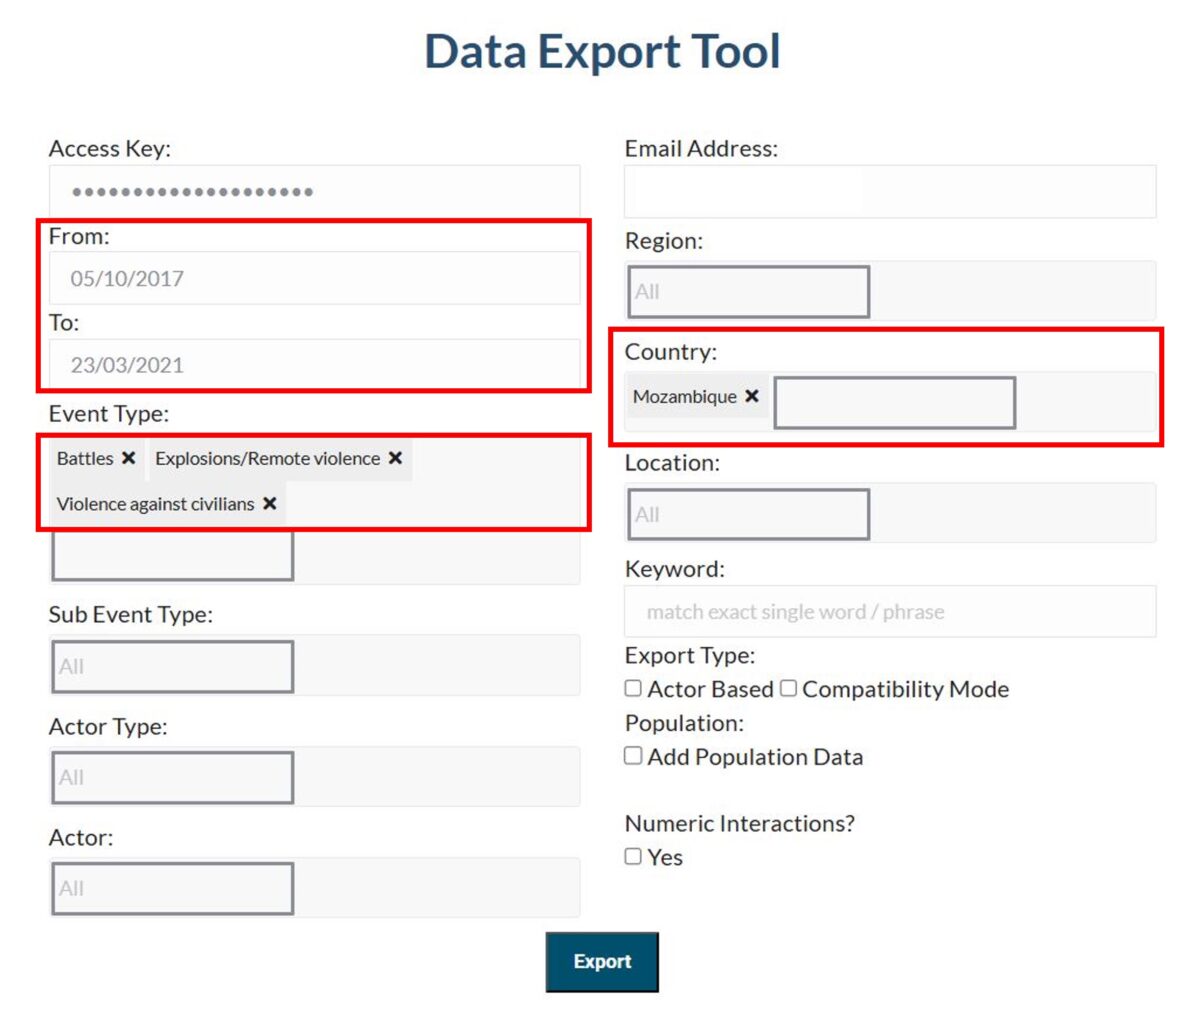
Navigate to the Data Export Tool. Enter your Access Key and email address, then select your country, event type and time period of interest
Given the complexity and longevity of the conflict in Cabo Delgado, with incidents dating back to 2017, we have chosen to split our data capture into three distinct time periods, described below. Each period will produce a separate CSV file, which, when uploaded to Google Earth Pro, will generate a separate data layer on the map.
Each time period reflects a shift in the level of violence and resulting displacement patterns of the community over time.
Period 1. Oct. 5, 2017 – March 23, 2021: Gradual Displacement The first attacks begin in the northern districts. A steady flow of Internally Displaced Persons (IDPs) arrives further south, in and around Metuge.
Support Bellingcat
Your donations directly contribute to our ability to publish groundbreaking investigations and uncover wrongdoing around the world.
Period 2. March 24, 2021 – Dec. 31, 2021: Peak Displacement A large-scale attack on the town of Palma in March 2021 results in the displacement of more than 100,000 people.
Period 3. Jan. 1, 2022 – To Date: Post-Peak Following the recapture of Palma and Mocimboa da Praia by Mozambican and allied forces, some IDPs begin to return to their homes.
To export the data navigate to the Data Export Tool and enter the information below, repeating this step for each time period:
Event Type: Battles, Explosions/Remote violence, Violence against civilians Country: Mozambique Date Range (From and To): 05/10/2017 – 23/03/2021 (Period 1: Gradual Displacement) 24/03/2021 – 31/12/2021 (Period 2: Peak Displacement) 01/01/2022 – To date (Period 3: Post-Peak)
Step 2: Mapping Conflict Data in Google Earth Pro
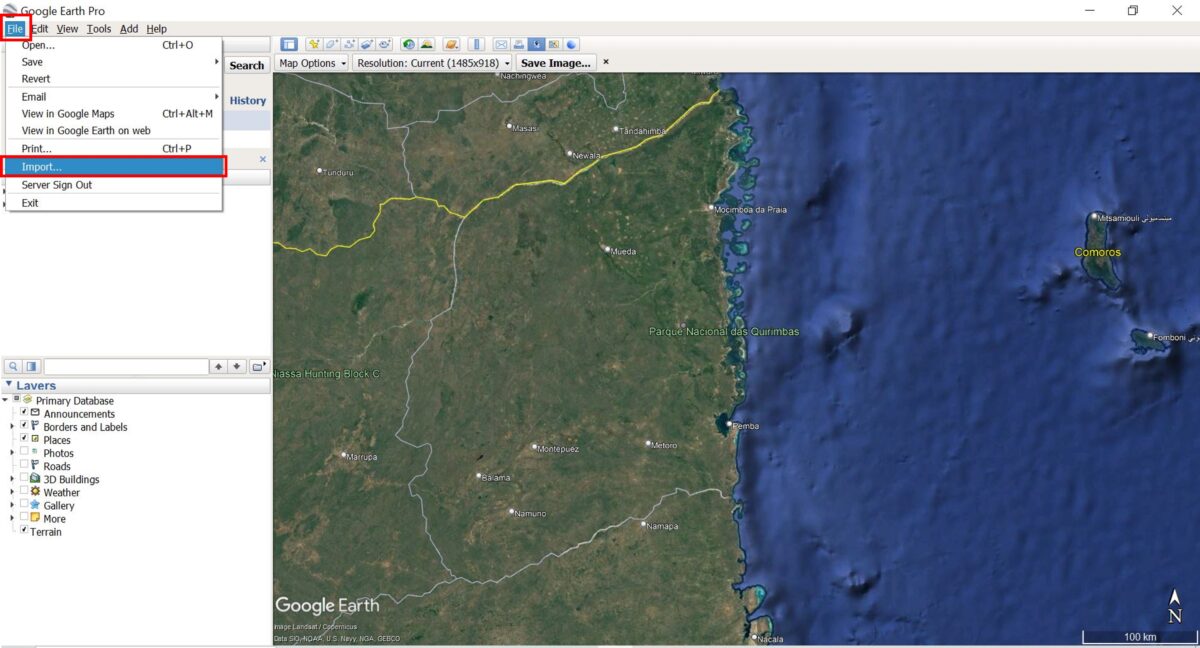
Launch Google Earth Pro on your desktop. In the top menu, click File → Import.
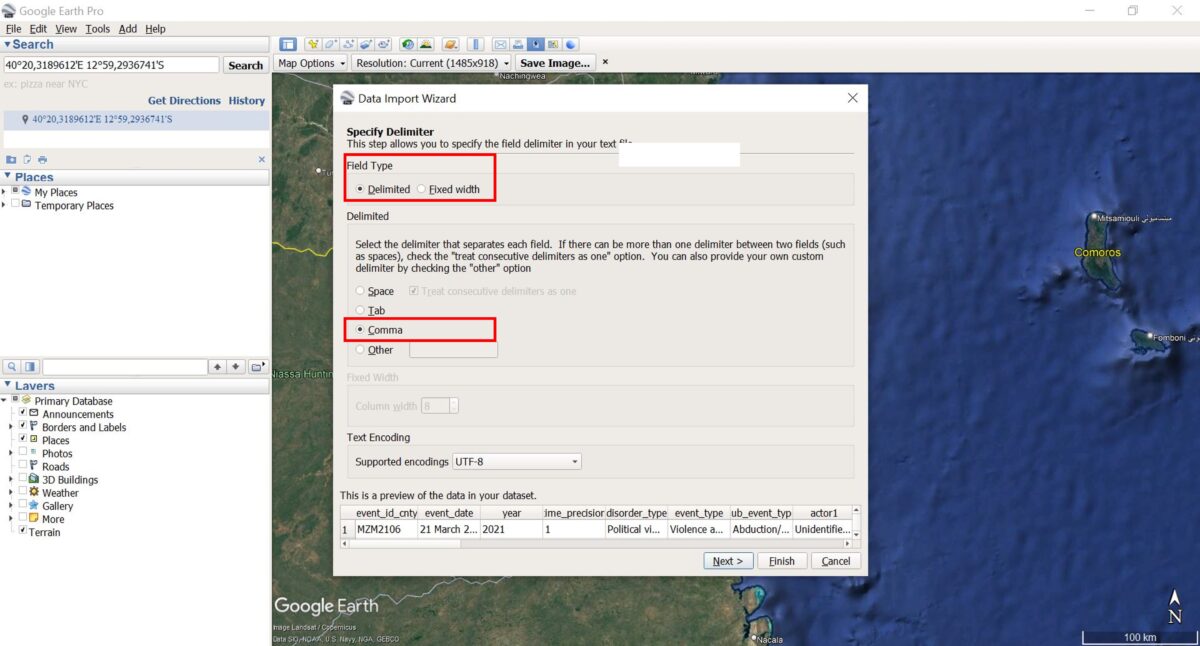
Navigate to one of the downloaded ACLED CSV files and select it. The pop-up window, Data Import Wizard, will appear.
Select Field Type: Delimited.
Choose Comma as the delimiter.
Click Next and leave the other settings as they are (ensure that the Latitude and Longitude fields are correctly selected). Click Finish to import the file.
Step 3: Save and Style the Data
A new layer will appear below Temporary Places and Google Earth Pro will automatically display the imported points in the map. If they don’t appear, make sure the box next to the layer is ticked.
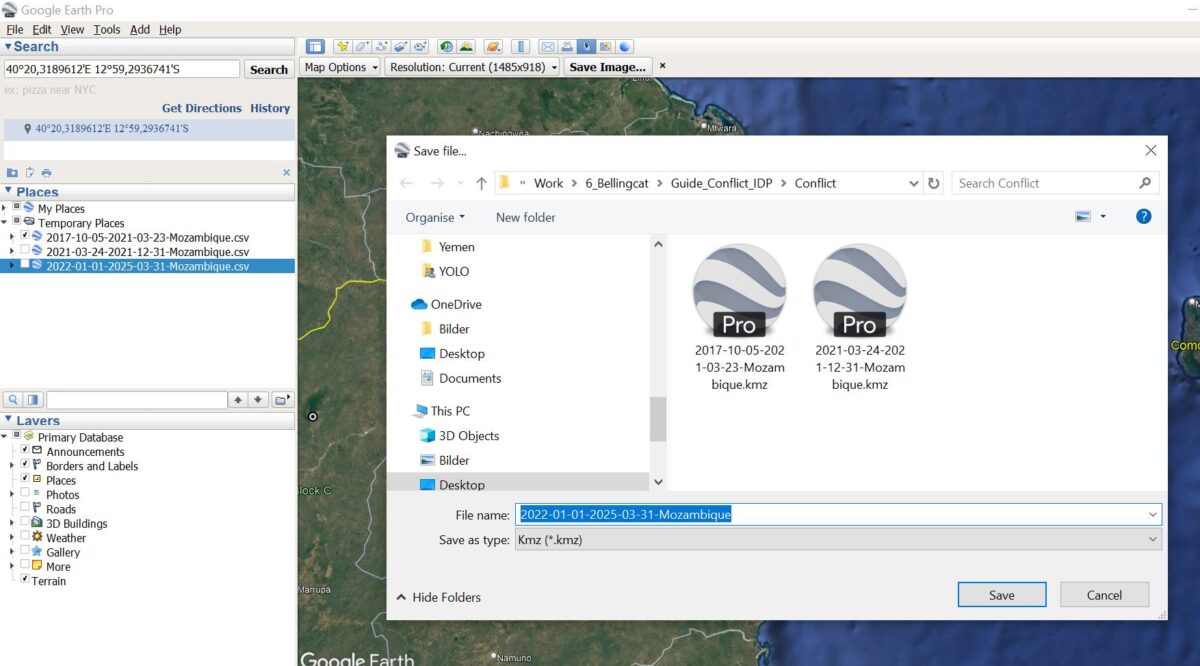
Right-click the dataset and choose Save Place As… to store it as a KML or KMZ file.
Repeat Steps 2 and 3 for all the ACLED CSV files you have downloaded.
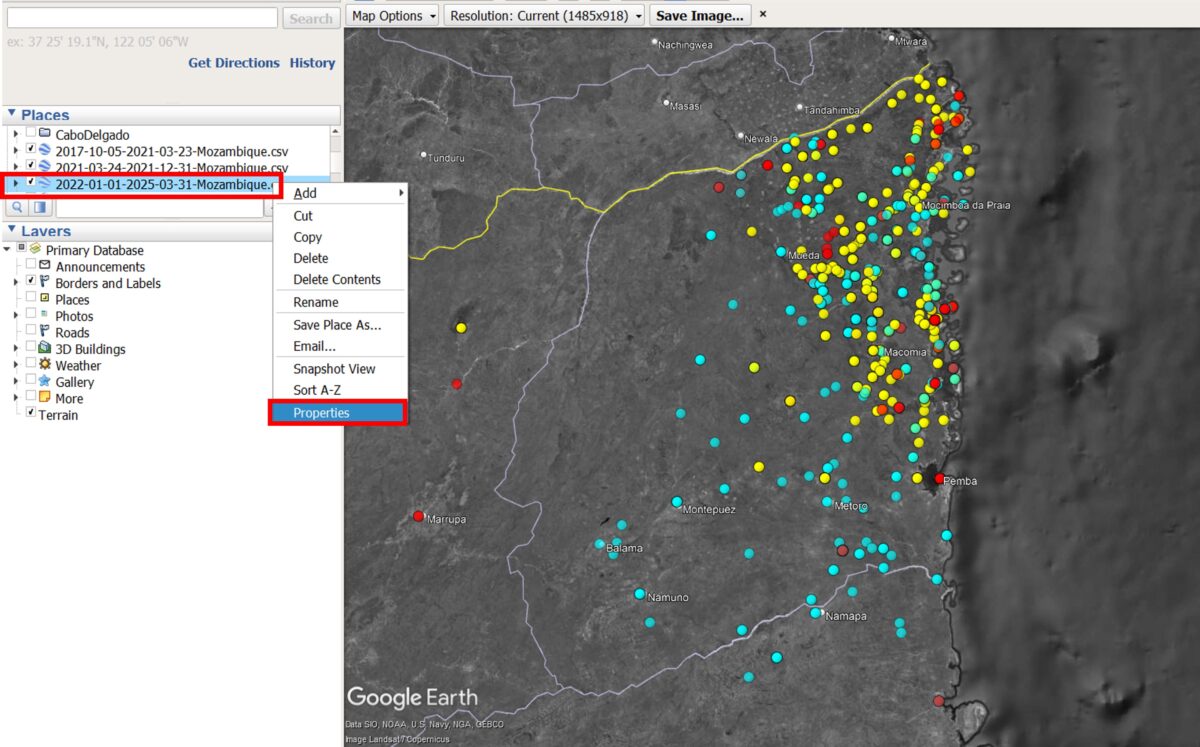
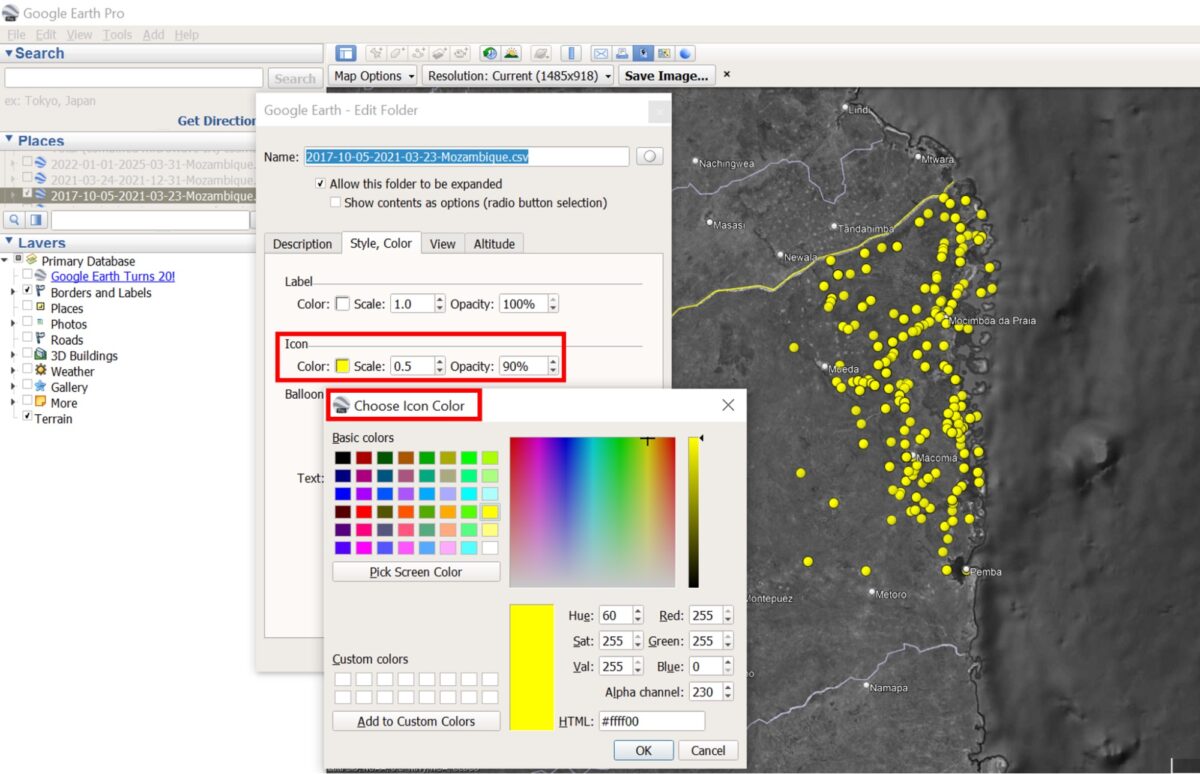
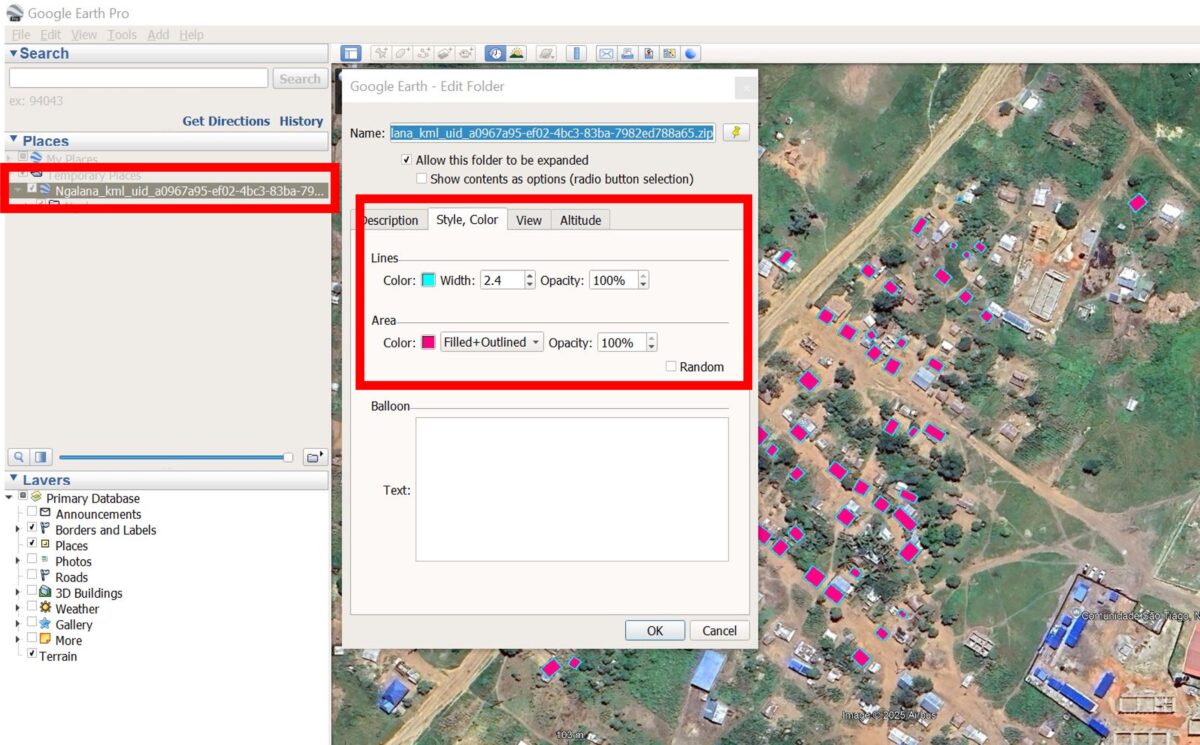
To change the icons or colours, right-click the layer file, Select Properties, then modify the Style/Color settings.
For each time period, we have selected a different icon colour: Period 1 = Yellow, Period 2 = Red, Period 3 = Blue. Source: Google Earth Pro 2025
For each time period, we have selected a different icon colour: Period 1 = Yellow, Period 2 = Red, Period 3 = Blue. Source: Google Earth Pro 2025
Step 4: Explore the Data
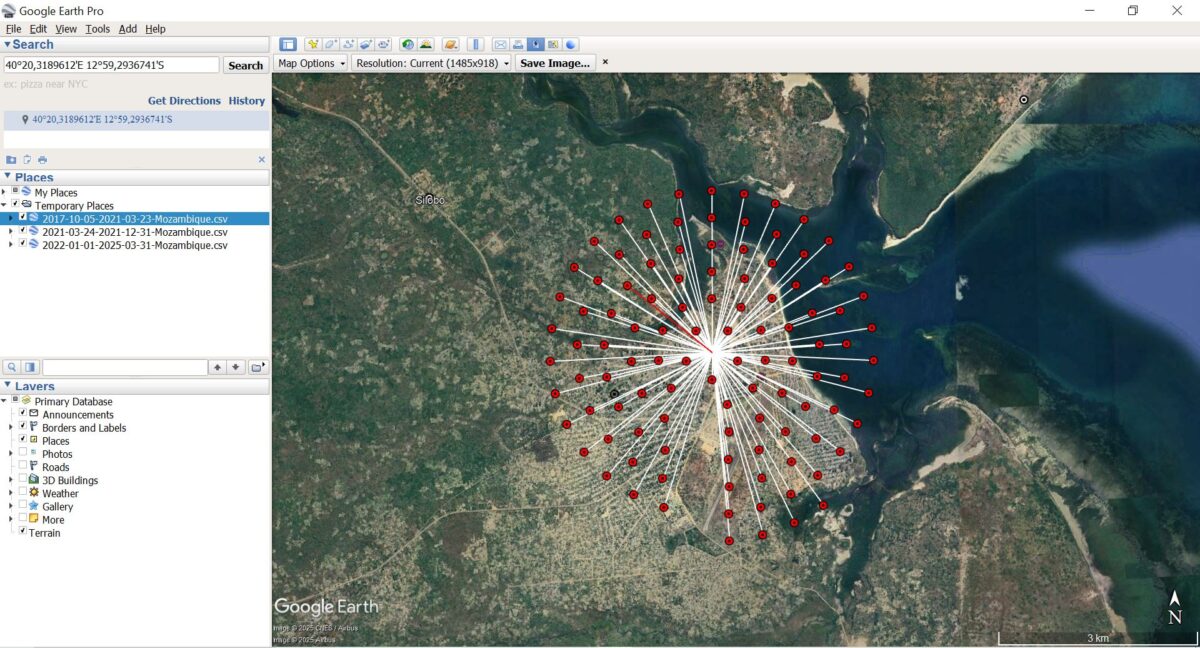
Click on any point to view details of the event, including the date, type, and location.
Be aware that ACLED may record multiple conflict incidents at the same location, so events can appear stacked on the map.
Toggle the time-period layers on and off to analyse spatio-temporal changes in conflict patterns.
GIF showing the conflict data across three distinct time periods. Each period is represented by a different icon colour: Period 1 = Yellow, Period 2 = Red, Period 3 = Blue. Source: GoogleEarthPro 2025 & ACLED 2025
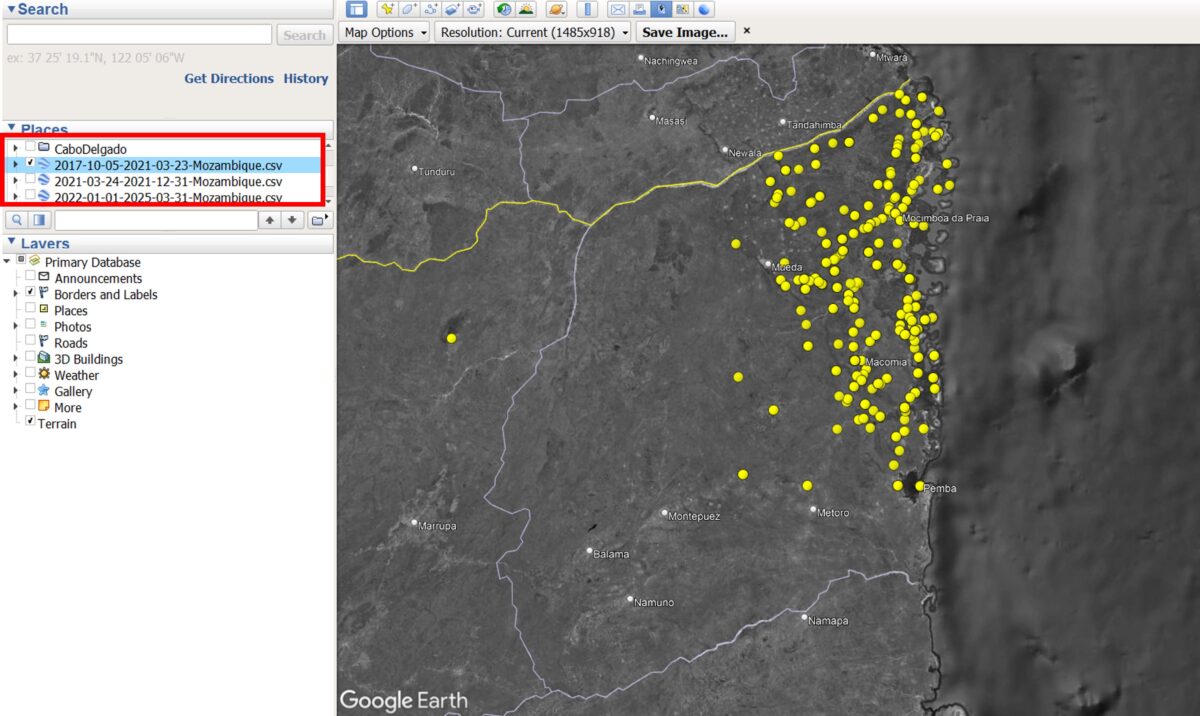
The visualisation reveals that during the first time period, Gradual Displacement(yellow), the violence was mostly concentrated in north-eastern Cabo Delgado, in and around Macomia, Mocimboa da Praia and Palma. In the second time period,Peak Displacement(red), incidents remained high in the north-east, leading to a large influx of IDPs into the Metuge region. By the third time period, Post-Peak (blue) the conflict had spread further south and west, increasing the risk of repeated displacements for populations already uprooted.
Zooming in on Displacement
To better understand localised displacement patterns, we can begin identifying specific IDP settlements of interest using high-resolution satellite imagery.
The EMS’ mission, to deliver near-real-time maps and geospatial data during or immediately after a critical event, aims to help responders on the ground make informed decisions quickly. Recent activations have included the wildfires in Portugal, floods in Germany, or post-landslide in Ethiopia. You can access their full database here.
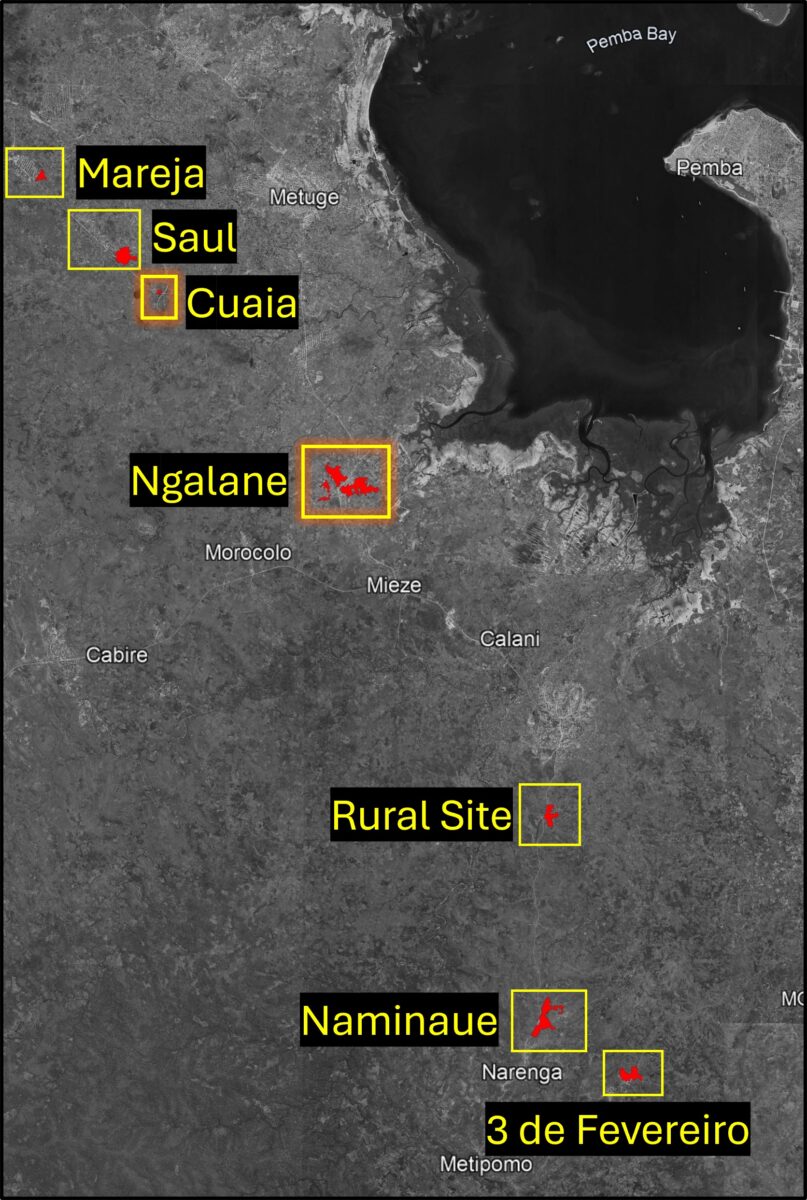
The EMS was activated over Cabo Delgado in response to the displacement of thousands of civilians after militants attacked and killed dozens in the coastal town of Palma. The map below shows seven of the IDP sites captured by the EMS in 2021 in the districts Metuge and Mecufi.
The seven settlements include: Mareja (12°58’01.0″S 40°18’56.0″E), Saul (40°20’14″E 12°59’13″S), Cuaia (40°21’E 12°59’50″S), Ngalane (40°23’50″E 13°2’46″S), Rural Site (40°26’58″E 13°10’55″S), Naminaue (40°26’59″E 13°10’58″S), 3 de Fevereiro (40°28’23″E 13°11’49″S). Source: EMS. Annotated by Bellingcat
Based on the EMS data, we will focus on two out of the seven settlements: Cuaia (40°21’E 12°59’50″S) and Ngalane (40°23’50″E 13°2’46″S).
Copernicus EMS provides a detailed guide on what to look out for when analysing a potential IDP settlement, including housing types, tents, and other structures. Follow this link to download the PDF titled Technical Report.
Cuaia – A Temporary Settlement
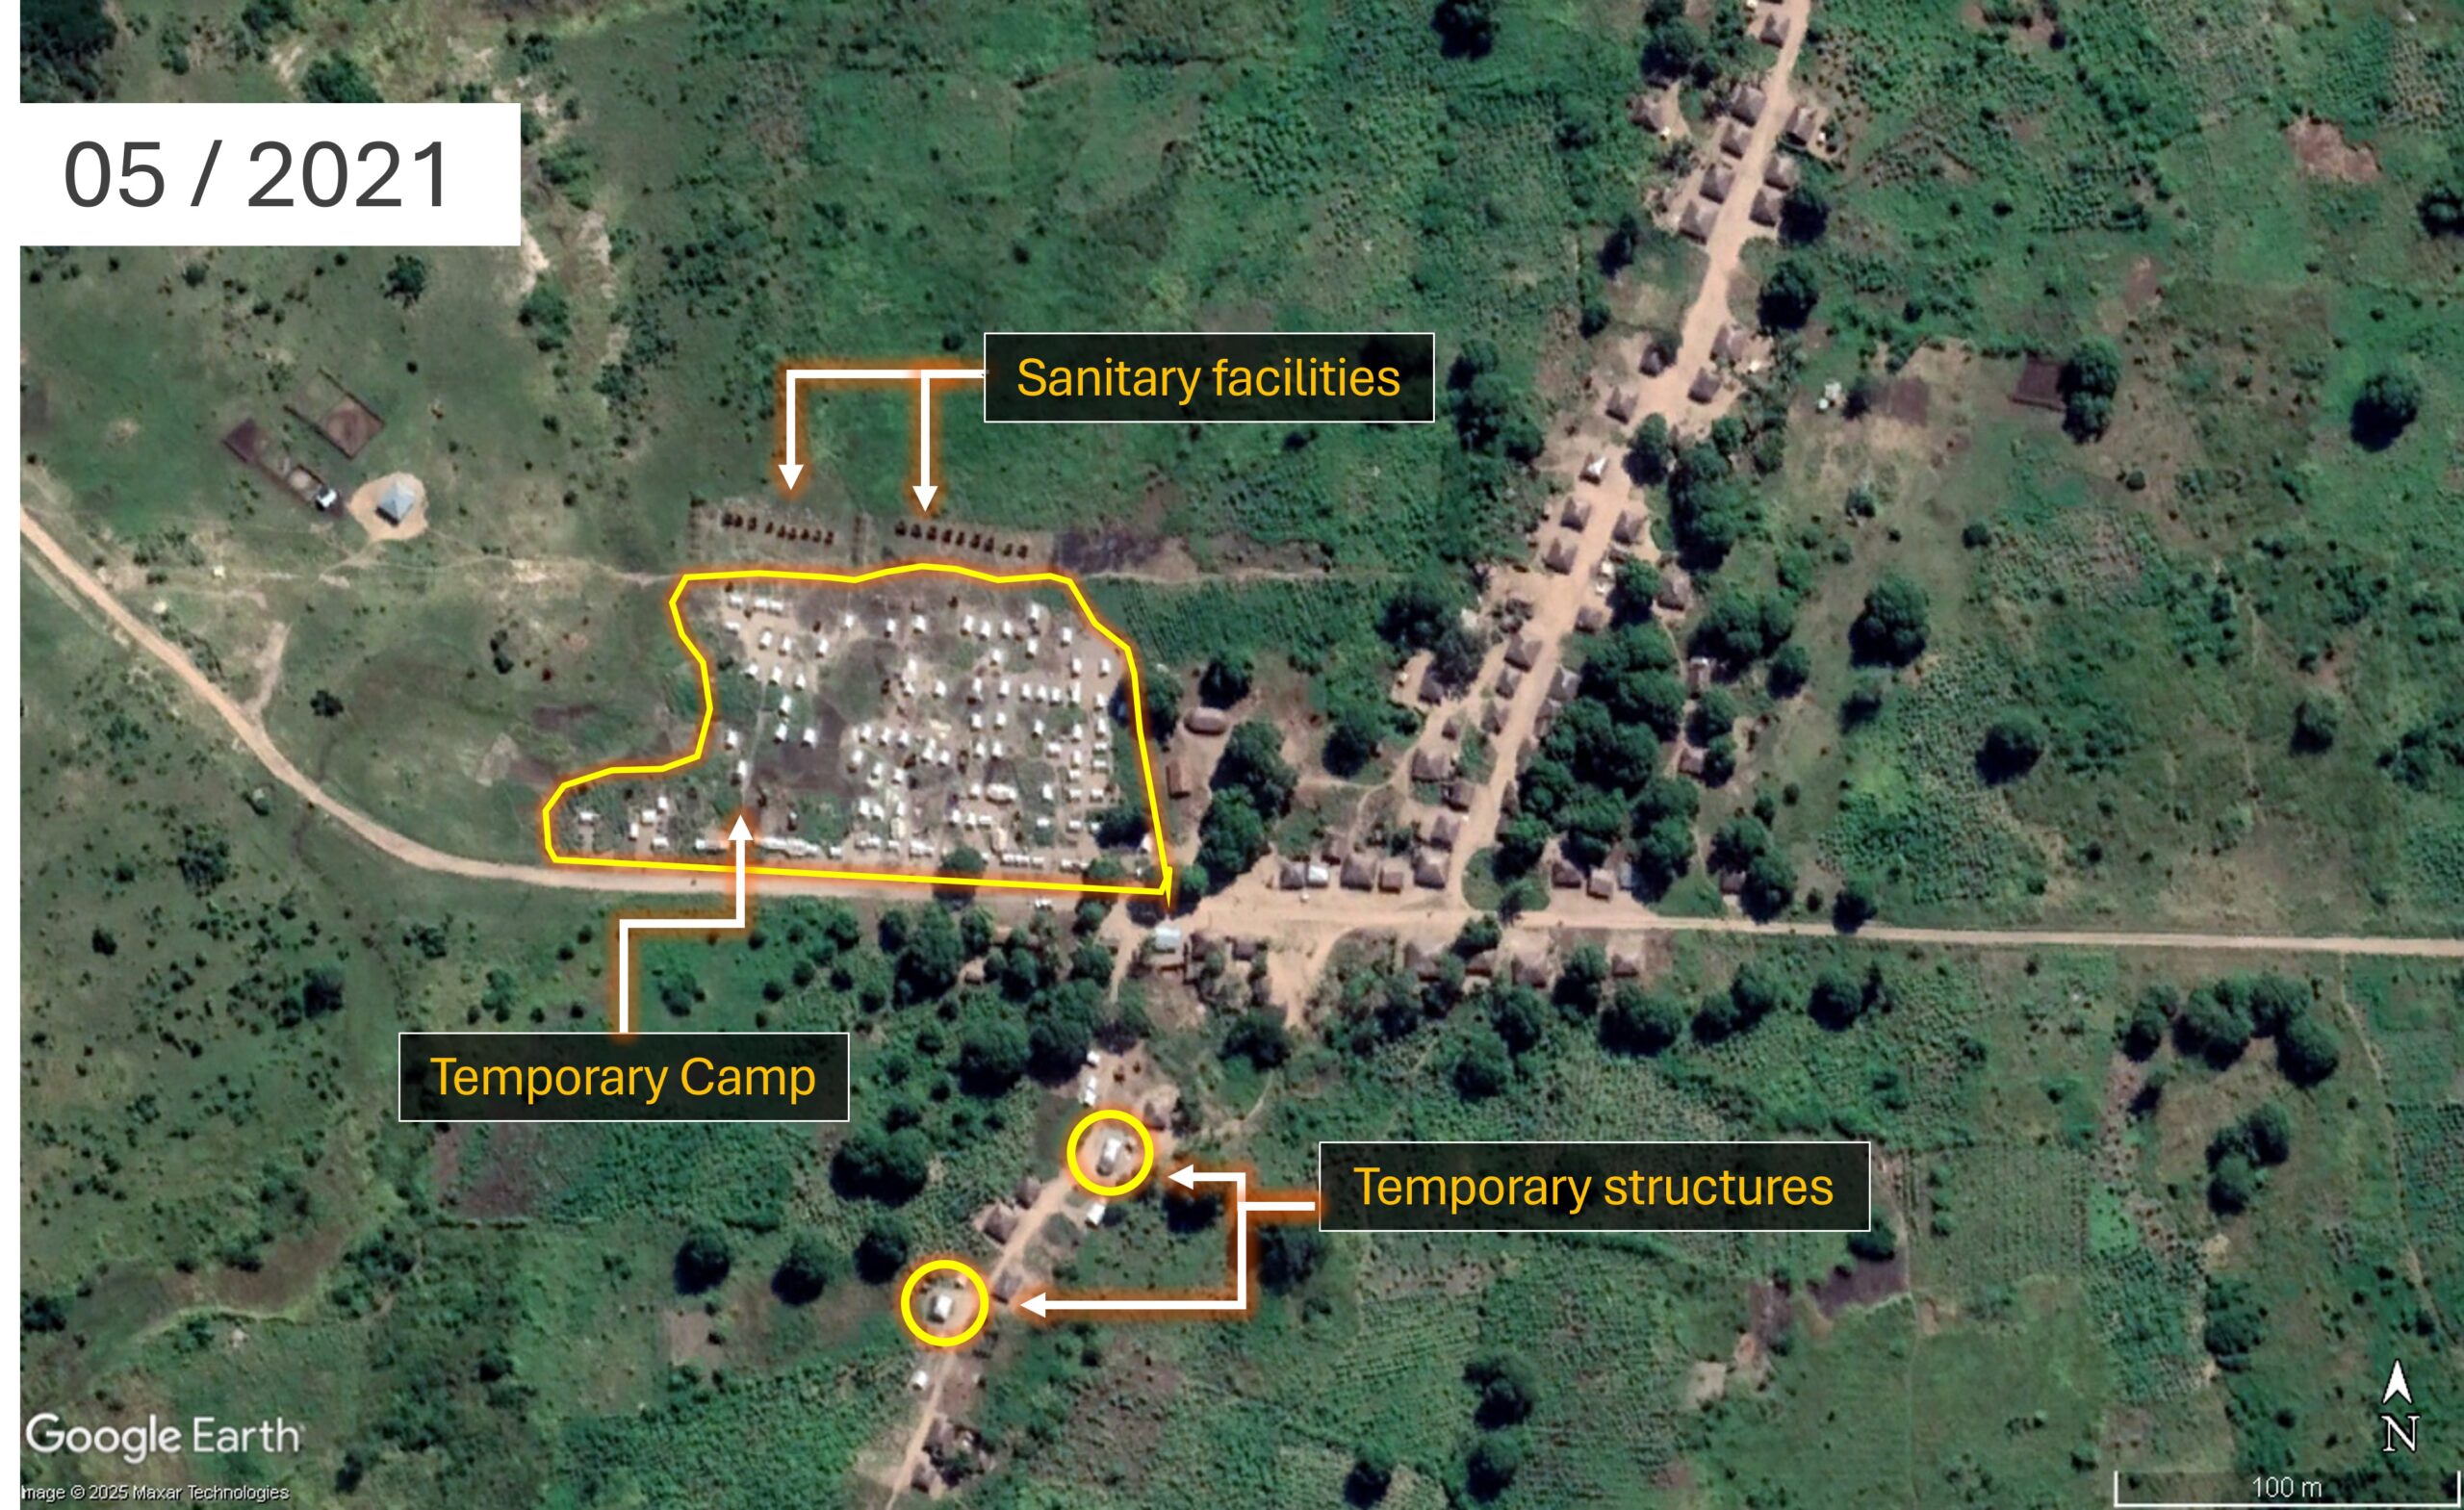
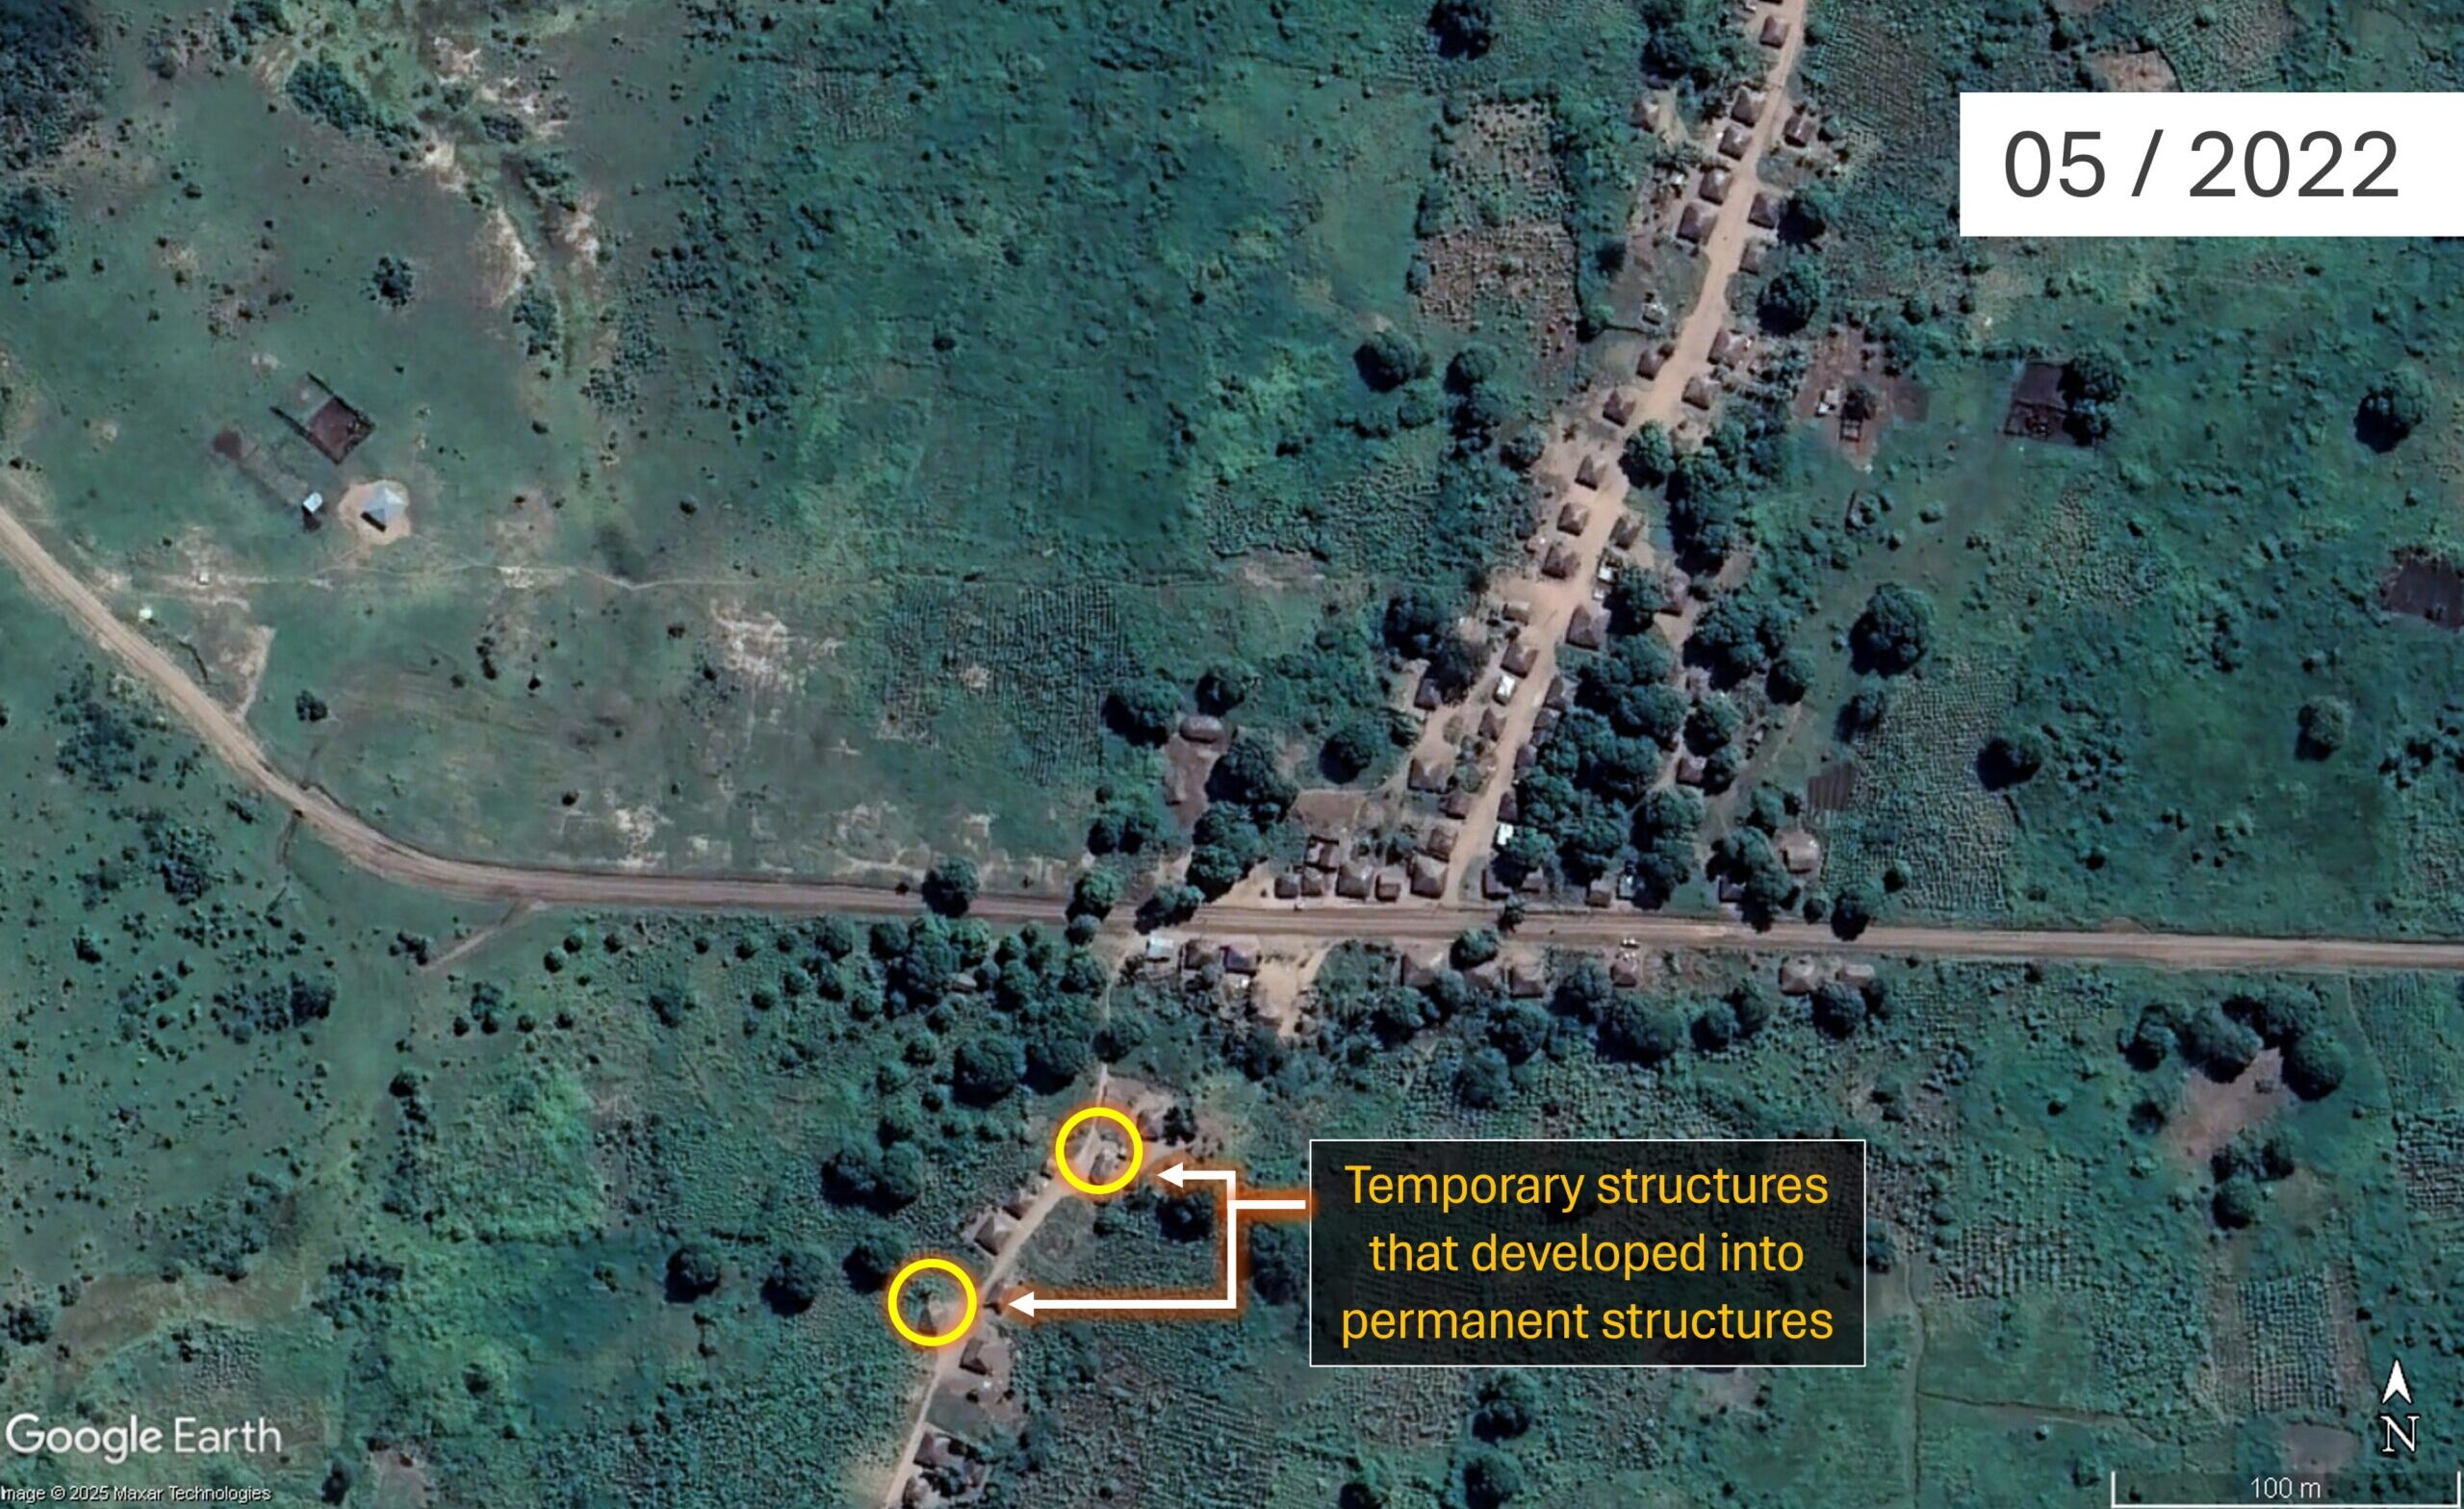
As seen in the satellite imagery below, an organised camp including tents and sanitation facilities to the west of the small village of Cuaia was visible in May 2021. However, by May 2022, all the tents had disappeared, indicating that this was a temporary site which did not develop into a permanent IDP settlement.
Imagery of Cuaia (40°21’E 12°59’50″S) in May 2021 and May 2022. Source: GoogleEarthPro 2025
The tents’ light-coloured roofs and their uniform size and shape indicate that this settlement was temporary. Their neat arrangement in closely spaced rows suggests the camp was established by a humanitarian organisation. Just north of the tents, two rows of small dark structures are also visible, most likely sanitary facilities. Their alignment to the camp further supports the interpretation that this is a planned, non-permanent installation, distinct from the adjacent village to the east. In the southern part of the image, two buildings have appeared. A change in the colour and material of their roofs can be observed between 2021 and 2022, suggesting a shift from a temporary to more durable construction.
Ngalane – A Permanent Settlement
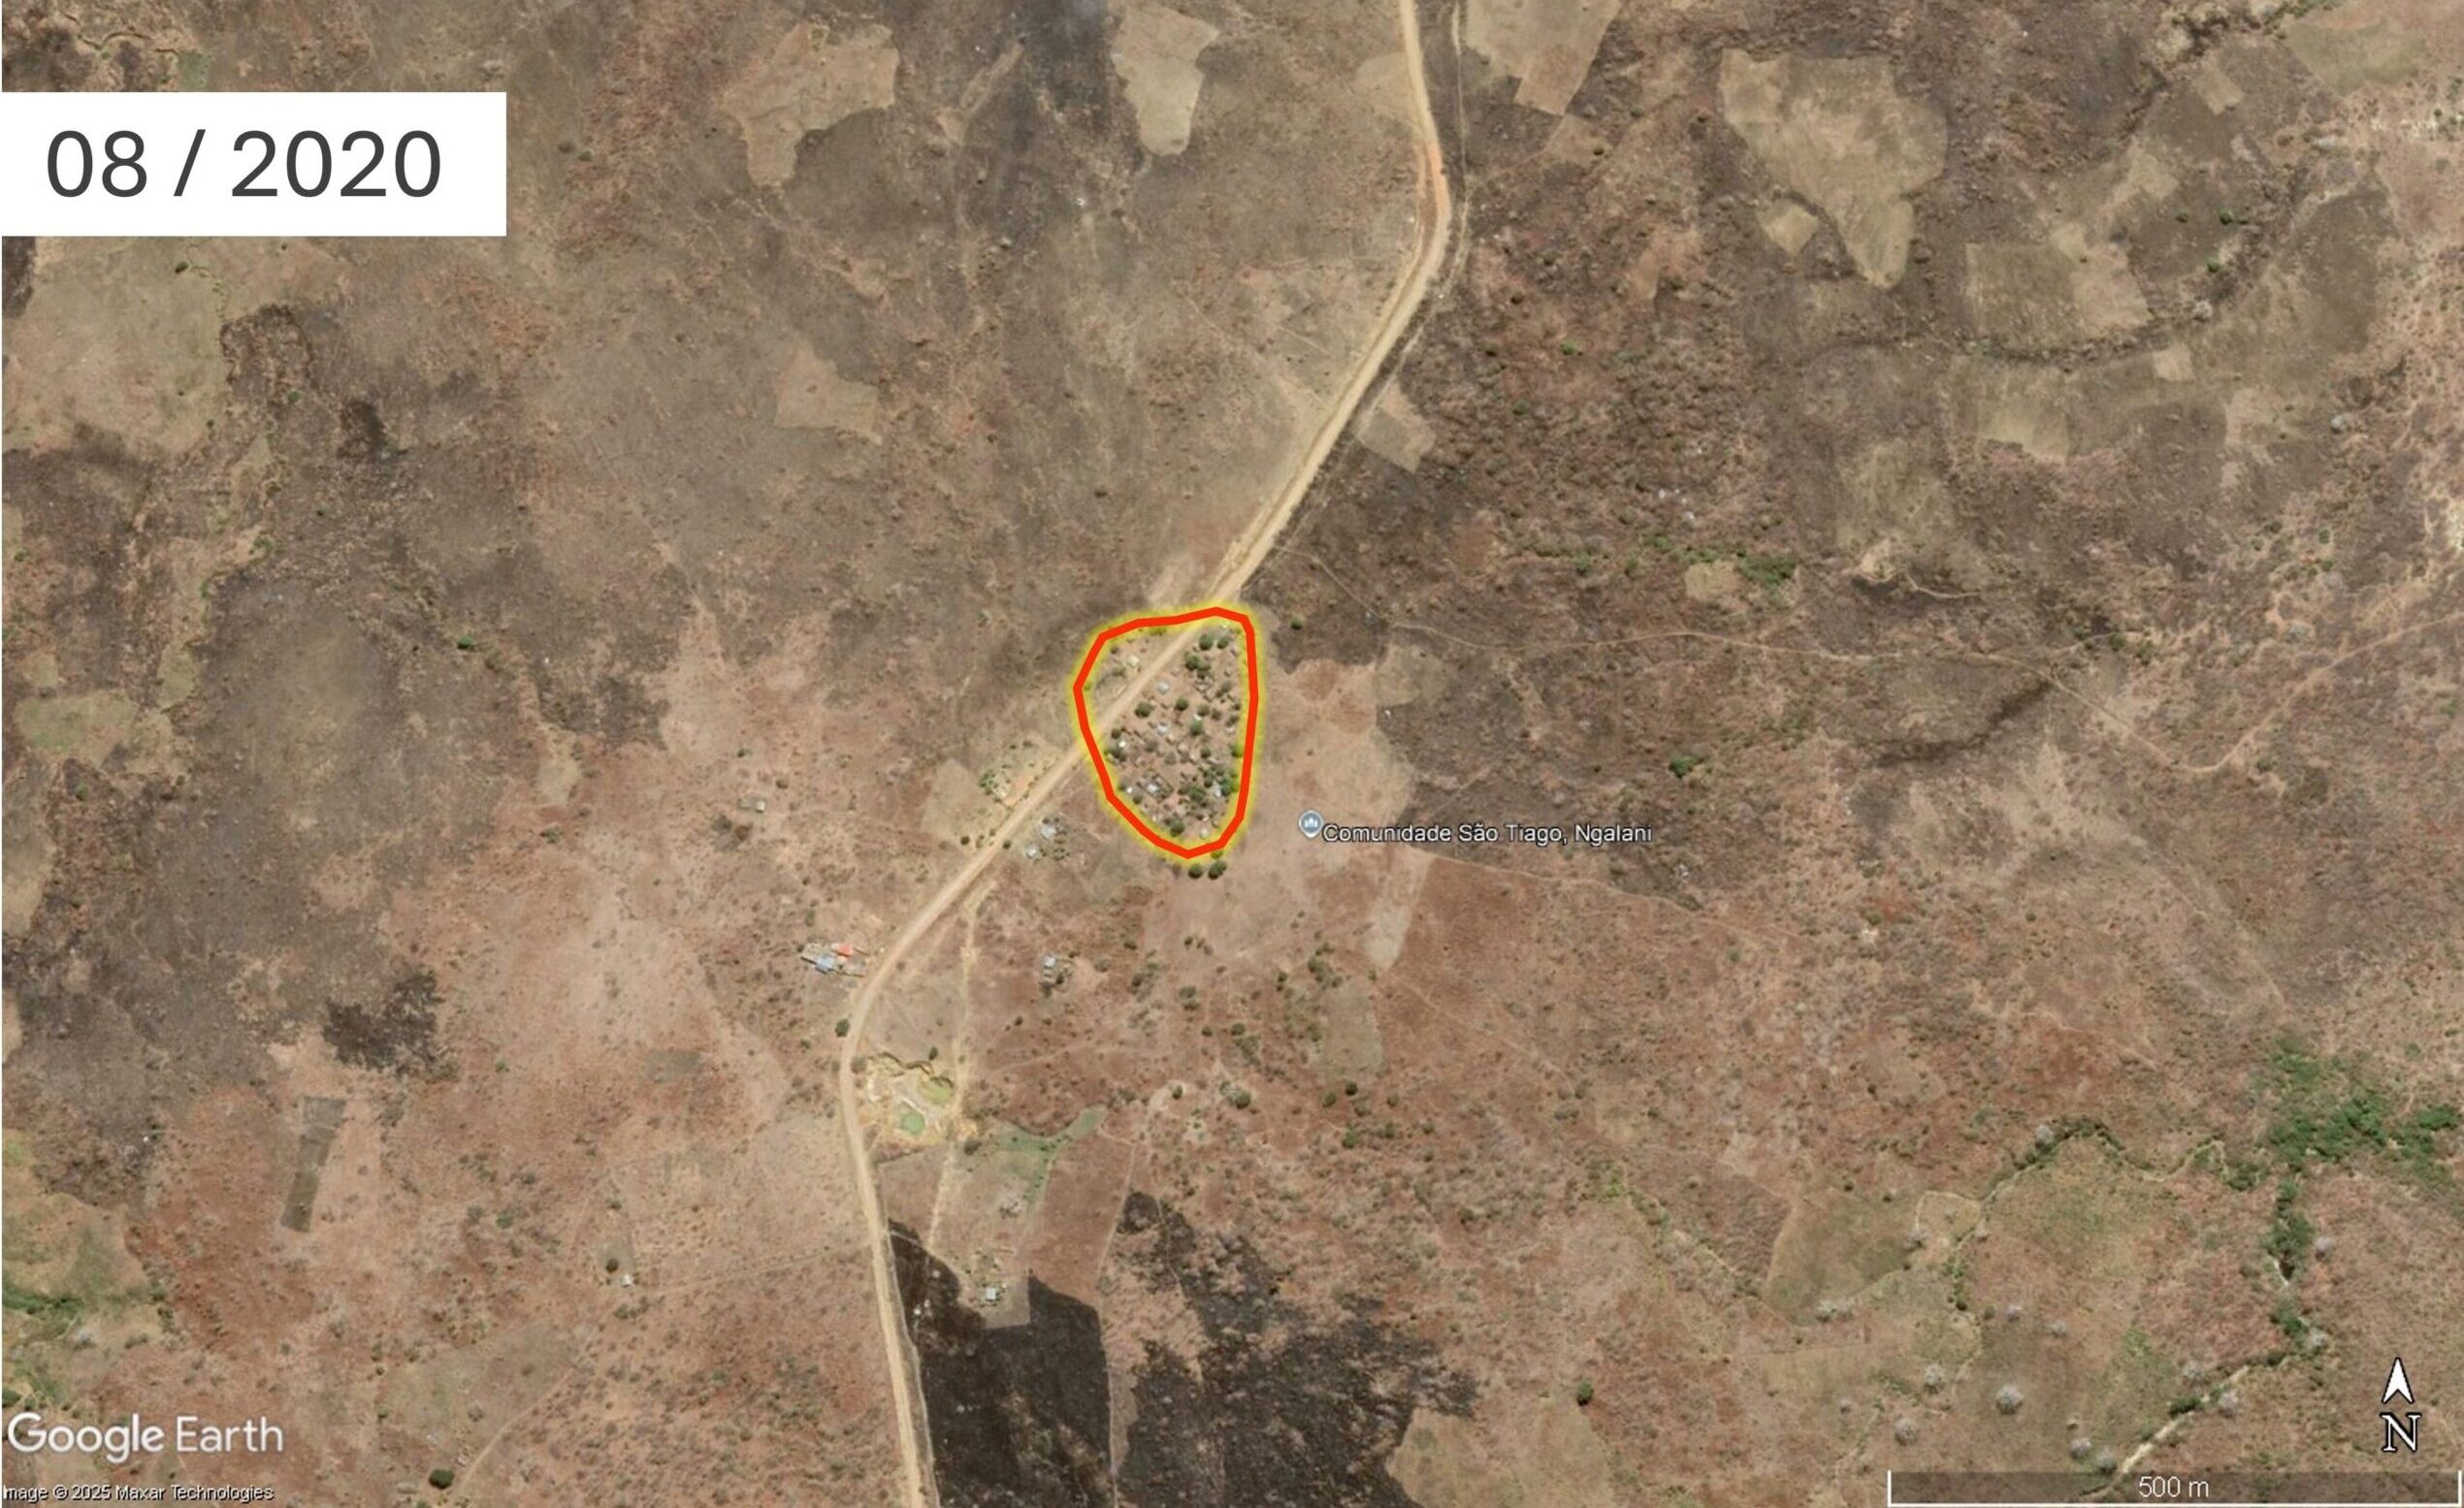
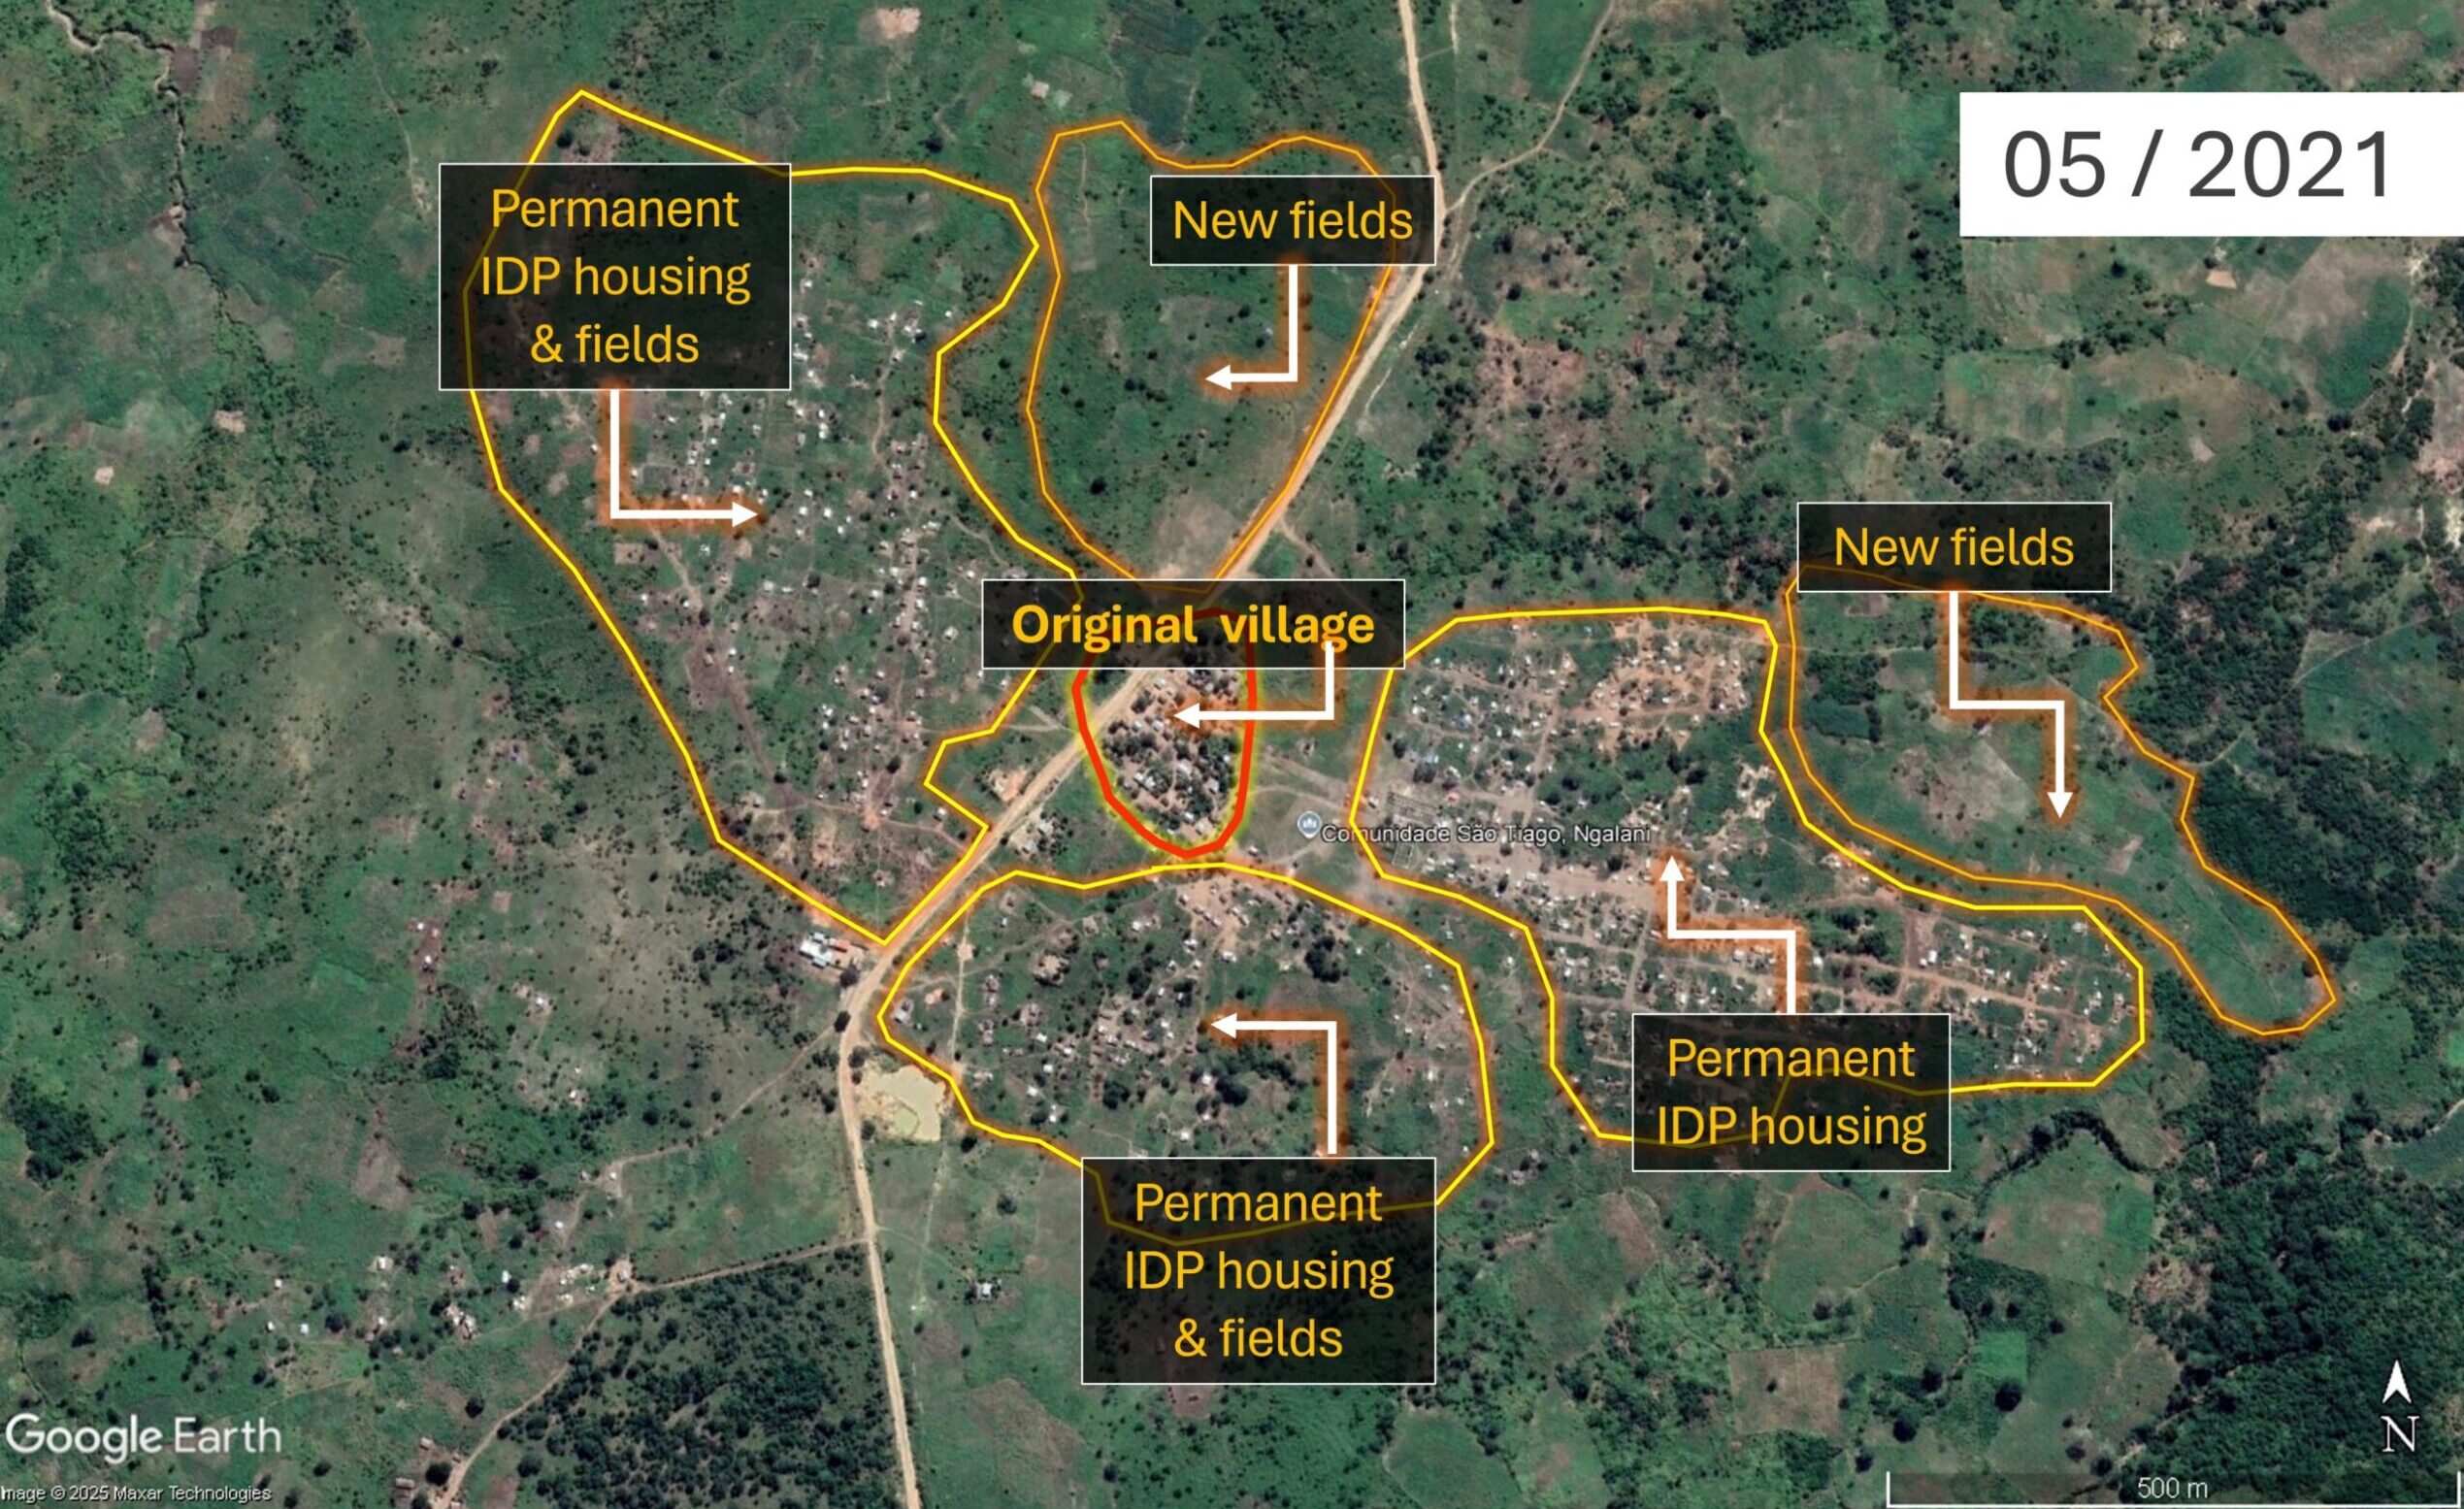
Located south of the city of Metuge, Ngalane’s expansion is clearly visible in satellite imagery – from a small community in 2020 to a larger, more established site by 2021. The visible increase in housing and agricultural fields suggests that Ngalane has transitioned from a temporary site into a permanent IDP settlement.
Imagery of Ngalane (40°23’50″E 13°2’46″S ) in August 2020 and May 2021
Rather than the organised, grid-like layout seen at temporary sites such as Cuaia above, the organic arrangement of dwellings in Ngalane, along with informal footpaths, small roads, and newly established small fields and cultivated plots, all indicate a level of permanence. While some buildings still have light-coloured roofs, indicating tent fabric, the overall spatial organisation of the settlement, combined with the presence of cultivated land, provides stronger evidence of a shift from short-term displacement to long-term settlement, reflecting efforts to rebuild livelihoods.
Analysing the Settlements’ Digital Footprints
Now that we’ve identified our two locations of interest, we can further analyse the settlements’ structures and their populations’ exposure to climate-related hazards, using building footprint data from OpenStreetMap (OSM). OSM is a collaborative project that provides free, crowdsourced geographic data, including information on roads, buildings, and other infrastructure.
A settlement’s footprint data is based on the number, size, and shape of individual buildings, and can be used to estimate how many people live in a given area. Such data can be leveraged for exposure mapping, helping to identify a location, its density, and the resilience of its structures in relation to climate-related hazards such as floods, droughts, or cyclones.
Ngalane – an Incomplete Footprint
To see the current OSM building footprint of Ngalane, you’ll first need to create a free account.
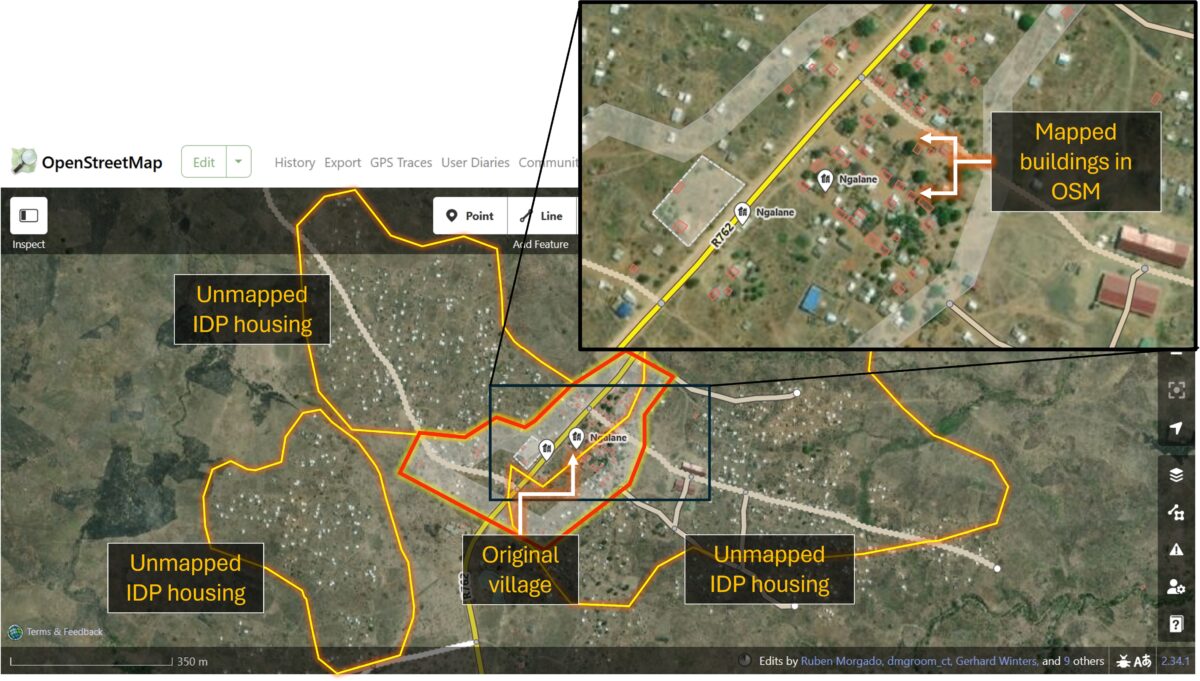
By navigating to the iD Editor window, we can see the OSM footprint of the original village (outlined in red), before the high influx of IDPs, has mostly been mapped. Red rectangles mark the buildings currently recorded in OSM.
OpenStreetMap iD Editor view of Ngalane (40°23’50″E 13°2’46″S ) with ESRI World Imagery as Basemap. Source: OpenStreetMap 2025
However, beyond the old village boundary, the newer settlements, home to the IDPs, remain entirely unmapped and therefore undocumented. In the event of a future storm or other climate-related hazard, the absence of mapping data for this community could result in their exclusion from impact assessments and early response planning.
Cuaia – an Out-of-Date Footprint
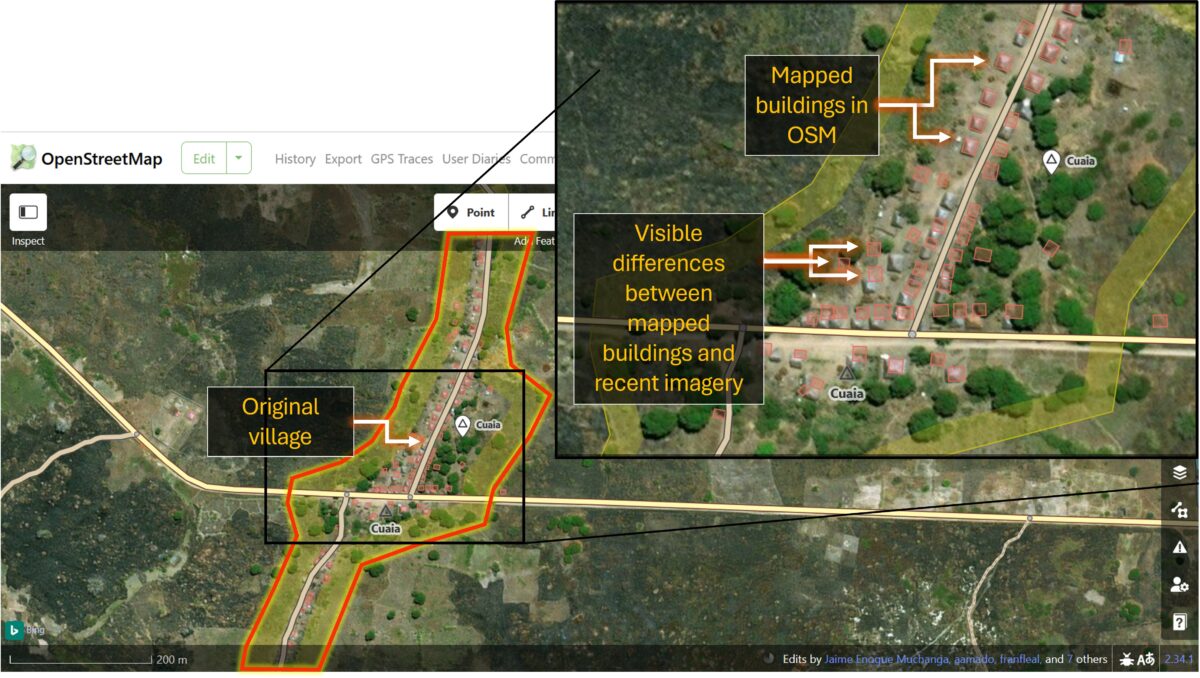
In Cuaia, 83 of the original village buildings have been mapped in OSM. None of the temporary structures have been documented, as they only briefly existed in 2021. However, when comparing the OSM data with more recent satellite imagery from 2025, it’s clear the settlement’s footprint is out of date: some buildings no longer exist, while others remain unmapped.
OpenStreetMap iD Editor view of Cuaia (40°21’E 12°59’50″S) with Bing Maps Aerial as Basemap. Source: OpenStreetMap 2025
The OSM metadata reveals that most structures were mapped between 2017 and 2019. If the data were needed for an accurate exposure assessment in the event of a cyclone or flood, for example, the OSM building footprints would need to be rapidly updated.
To address such time-sensitive scenarios, the initiative Humanitarian OpenStreetMap Team (HOT) organises rapid-response open mapping for crisis-affected areas.HOT is a global initiative that mobilises volunteers to help produce real-time geospatial information by tracing buildings, roads and rivers in OSM. Its Export Tool also allows users to select an area of interest and download custom extracts of OSM data, including building footprints, road networks, or land use, in various formats for geospatial analysis.
Analysing OSM data in Google Earth Pro
To overlay the settlement’s building footprints with the conflict and climate data, we will first export the relevant OSM layers using the HOT Export Tool, then import them into Google Earth Pro for analysis.
You will need to create a free HOT account before taking the next steps.
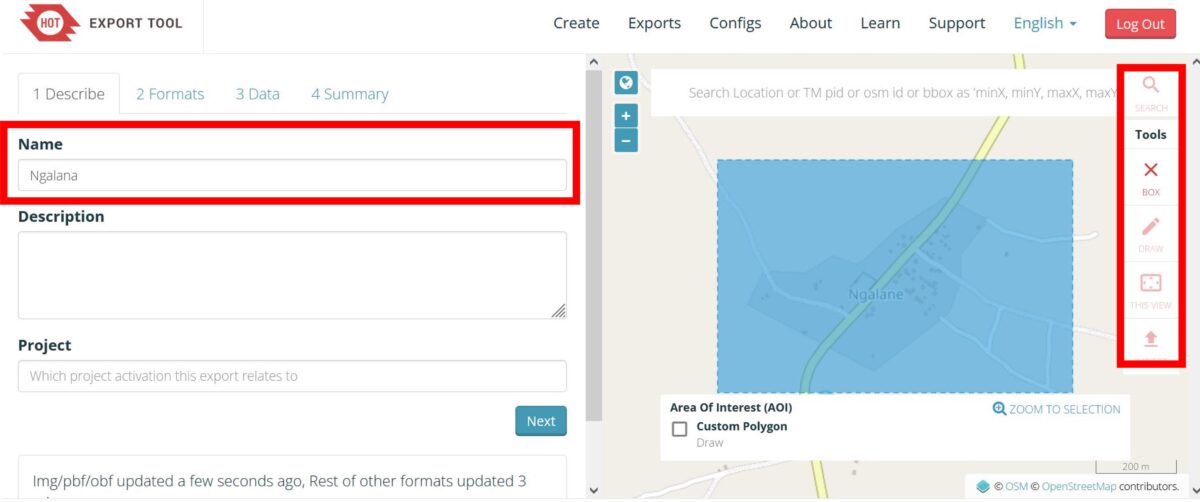
Step 1: Open the HOT Export Tool. Create a name for your dataset, then navigate to your area of interest, for example, Ngalane. Using the toolbar on the right, select the box tool and click and drag a rectangle over the area you want to export the data for.
HOT Export Tool. Source: HOT 2025
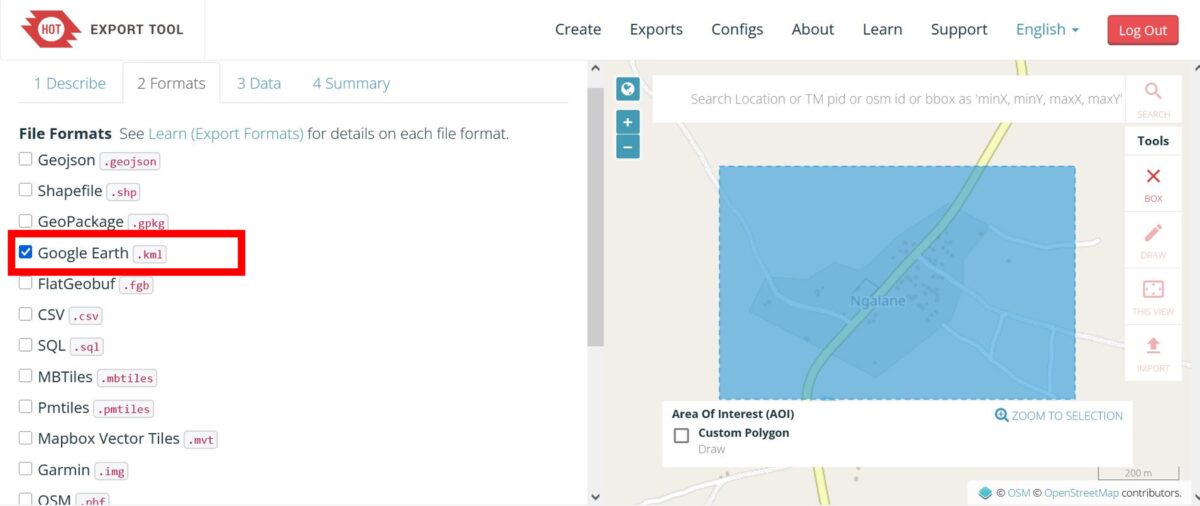
Step 2: Under the Formats tab select Google Earth .kml then click Next.
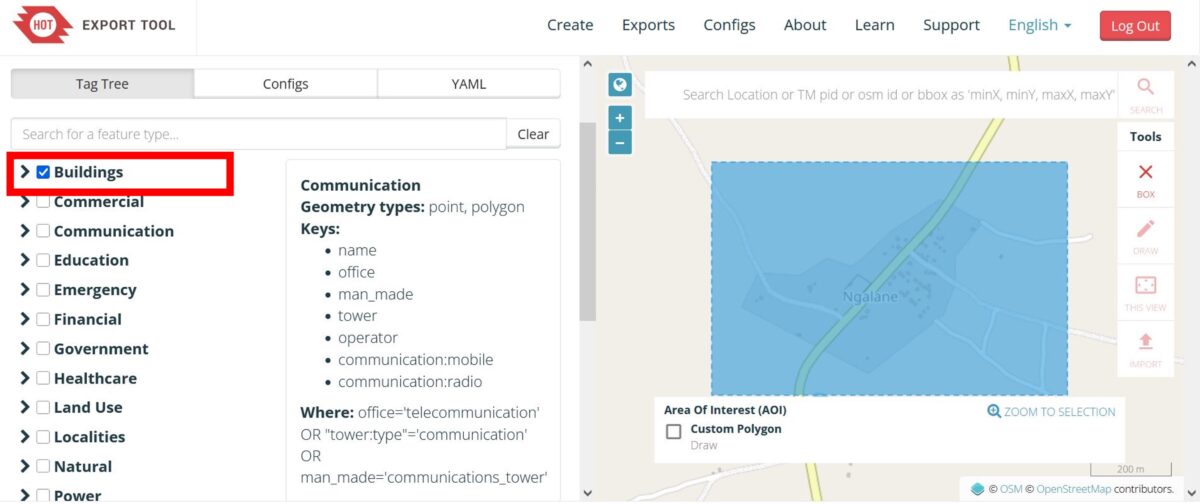
Step 3: Tick the Buildings box to export all building footprint data for your selected area. Click Next.
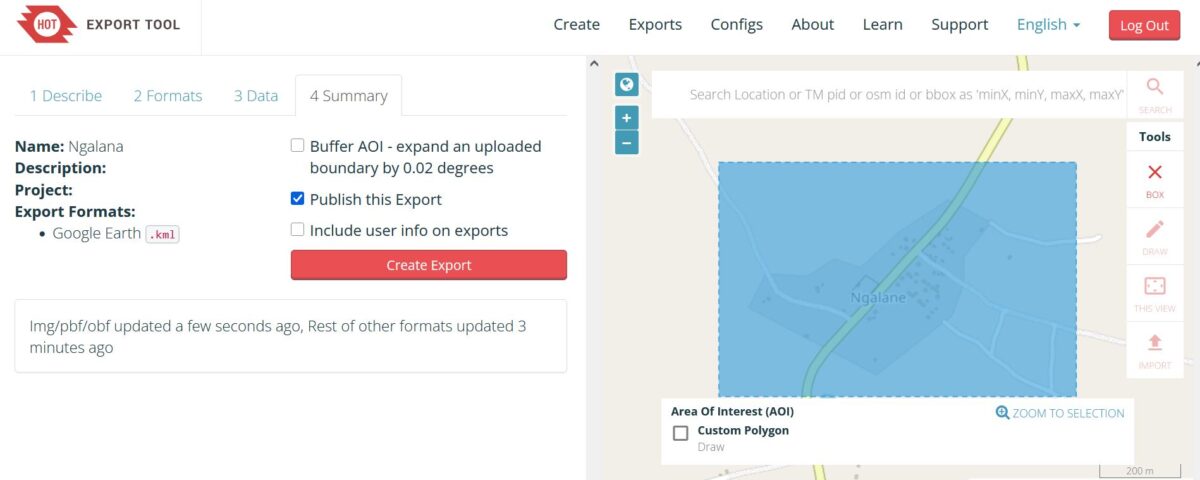
Step 4: Click Create Export.
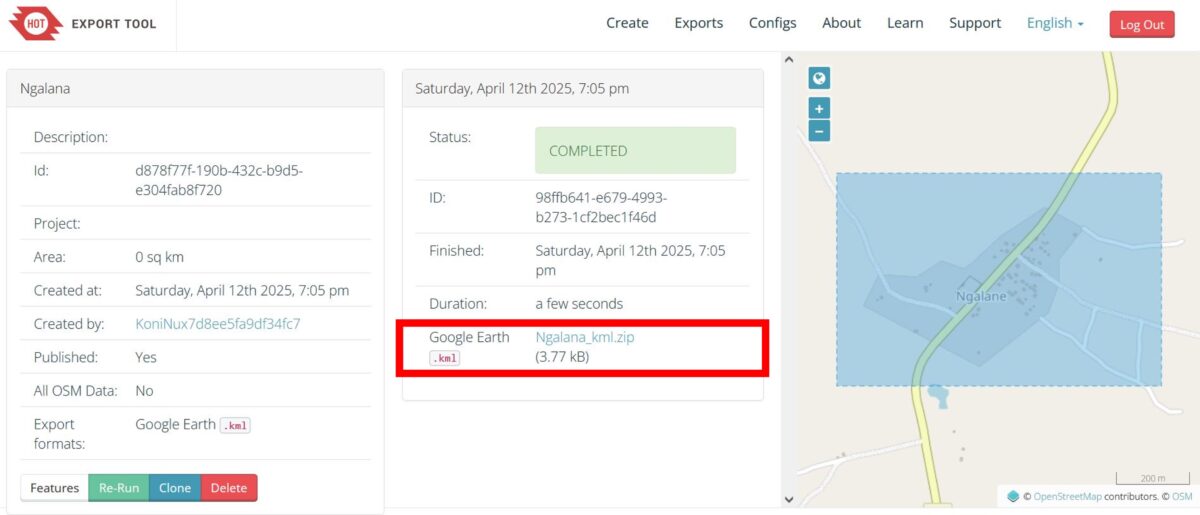
Step 5: Once the status shows Completed, click on the download link to save the data as a .zip file.
Step 6: To import the data into Google EarthPro, either drag and drop the .kml file directly into the program or go to File -> Import -> then select the downloaded file. Once the data is imported, right-click on the layer in the panel on the left, select Properties, and under the Style, Color tab, customise the appearance of the building data on your map.
HOT Export Tool. Source: GoogleEarthPro 2025
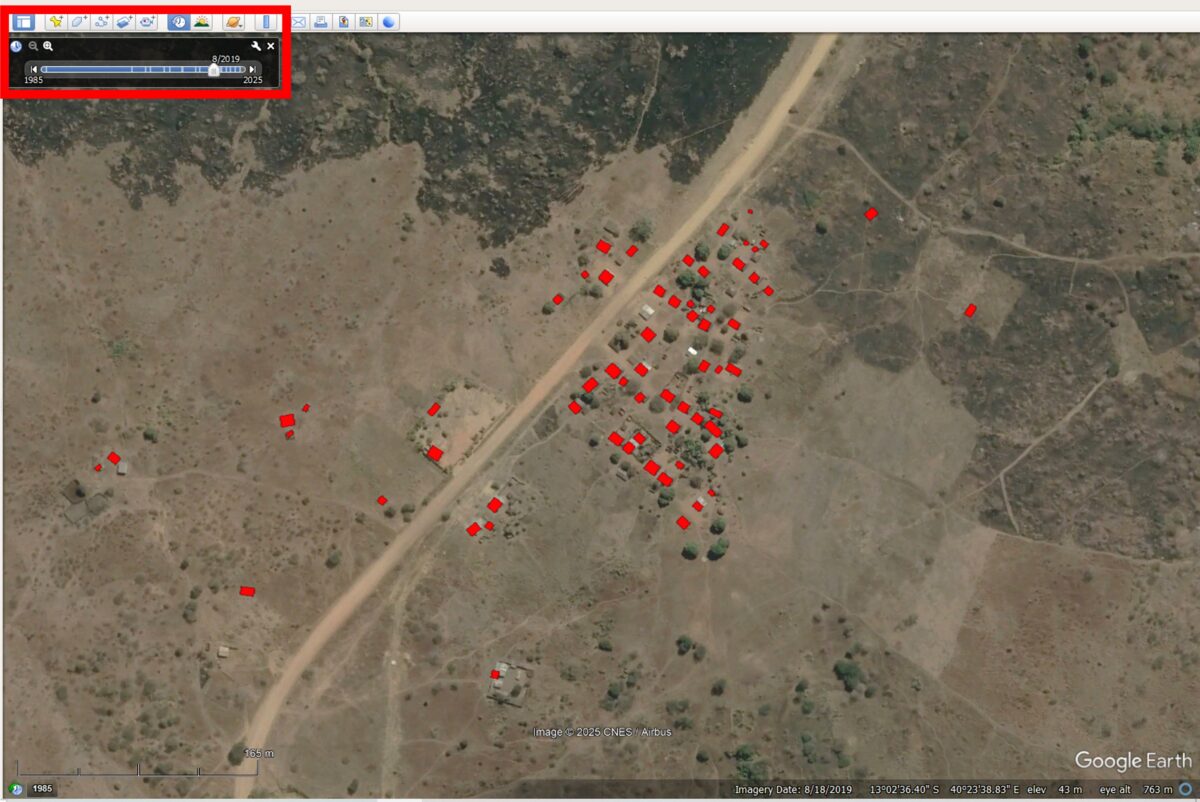
By visually comparing the distribution of mapped buildings to the satellite imagery in Google Earth Pro, you can assess the completeness and accuracy of OSM mapping in your area of interest. You can also explore historic satellite imagery through the Time-Tool to track changes in the building footprint over time and better understand how the settlement has developed.
OSM building footprint compared to historic imagery of Ngalane (40°23’50″E 13°2’46″S) from 2018. The year of the imagery was selected through the Time-Tool slider in the top left. Source: GoogleEarthPro 2025
Overlaying the Climate Data
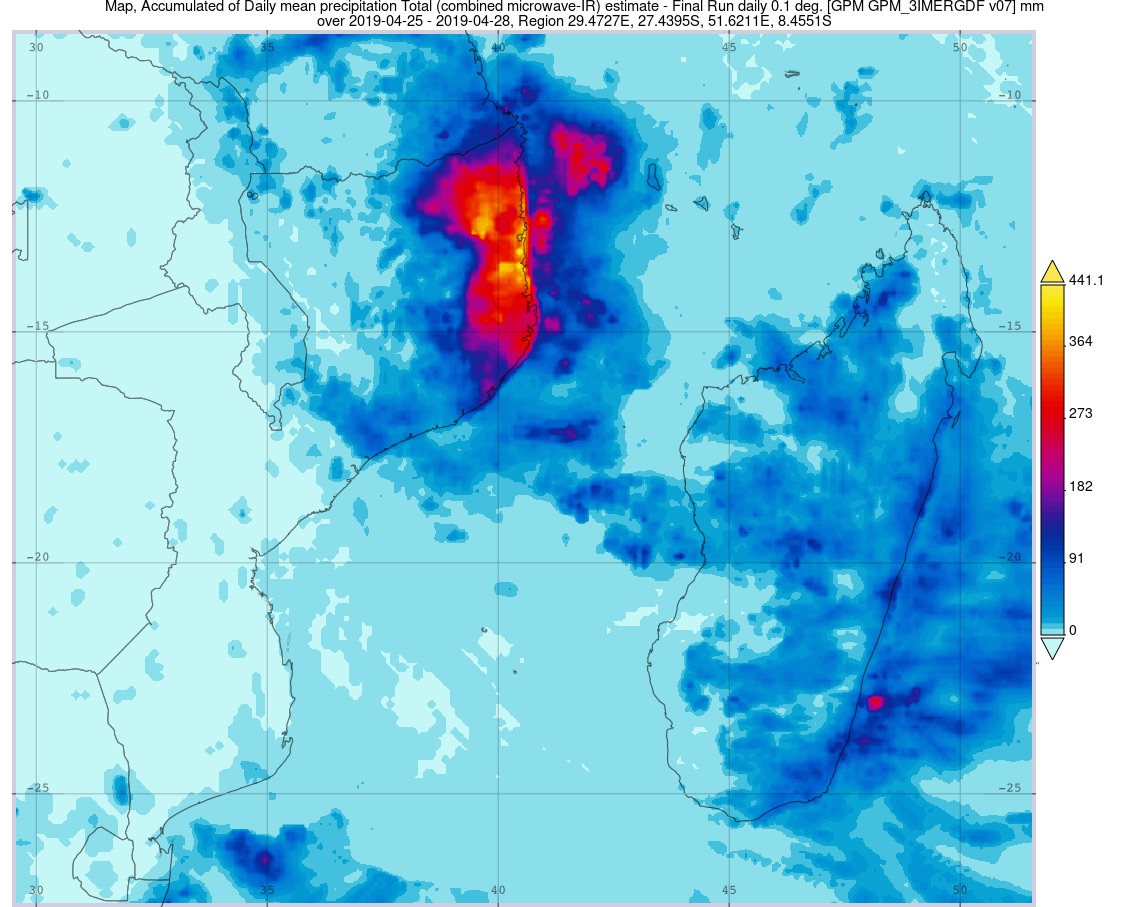
In Part I of this guide, we mapped NASA climate data, specifically the accumulated rainfall brought by Cyclone Kenneth in 2019, to highlight the cyclone’s path and its impact on communities in Cabo Delgado. For a refresher on how to import climate data into Google Earth Pro, see Part I of this guide.
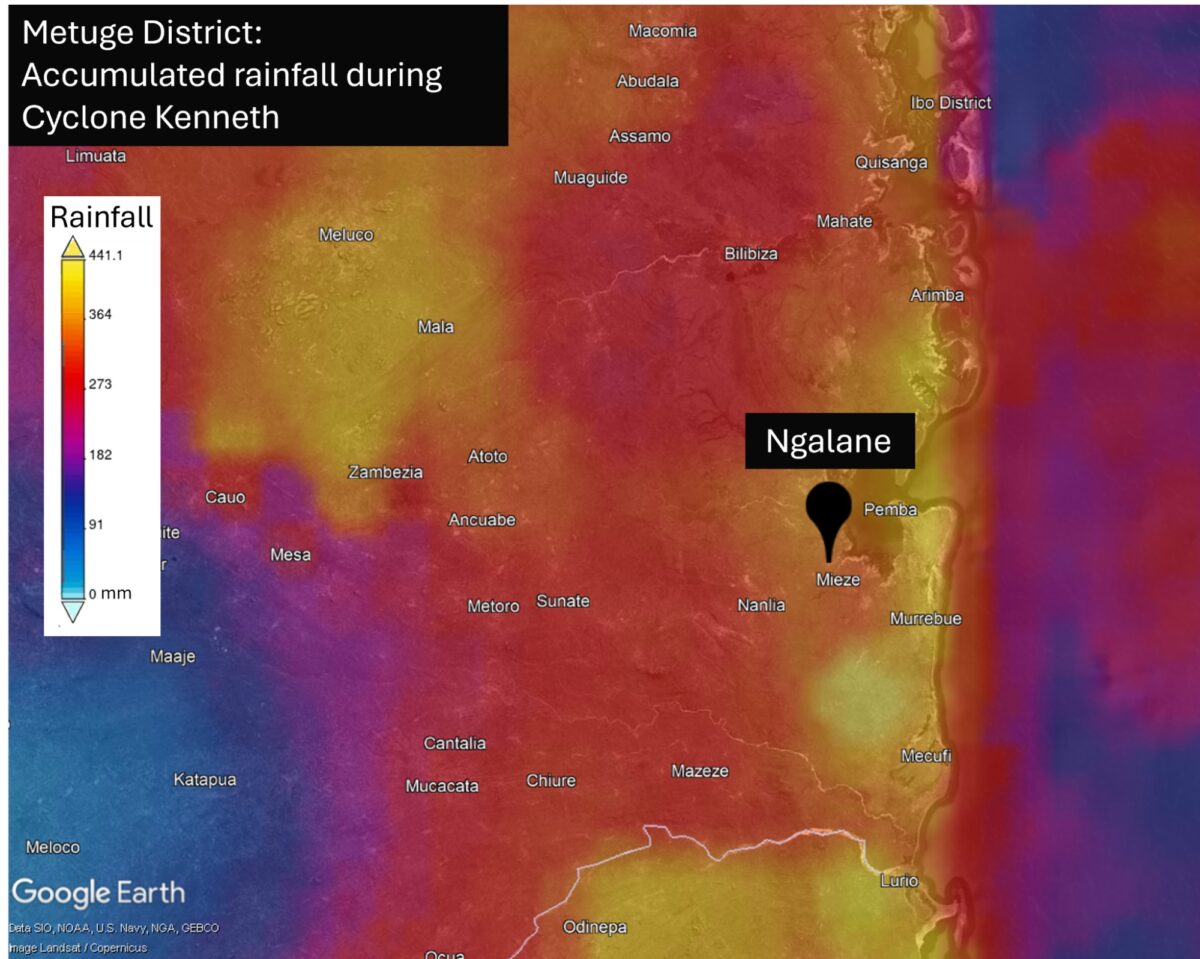
This map shows accumulated daily mean precipitation (mm) during Cyclone Kenneth, recorded along the coast of Cabo Delgado from April 25 and 28, 2019, which subsequently led to flooding in the region. Credit: NASA, 2025
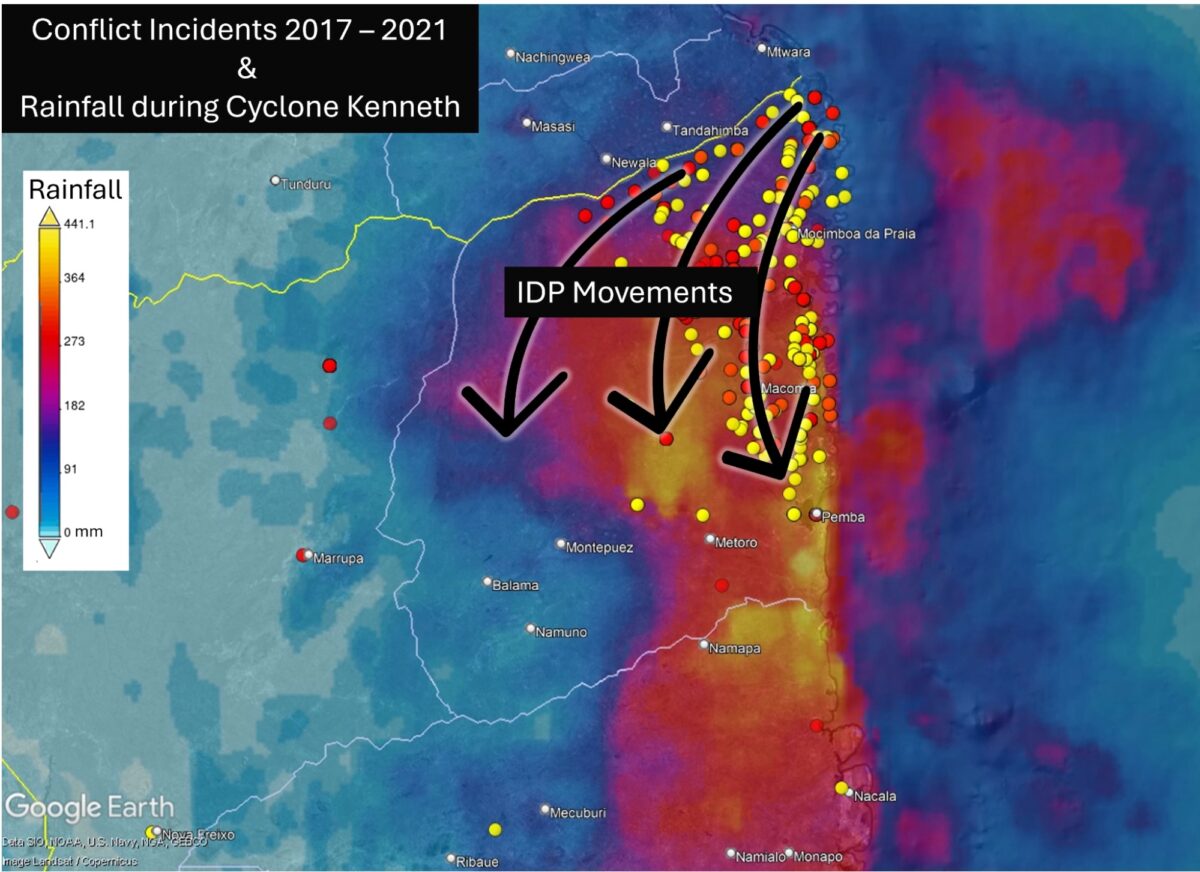
By overlaying the ACLED conflict incident data (2017 to 2021) with the accumulated rainfall data in Google Earth Pro, we can see how violence concentrated in the northwest was a major driver of displacement both before and during Cyclone Kenneth. However, displacement southward brought many directly into areas exposed to severe flooding.
Conflict incidents from 2017 to 2025 overlaid on accumulated daily mean precipitation (mm) during Cyclone Kenneth, recorded along the coast of Cabo Delgado between April 25 to 28, 2019. Source: ACLED 2025, NASA 2025, Google Earth Pro 2025
Zooming in on our case study settlement, Ngalane, further reveals this community’s high exposure to the impacts of Cyclone Kenneth, including heavy rainfall and flooding.
Situated within the highest rainfall impact area, Ngalane was highly exposed to flooding. Credit: NASA, 2025, Google Earth Pro 2025
With at least 63 homes visible in Ngalane’s OSM building footprint, we can estimate a minimum number of residents at the time Cyclone Kenneth struck. However, since the footprint was incomplete, the actual population was likely higher.
The OSM building footprint of Ngalane (40°23’50″E 13°2’46″S) overlaid on 2019 satellite imagery shows that the original village was mapped prior to Cyclone Kenneth landing. Credit: OSM 2025, Google Earth Pro 2025
Mapping Cabo Delgado in 2025
To date, numerous communities across Cabo Delgado remain unmapped and highly vulnerable to the next cyclone or flood, including Ngalane.
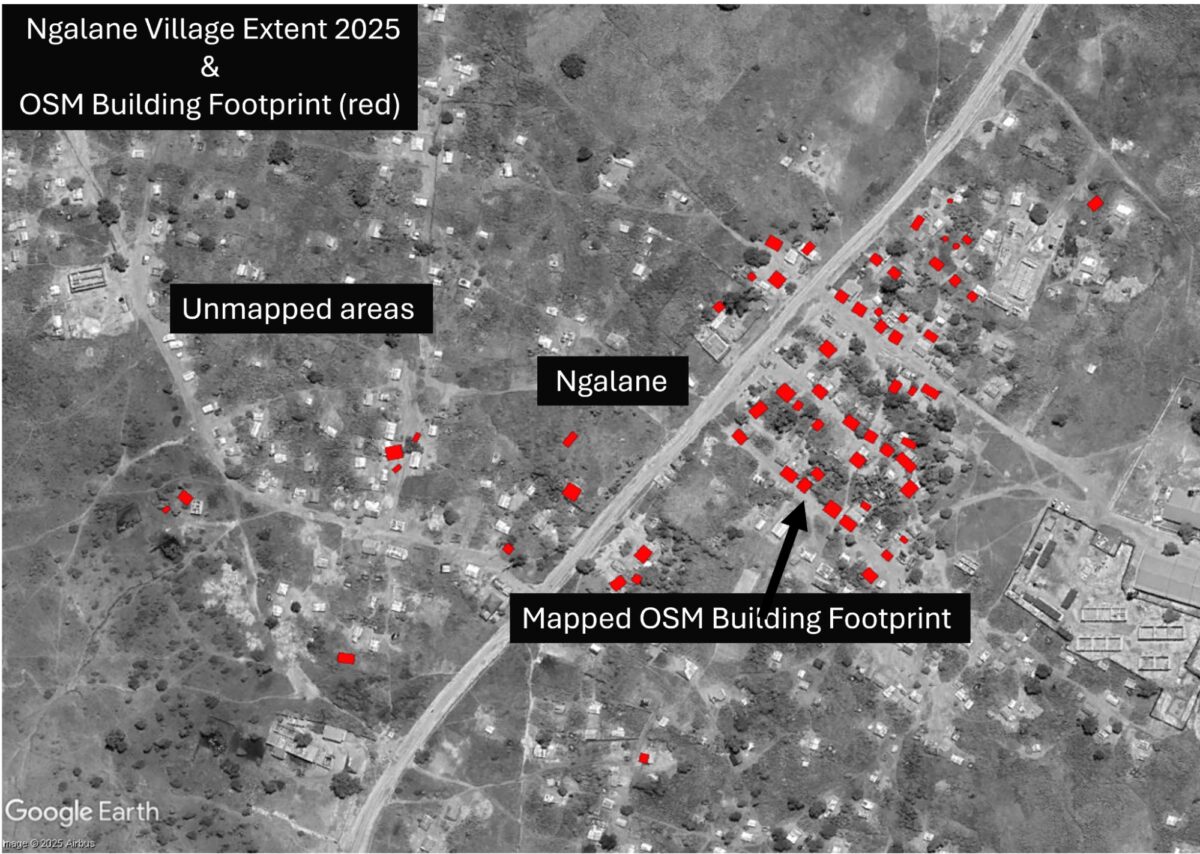
Recent satellite imagery of Ngalane reveals the rapid expansion of new buildings in all directions from the original village – all undocumented and therefore invisible on existing maps.
The OSM building footprint (red squares) of Ngalane (40°23’50″E 13°2’46″S) overlaid on satellite imagery from March 2025 illustrates areas of unmapped new homes which continue much further beyond the boundaries of this image. Credit: OSM 2025, Google Earth Pro 2025
In order to update essential mapping data of the community, together with HOT we have created a task in the HOT OSM Tasking Manager to initiate mapping of new buildings in Ngalane. Follow this link to create an account, complete the OSM mapping tutorial and start mapping buildings in Ngalane! Your efforts will help generate essential mapping data for this settlement, supporting preparedness for future storms in the region.
Bellingcat is a non-profit and the ability to carry out our work is dependent on the kind support of individual donors. If you would like to support our work, you can do so here. You can also subscribe to our Patreon channel here. Subscribe to our Newsletter and follow us on Bluesky here and Mastodon here.