Investigating multi-vector attacks in Log Explorer
In the world of cybersecurity, a single data point is rarely the whole story. Modern attackers don’t just knock on the front door; they probe your APIs, flood your network with "noise" to distract your team, and attempt to slide through applications and servers using stolen credentials.
To stop these multi-vector attacks, you need the full picture. By using Cloudflare Log Explorer to conduct security forensics, you get 360-degree visibility through the integration of 14 new datasets, covering the full surface of Cloudflare’s Application Services and Cloudflare One product portfolios. By correlating telemetry from application-layer HTTP requests, network-layer DDoS and Firewall logs, and Zero Trust Access events, security analysts can significantly reduce Mean Time to Detect (MTTD) and effectively unmask sophisticated, multi-layered attacks.
Read on to learn more about how Log Explorer gives security teams the ultimate landscape for rapid, deep-dive forensics.
The contemporary digital landscape requires deep, correlated telemetry to defend against adversaries using multiple attack vectors. Raw logs serve as the "flight recorder" for an application, capturing every single interaction, attack attempt, and performance bottleneck. And because Cloudflare sits at the edge, between your users and your servers, all of these events are logged before the requests even reach your infrastructure.
Cloudflare Log Explorer centralizes these logs into a unified interface for rapid investigation.
Focus: Website traffic, security events, and edge performance.
HTTP Requests | As the most comprehensive dataset, it serves as the "primary record" of all application-layer traffic, enabling the reconstruction of session activity, exploit attempts, and bot patterns. |
Firewall Events | Provides critical evidence of blocked or challenged threats, allowing analysts to identify the specific WAF rules, IP reputations, or custom filters that intercepted an attack. |
DNS Logs | Identify cache poisoning attempts, domain hijacking, and infrastructure-level reconnaissance by tracking every query resolved at the authoritative edge. |
NEL (Network Error Logging) Reports | Distinguish between a coordinated Layer 7 DDoS attack and legitimate network connectivity issues by tracking client-side browser errors. |
Spectrum Events | For non-web applications, these logs provide visibility into L4 traffic (TCP/UDP), helping to identify anomalies or brute-force attacks against protocols like SSH, RDP, or custom gaming traffic. |
Page Shield | Track and audit unauthorized changes to your site's client-side environment such as JavaScript, outbound connections. |
Zaraz Events | Examine how third-party tools and trackers are interacting with user data, which is vital for auditing privacy compliance and detecting unauthorized script behaviors. |
Focus: Internal security, Zero Trust, administrative changes, and network activity.
Access Requests | Tracks identity-based authentication events to determine which users accessed specific internal applications and whether those attempts were authorized. |
Audit Logs | Provides a trail of configuration changes within the Cloudflare dashboard to identify unauthorized administrative actions or modifications. |
CASB Findings | Identifies security misconfigurations and data risks within SaaS applications (like Google Drive or Microsoft 365) to prevent unauthorized data exposure. |
Magic Transit / IPSec Logs | Helps network engineers perform network-level (L3) monitoring such as reviewing tunnel health and view BGP routing changes. |
Browser Isolation Logs | Tracks user actions inside an isolated browser session (e.g., copy-paste, print, or file uploads) to prevent data leaks on untrusted sites |
Device Posture Results | Details the security health and compliance status of devices connecting to your network, helping to identify compromised or non-compliant endpoints. |
DEX Application Tests | Monitors application performance from the user's perspective, which can help distinguish between a security-related outage and a standard performance degradation. |
DEX Device State Events | Provides telemetry on the physical state of user devices, useful for correlating hardware or OS-level anomalies with potential security incidents. |
DNS Firewall Logs | Tracks DNS queries filtered through the DNS Firewall to identify communication with known malicious domains or command-and-control (C2) servers. |
Email Security Alerts | Logs malicious email activity and phishing attempts detected at the gateway to trace the origin of email-based entry vectors. |
Gateway DNS | Monitors every DNS query made by users on your network to identify shadow IT, malware callbacks, or domain-generation algorithms (DGAs). |
Gateway HTTP | Provides full visibility into encrypted and unencrypted web traffic to detect hidden payloads, malicious file downloads, or unauthorized SaaS usage. |
Gateway Network | Tracks L3/L4 network traffic (non-HTTP) to identify unauthorized port usage, protocol anomalies, or lateral movement within the network. |
IPSec Logs | Monitors the status and traffic of encrypted site-to-site tunnels to ensure the integrity and availability of secure network connections. |
Magic IDS Detections | Surfaces matches against intrusion detection signatures to alert investigators to known exploit patterns or malware behavior traversing the network. |
Network Analytics Logs | Provides high-level visibility into packet-level data to identify volumetric DDoS attacks or unusual traffic spikes targeting specific infrastructure. |
Sinkhole HTTP Logs | Captures traffic directed to "sinkholed" IP addresses to confirm which internal devices are attempting to communicate with known botnet infrastructure. |
WARP Config Changes | Tracks modifications to the WARP client settings on end-user devices to ensure that security agents haven't been tampered with or disabled. |
WARP Toggle Changes | Specifically logs when users enable or disable their secure connectivity, helping to identify periods where a device may have been unprotected. |
Zero Trust Network Session Logs | Logs the duration and status of authenticated user sessions to map out the complete lifecycle of a user's access within the protected perimeter. |
Get granular application layer visibility with HTTP Requests, Firewall Events, and DNS logs to see exactly how traffic is hitting your public-facing properties. Track internal movement with Access Requests, Gateway logs, and Audit logs. If a credential is compromised, you’ll see where they went. Use Magic IDS and Network Analytics logs to spot volumetric attacks and "East-West" lateral movement within your private network.
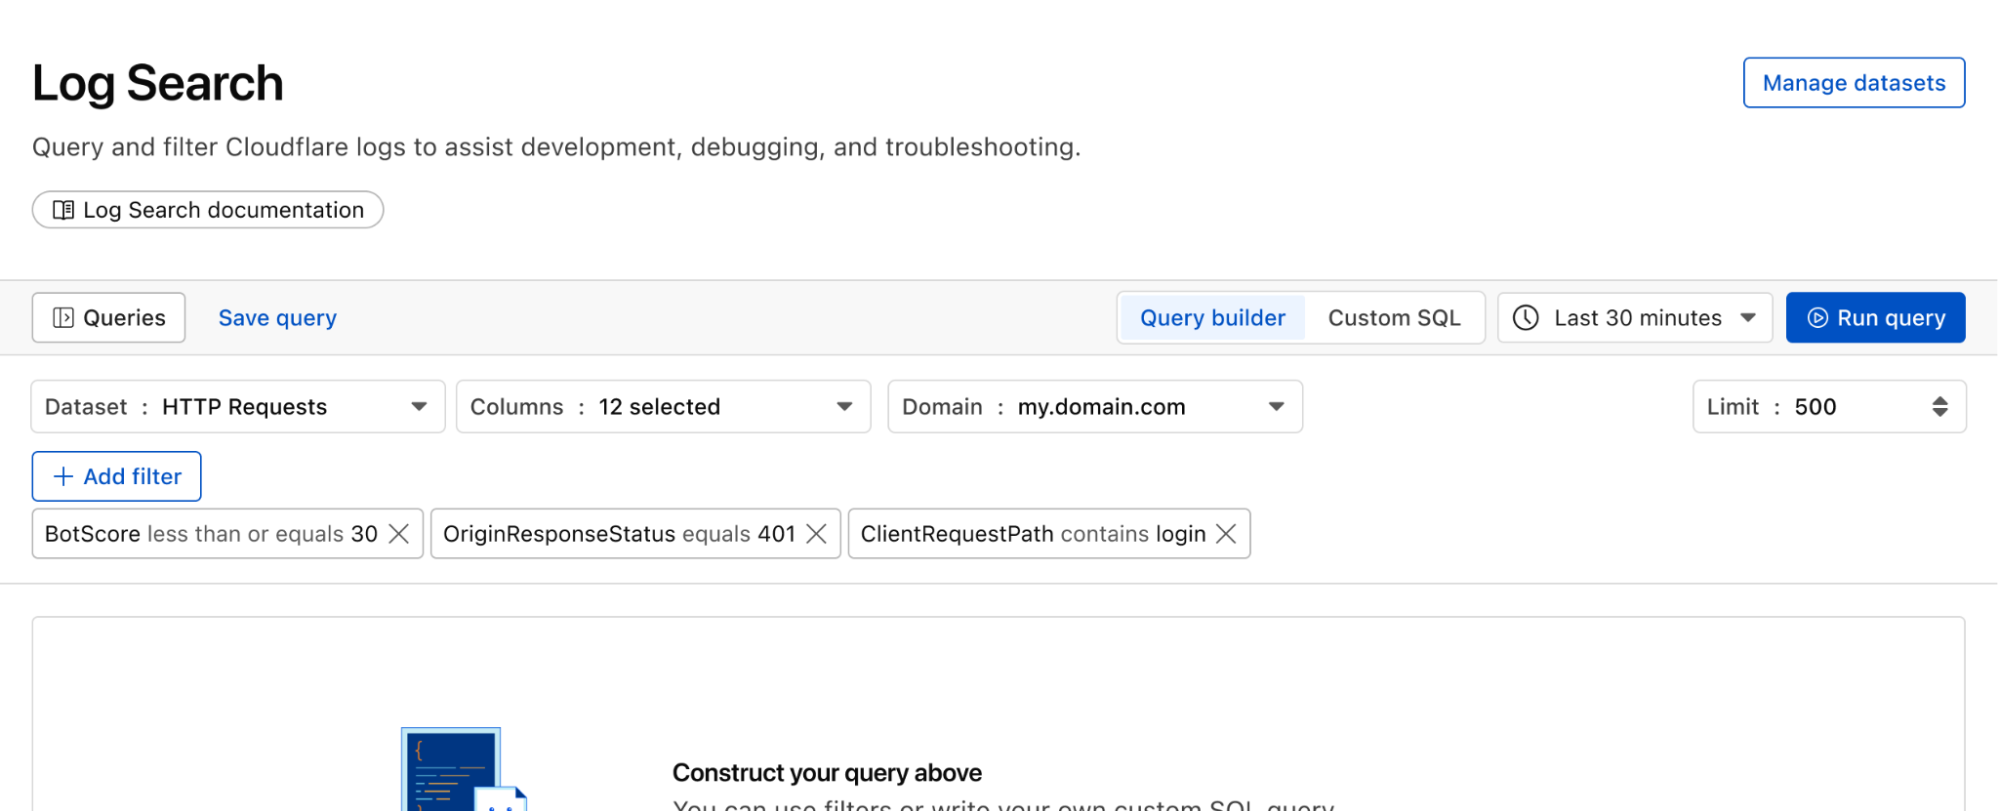
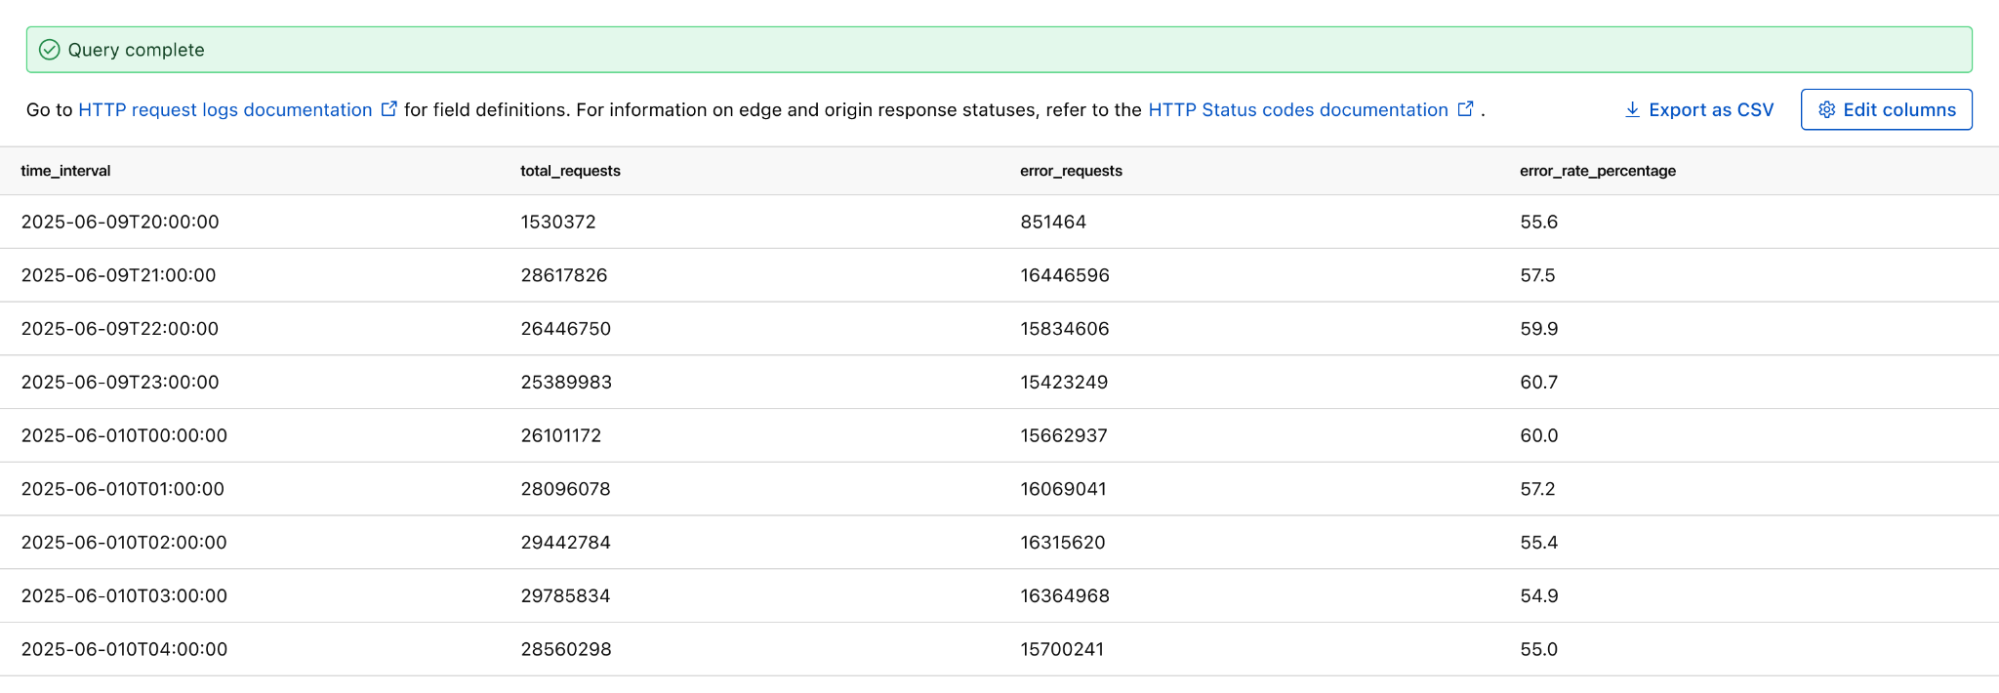
Attackers use scanners and other tools to look for entry points, hidden directories, or software vulnerabilities. To identify this, using Log Explorer, you can query http_requests for any EdgeResponseStatus codes of 401, 403, or 404 coming from a single IP, or requests to sensitive paths (e.g. /.env, /.git, /wp-admin).
Additionally, magic_ids_detections logs can also be used to identify scanning at the network layer. These logs provide packet-level visibility into threats targeting your network. Unlike standard HTTP logs, these logs focus on signature-based detections at the network and transport layers (IP, TCP, UDP). Query to discover cases where a single SourceIP is triggering multiple unique detections across a wide range of DestinationPort values in a short timeframe. Magic IDS signatures can specifically flag activities like Nmap scans or SYN stealth scans.
While the attacker is conducting reconnaissance, they may attempt to disguise this with a simultaneous network flood. Pivot to network_analytics_logs to see if a volumetric attack is being used as a smokescreen.
Once attackers identify a potential vulnerability, they begin to craft their weapon. The attacker sends malicious payloads (e.g. SQL injection or large/corrupt file uploads) to confirm the vulnerability. Review http_requests and/or fw_events to identify any Cloudflare detection tools that have triggered. Cloudflare logs security signals in these datasets to easily identify requests with malicious payloads using fields such as WAFAttackScore, WAFSQLiAttackScore, FraudAttack, ContentScanJobResults, and several more. Review our documentation to get a full understanding of these fields. The fw_events logs can be used to determine whether these requests made it past Cloudflare’s defenses by examining the action, source, and ruleID fields. Cloudflare’s managed rules by default blocks many of these payloads by default. Review Application Security Overview to know if your application is protected.

Showing the Managed rules Insight that displays on Security Overview if the current zone does not have Managed Rules enabled
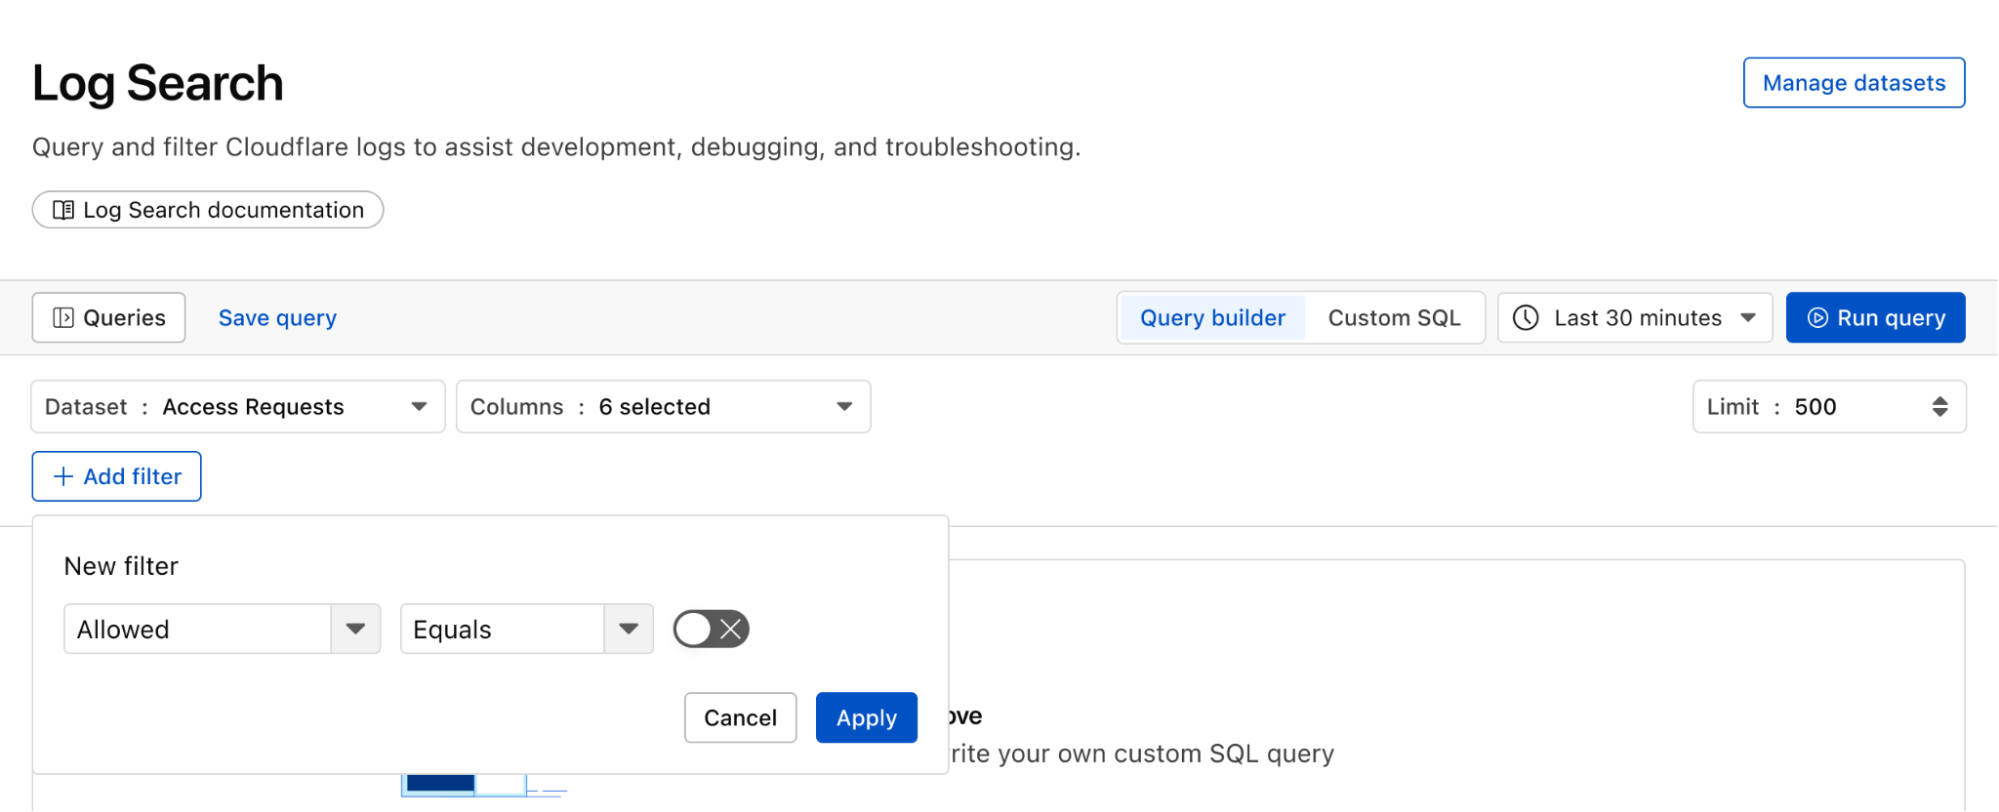
Did that suspicious IP manage to log in? Use the ClientIP to search access_requests. If you see a "Decision: Allow" for a sensitive internal app, you know you have a compromised account.
Attackers sometimes use DNS tunneling to bypass firewalls by encoding sensitive data (like passwords or SSH keys) into DNS queries. Instead of a normal request like google.com, the logs will show long, encoded strings. Look for an unusually high volume of queries for unique, long, and high-entropy subdomains by examining the fields: QueryName: Look for strings like h3ldo293js92.example.com, QueryType: Often uses TXT, CNAME, or NULL records to carry the payload, and ClientIP: Identify if a single internal host is generating thousands of these unique requests.
Additionally, attackers may attempt to leak sensitive data by hiding it within non-standard protocols or by using common protocols (like DNS or ICMP) in unusual ways to bypass standard firewalls. Discover this by querying the magic_ids_detections logs to look for signatures that flag protocol anomalies, such as "ICMP tunneling" or "DNS tunneling" detections in the SignatureMessage.
Whether you are investigating a zero-day vulnerability or tracking a sophisticated botnet, the data you need is now at your fingertips.
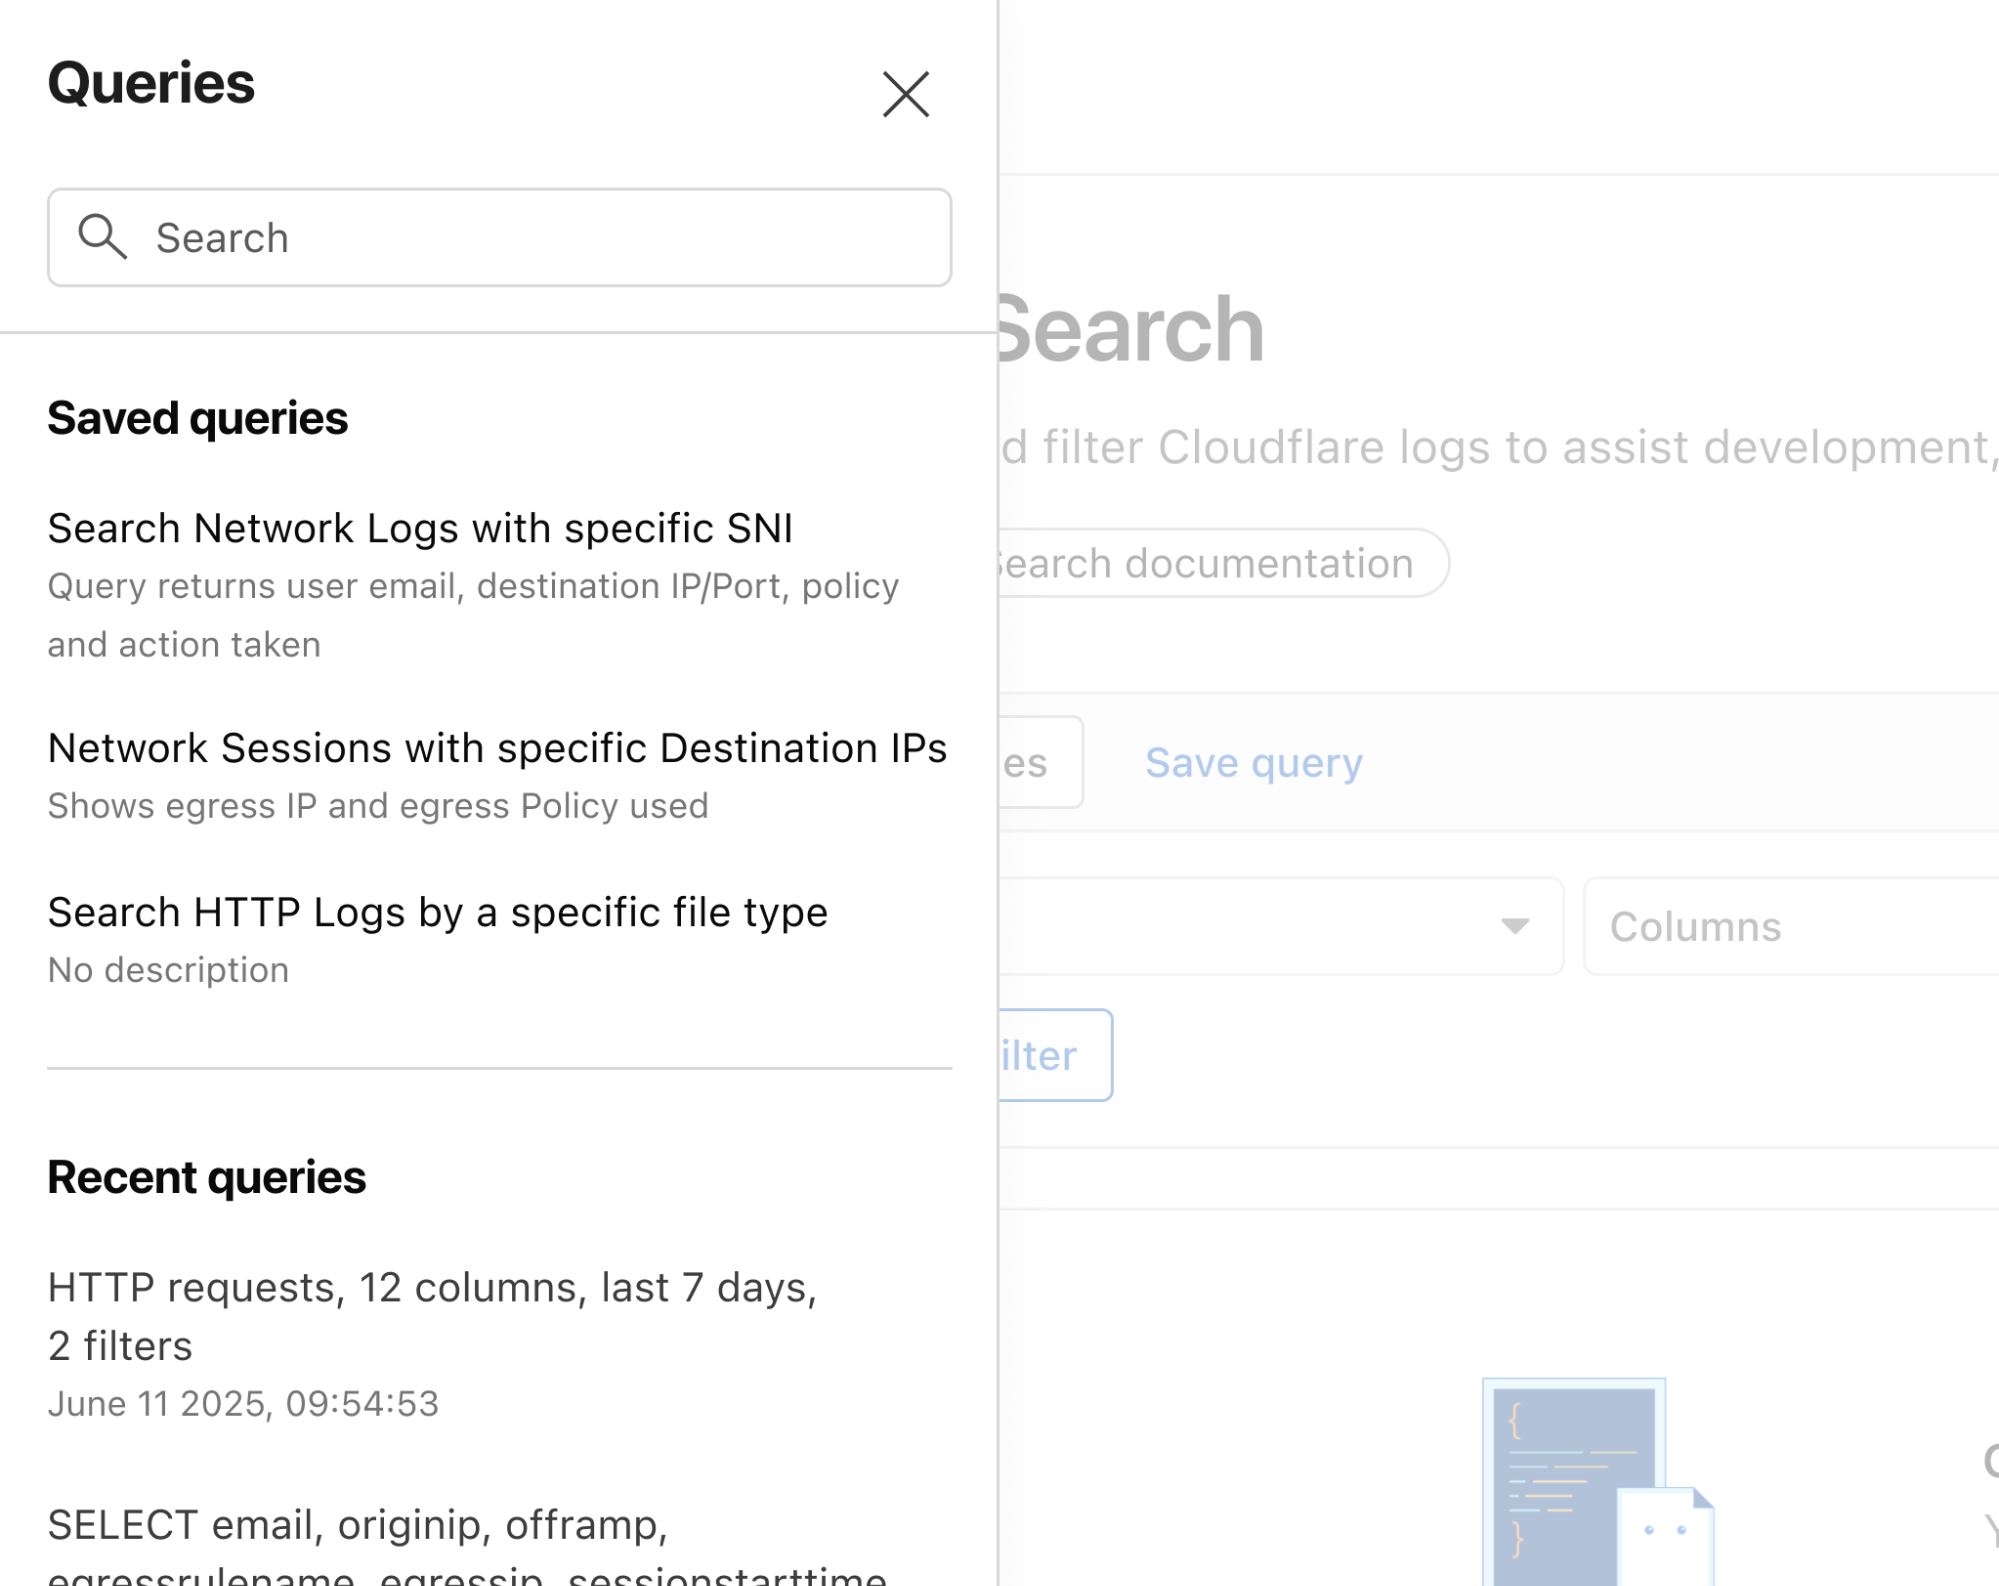
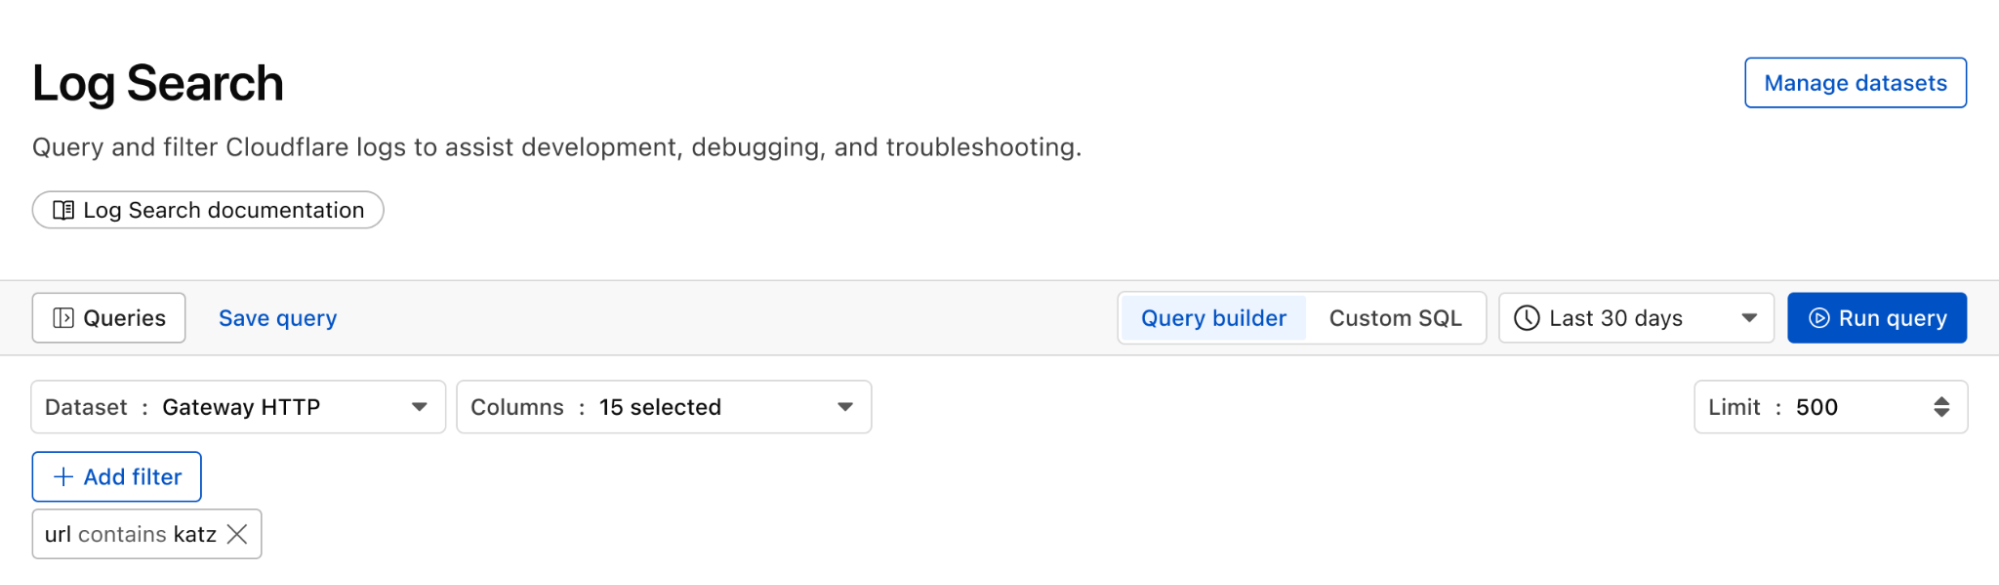
Investigate malicious activity across multiple datasets by pivoting between multiple concurrent searches. With Log Explorer, you can now work with multiple queries simultaneously with the new Tabs feature. Switch between tabs to query different datasets or Pivot and adjust queries using filtering via your query results.
When you correlate data across multiple Cloudflare log sources, you can detect sophisticated multi-stage attacks that appear benign when viewed in isolation. This cross-dataset analysis allows you to see the full attack chain from reconnaissance to exfiltration.
Scenario: A user authenticates via Cloudflare Access, but their subsequent HTTP_request traffic looks like a bot.
Step 1: Identify high-risk sessions in http_requests.
SELECT RayID, ClientIP, ClientRequestUserAgent, BotScore
FROM http_requests
WHERE date = '2026-02-22'
  AND BotScore < 20
LIMIT 100
Step 2: Copy the RayID and search access_requests to see which user account is associated with that suspicious bot activity.
SELECT Email, IPAddress, Allowed
FROM access_requests
WHERE date = '2026-02-22'
AND RayID = 'INSERT_RAY_ID_HERE'Scenario: An employee clicked a link in a phishing email which resulted in compromising their workstation. This workstation sends a DNS query for a known malicious domain, then immediately triggers an IDS alert.
Step 1: Find phishing attacks by examining email_security_alerts for violations.
SELECT Timestamp, Threatcategories, To, Alertreason
FROM email_security_alerts
WHERE date = '2026-02-22'
  AND Threatcategories LIKE 'phishing'
Step 2: Use Access logs to correlate the user’s email (To) to their IP Address.
SELECT Email, IPAddress
FROM access_requests
WHERE date = '2026-02-22'
Step 3: Find internal IPs querying a specific malicious domain in gateway_dns logs.
SELECT SrcIP, QueryName, DstIP,
FROM gateway_dns
WHERE date = '2026-02-22'
  AND SrcIP = 'INSERT_IP_FROM_PREVIOUS_QUERY'
AND QueryName LIKE '%malicious_domain_name%'Scenario: A user logs in via Zero Trust and then tries to scan the internal network.
Step 1: Find successful logins from unexpected locations in access_requests.
SELECT IPAddress, Email, Country
FROM access_requests
WHERE date = '2026-02-22'
  AND Allowed = true
  AND Country != 'US' -- Replace with your HQ country
Step 2: Check if that IPAddress is triggering network-level signatures in magic_ids_detections.
SELECT SignatureMessage, DestinationIP, Protocol
FROM magic_ids_detections
WHERE date = '2026-02-22'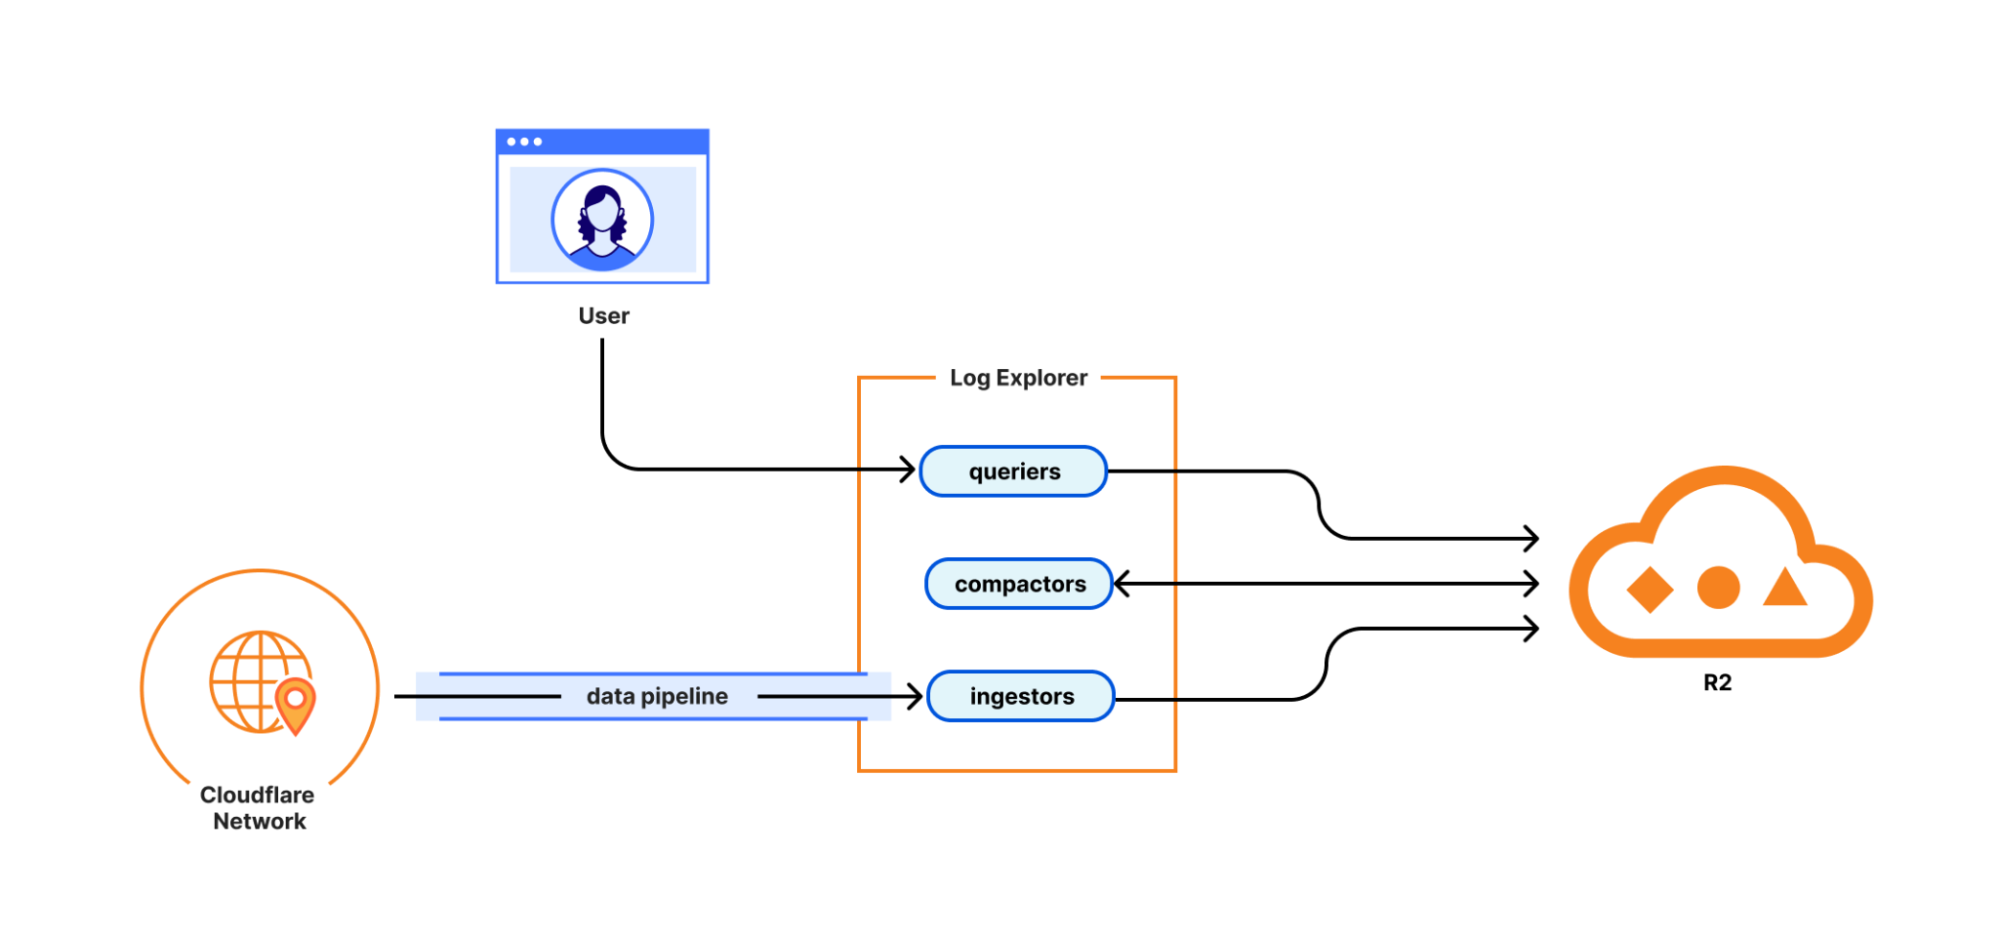
AND SourceIP = 'INSERT_IP_ADDRESS_HERE'From the beginning, Log Explorer was designed with extensibility in mind. Every dataset schema is defined using JSON Schema, a widely-adopted standard for describing the structure and types of JSON data. This design decision has enabled us to easily expand beyond HTTP Requests and Firewall Events to the full breadth of Cloudflare's telemetry. The same schema-driven approach that powered our initial datasets scaled naturally to accommodate Zero Trust logs, network analytics, email security alerts, and everything in between.
More importantly, this standardization opens the door to ingesting data beyond Cloudflare's native telemetry. Because our ingestion pipeline is schema-driven rather than hard-coded, we're positioned to accept any structured data that can be expressed in JSON format. For security teams managing hybrid environments, this means Log Explorer could eventually serve as a single pane of glass, correlating Cloudflare's edge telemetry with logs from third-party sources, all queryable through the same SQL interface. While today's release focuses on completing coverage of Cloudflare's product portfolio, the architectural groundwork is laid for a future where customers can bring their own data sources with custom schemas.
To investigate a multi-vector attack effectively, timing is everything. A delay of even a few minutes in the log availability can be the difference between proactive defense and reactive damage control.
That is why we have optimized our ingestion for better speed and resilience. By increasing concurrency in one part of our ingestion path, we have eliminated bottlenecks that could cause “noisy neighbor” issues, ensuring that one client’s data surge doesn’t slow down another’s visibility. This architectural work has reduced our P99 ingestion latency by approximately 55%, and our P50 by 25%, cutting the time it takes for an event at the edge to become available for your SQL queries.
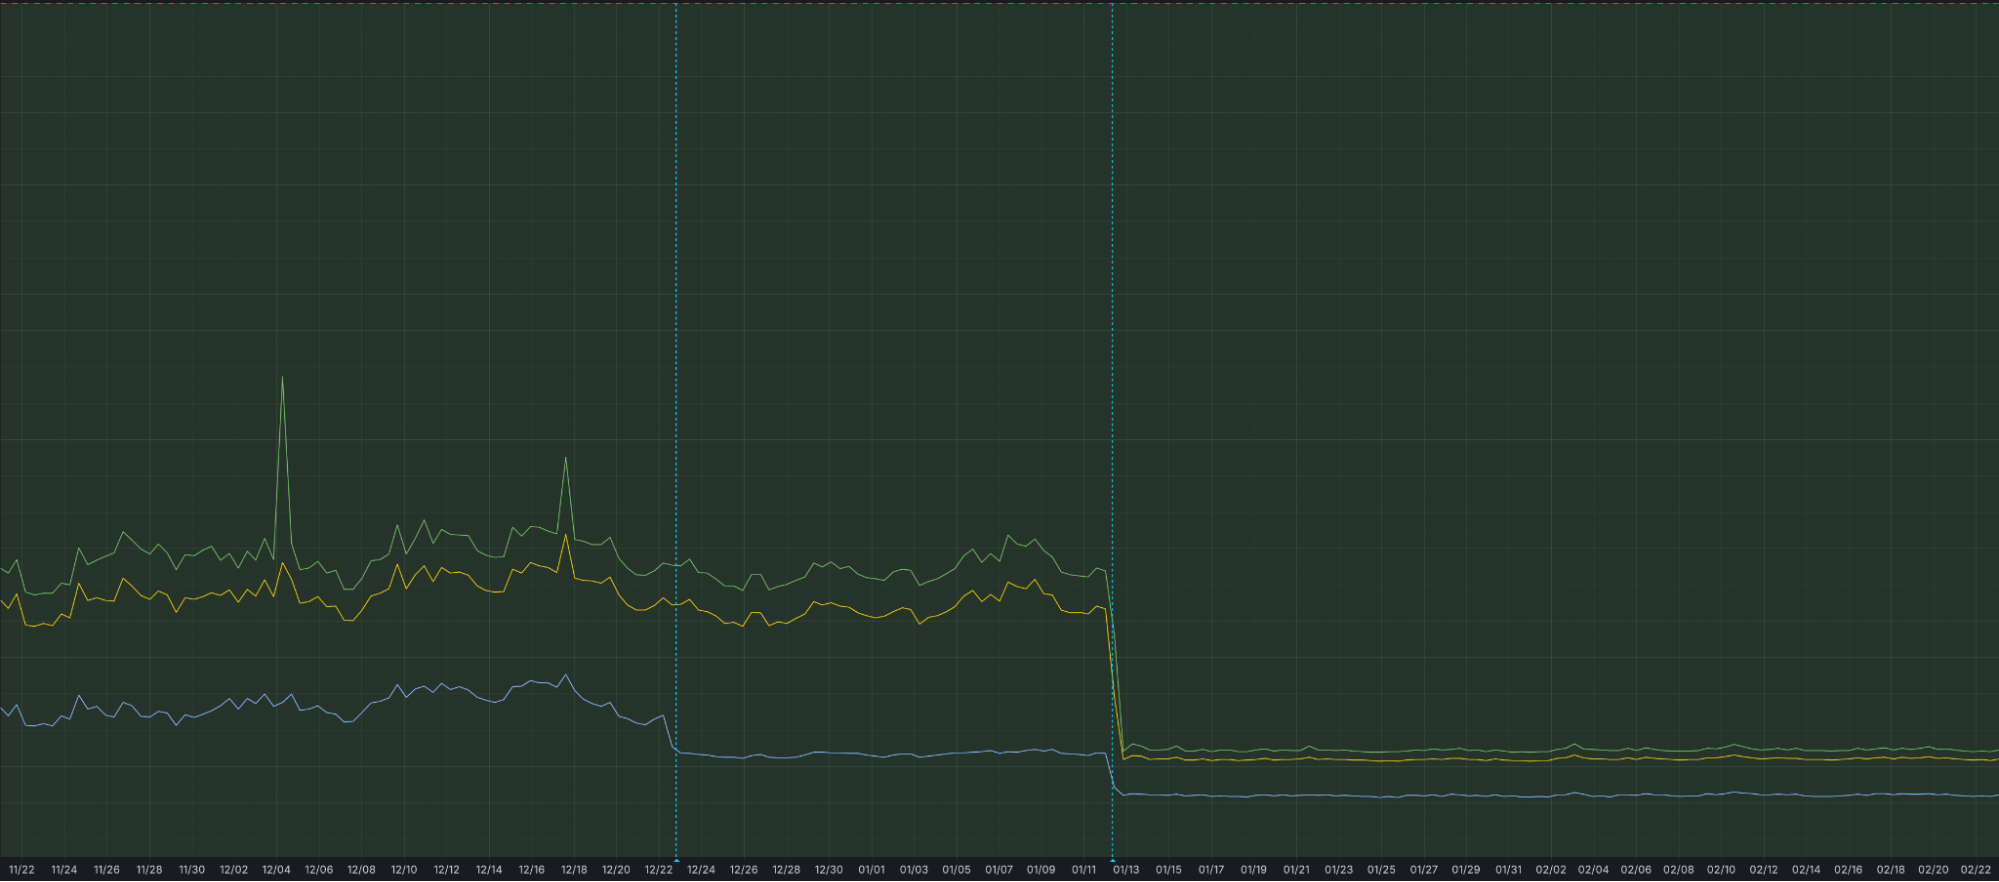
Grafana chart displaying the drop in ingest latency after architectural upgrades
We're just getting started. We're actively working on even more powerful features to further enhance your experience with Log Explorer, including the ability to run these detection queries on a custom defined schedule.
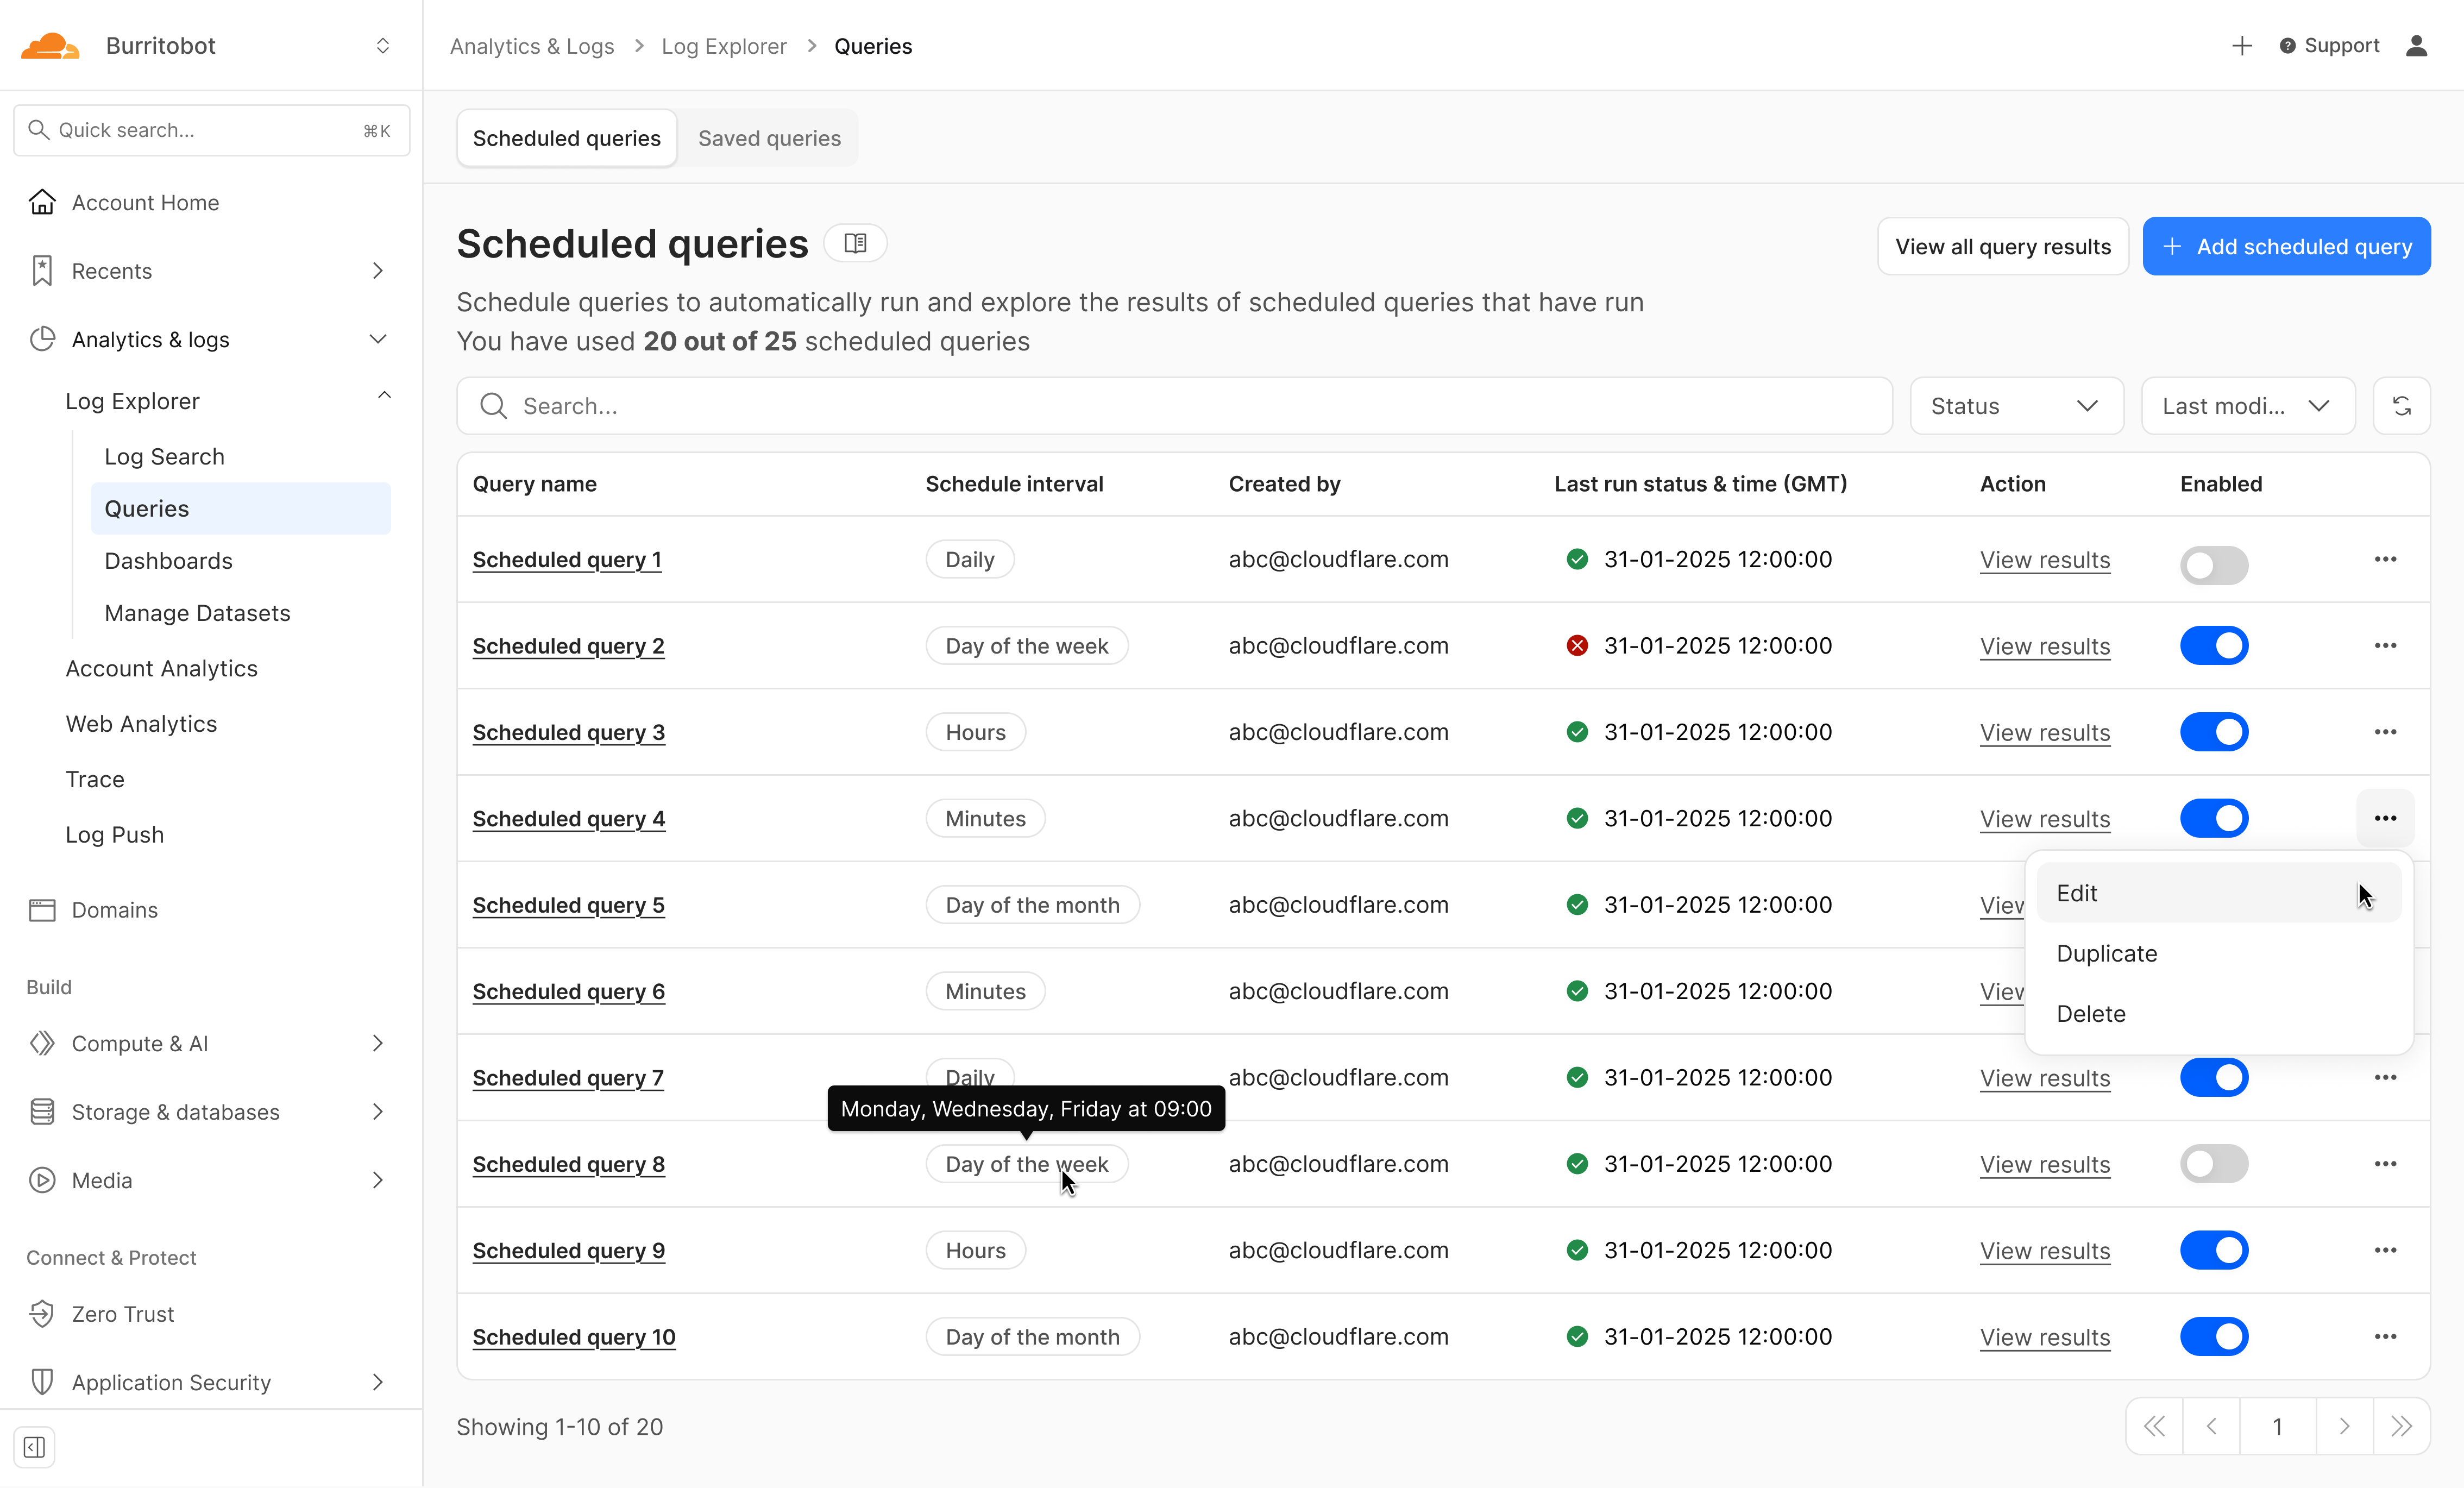
Design mockup of upcoming Log Explorer Scheduled Queries feature
Subscribe to the blog and keep an eye out for more Log Explorer updates soon in our Change Log.
To get access to Log Explorer, you can purchase self-serve directly from the dash or for contract customers, reach out for a consultation or contact your account manager. Additionally, you can read more in our Developer Documentation.