Visualização de leitura

When Satellite Imagery Goes Dark: New Tool Shows Damage in Iran and the Gulf

Access to open source visuals of the current Iran conflict, which has spread to many parts of the Middle East, continues to be sporadic. Videos and photos from within Iran trickle out on social media as the Iranian internet blackout hinders the flow of digital communication. 

In past conflicts, satellite imagery has provided a vital overview of potential damage to both military and civilian infrastructure, especially when there are digital black spots or obstacles to on-the-ground reporting. But imagery from commercial providers is becoming increasingly restricted, leaving even those who have access to the most expensive imagery in the dark. 

Shortly after the war in Gaza began in 2023, Bellingcat introduced a free tool authored by University College London lecturer and Bellingcat contributor, Ollie Ballinger, that was able to estimate the number of damaged buildings in a given area. This helped monitor and map the scale of destruction across the territory as Israel’s military operation progressed. 

Bellingcat is now introducing an updated version of the open source tool — called the Iran Conflict Damage Proxy Map — focused on destruction in Iran and the wider Gulf region. 

It can be accessed here.

How it Works


The tool works by conducting a statistical test on Synthetic Aperture Radar (SAR) imagery captured by the Sentinel-1 satellite which is part of the Copernicus mission developed and operated by the European Space Agency. SAR sends pulses of microwaves at the earth’s surface and uses their echo to capture textural information about what it detects. 

The SAR data for the geographic area covered by the tool is put through the Pixel-Wise T-Test (PWTT) damage detection algorithm, which was also developed by Ollie Ballinger. It takes a reference period of one year’s worth of SAR imagery before the onset of the war and calculates a “normal” range within which 99% of the observations fall. It then conducts the same process for imagery in an inference period following the onset of the war, and compares it to the reference period. The core idea is that if a building has become damaged since the beginning of the war, then the “echo” (called backscatter) from that pixel will be consistently outside of the normal range of values for that particular area. Investigators can then further probe potential damage around this highlighted area.

The plot below shows how the process was applied to Gaza and several Syrian, Iraqi and Ukrainian cities. The bars represent the weekly total number of clashes in each place, sourced from the Armed Conflict Location Event (ACLED) dataset. The pre-war reference periods are shaded in blue, spanning one year before the onset of each conflict. The one month inference periods after the respective conflicts  began are shaded in orange. The blue and orange areas are what the tool compares. 

The plot below shows an area with a number of warehouses in Tehran’s southwest. Some of the buildings show clear damage in optical Sentinel-2 imagery (something that has to be accessed outside of the tool via the Copernicus Browser). 

Clicking on the map within the tool generates a chart displaying that pixel’s historical backscatter; the red dotted lines denote a range within which 99% of the pre-war backscatter values fall. In this example, we can see that from March 14 onwards, the backscatter values over this warehouse begin to consistently fall outside of their historical normal range. This could signal that damage has been detected in the area.

Two important aspects of this workflow are that it utilises free and fully open access satellite data, as opposed to commercial satellite services; the second is that it overcomes some key limitations of AI in this domain, the most serious of which is called overfitting. This is where a model trained in one area is deployed in a new unseen area, and fails to generalise. Because we’re only ever comparing each pixel against its own historical baseline, we don’t run into that problem. 

Accuracy


The PWTT has been published in a scientific journal after two years of review.  Its accuracy was  assessed using an original dataset of over two million building footprints labeled by the United Nations, spanning 30 cities across Gaza, Ukraine, Sudan, Syria, and Iraq. Despite being simple and lightweight, the algorithm has been recorded achieving building-level accuracy statistics (AUC=0.87 in the full sample) rivaling state of the art methods that use deep learning and high resolution imagery. The plot below compares building-level predictions from the PWTT against the UN damage annotations in Hostomel, Ukraine. True positives (PWTT and United Nations agree on damage) are shown in red, true negatives are shown in green, false positives in orange, and false negatives in purple. The graphic shows the accuracy of the tool, while also emphasising that further checks on what it highlights should be conducted to draw full conclusions.  

It is important to note that just because the tool may show a high probability of a building or buildings being damaged or destroyed, that doesn’t make it definite. 

It is best to check with any other available imagery — either open source photos and videos that’ve been geolocated by a group such as Geoconfirmed or Sentinel-2 as well as other commercial satellite imagery if it’s up-to-date for the area. At time of publication, Sentinel-2 satellite imagery still offers coverage over the area that the tool focuses on. Other commercial satellite imagery providers have limited their coverage.

What the tool excels at is highlighting and narrowing down areas so that further corroboration or further confirmation can be sought.

Testing the Tool


Using the Iran Conflict Damage Proxy Map, we can spot some of the larger areas of potential damage or destruction that have occurred since the Iran war started. 

Starting from a zoomed-out view of Tehran, there are a few spots that appear with large clusters of high damage probability. Cross-referencing these locations with open source map data from platforms like OpenStreetMap or Wikimapia, we can start finding sites that would make for likely targets – such as military sites.

One example of a potentially damaged site visible in the tool is the Valiasr Barracks in central Tehran, which was struck in the first week of the war. By going to the Copernicus Browser and reviewing the area with optical Sentinel-2 imagery, we can see clear indications of damage at the barracks.

IRGC Valiasr Barracks in Tehran:

Below: Sentinel-2 comparison of February 20 and March 17.

A large Islamic Revolutionary Guard Corps (IRGC) compound near Isfahan is another example of military infrastructure that is readily visible in both the Iran Conflict Damage Proxy Map as well as Sentinel-2 imagery. 

IRGC Ashura Garrison in Isfahan:

Below: Sentinel-2 comparison of February 20 and March 17.

Air bases have also been a frequent target for U.S.-Israeli strikes in Iran. The Fath Air Base just outside of Tehran, near the city of Karaj, shows the signature of potential damage when using the tool. Checking Sentinel-2 imagery shows damage to multiple large buildings on the northern side of the base.

Fath Air Base in Karaj:

Below: Sentinel-2 comparison of February 20 and March 17.

The U.S. has stated that destroying Iran’s “defense industrial base” is also a goal, which makes large areas like the Khojir missile production complex east of Tehran a good location to search with this tool. The tool suggests large clusters of damage on both the eastern and western sides of the complex — near areas where solid propellant is reportedly produced and where other fuel components are reportedly made.

Khojir Missile Production Complex outside of Tehran:

Below: Sentinel-2 comparison of February 20 and March 17.

Usage in the Gulf Region

While useful for providing a sense of damaged areas in Iran, the Iran Conflict Damage Proxy Map can also be used to see damage outside of Iran, particularly at sites in the region which Iran has been targeting with drones and missiles.

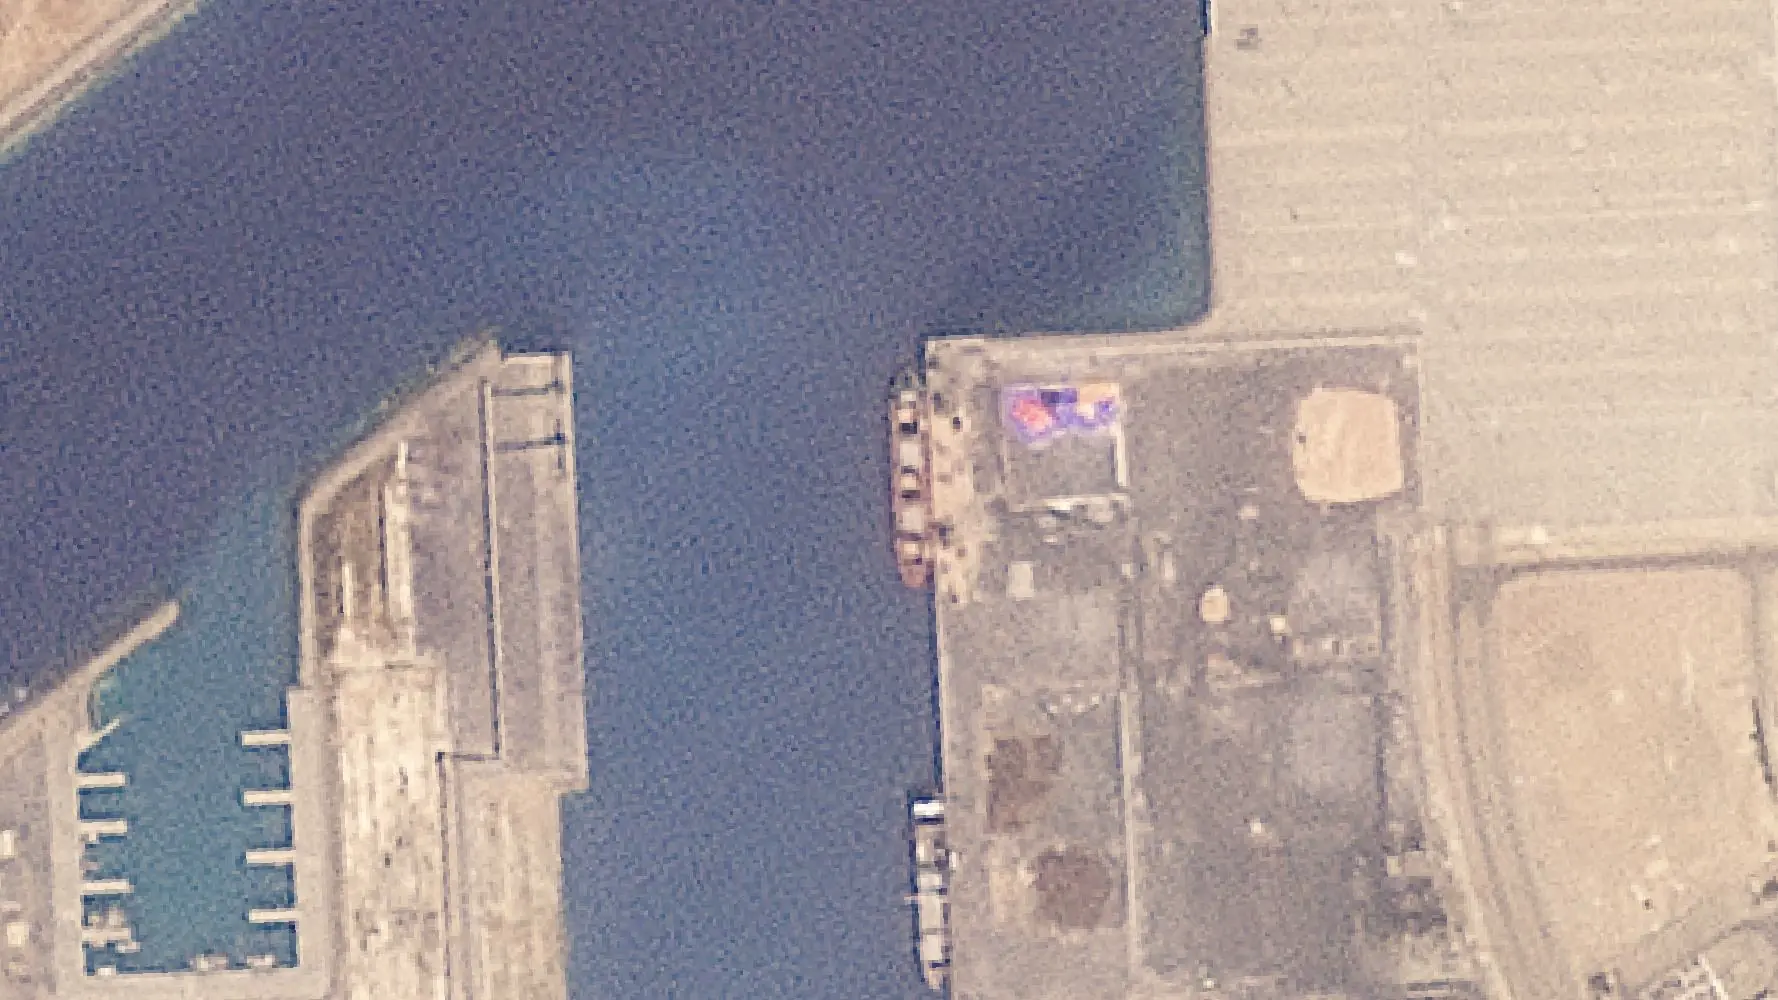
In the below example at Al Udeid Air Base in Qatar, which hosts U.S. Central Command’s Combined Air Operations Center, there is a notable indication of damage over a warehouse-like building at 25.115647, 51.333125. Checking the same location in Sentinel-2 imagery shows that there does appear to be damage at that warehouse — represented by a large blackened area on the white roof. According to Qatar’s Ministry of Defense, at least one Iranian ballistic missile struck the base in early March.

Al Udeid Air Base in Qatar:

Below: Sentinel-2 comparison of February 22 and March 14.

Civilian sites struck by Iranian drones or missiles are also visible in the tool — though the damage has to be fairly large in order to be picked up. Something like damage to the sides of high rise buildings from an Iranian drone attack doesn’t readily appear in the tool. Sites that do appear are places like oil refineries, such as a fuel tank at Fujairah port in the United Arab Emirates. 

Fuel tanks at Fujairah Port, UAE:

Below: Sentinel-2 comparison of March 3 and March 28.

Accessing the Tool

It’s important to keep in mind that the data for the Iran Conflict Damage Proxy Map is updated approximately one or two times per week as new satellite data is collected by the Sentinel-1 satellite, so it’s not meant to be a representation of real-time damage to buildings. 

Still, it can be useful for researchers to quickly gain an overview of damage throughout Iran and the Gulf where suspected strikes may have taken place and when there is no other open source information available.

You can access the Iran Conflict Damage Proxy Map here.

Similar tools using the same methodology to assess damage in Ukraine following Russia’s full-scale invasion and Turkey following the 2023 earthquake can be found here. The Gaza Damage Proxy Map can be found here


Bellingcat’s Logan Williams contributed to this report.

This article was updated on April 7, 2026, to note that Sentinel-1 and Sentinel-2 are part of the Copernicus mission developed and operated by the European Space Agency.

Bellingcat is a non-profit and the ability to carry out our work is dependent on the kind support of individual donors. If you would like to support our work, you can do so here. You can also subscribe to our Patreon channel here. Subscribe to our Newsletter and follow us on Bluesky here, Instagram here, Reddit here and YouTube here.

The post When Satellite Imagery Goes Dark: New Tool Shows Damage in Iran and the Gulf appeared first on bellingcat.

Russia’s Smuggled Grain Finds New Market in Saudi Arabia

A joint investigation by Bellingcat and Lloyd’s List has identified Saudi Arabia as the newest country to import grain directly from a Western-sanctioned port in occupied Crimea, as Russia attempts to secure recognition of the Ukrainian territory via a US-led peace plan.

Satellite imagery and Automated Identification System (AIS) data from Lloyd’s List Intelligence shows the bulk carrier Krasnodar (IMO: 9296781) sailed from Avlita Grain Terminal in Sevastopol to Saudi Arabia on two occasions between September and November 2025. Bellingcat confirmed Krasnodar’s journeys ended at Saudi Arabia’s King Abdullah Port in September and the Port of Jazan in November.

These journeys show that Saudi Arabia has joined buyers in Iran, Syria, Egypt, Turkey, Venezuela and Houthi-controlled territories in Yemen who are willing to accept what the Ukrainian government describes as “stolen” grain. 

MapLibre | Protomaps© OpenStreetMap contributors

Black Sea

Krasnodar goes dark – an AIS gap lasting more than two weeks begins on August 22.

Occupied Crimea: Port of Sevastopol

Imagery shows Krasnodar docked at Berth 21 of the Avlita grain terminal at the Port of Sevastopol on August 27.

Credit: Planet Labs PBC

Black Sea

Krasnodar turns its AIS back on in the Black Sea, as required to transit the Bosphorus on September 6.

Bosphorus Strait

Krasnodar transits the Bosphorus. Judging by the draft, with no visible red paint on its hull, the ship appears to be fully laden.

Credit: Yörük Işık

Saudi Arabia: King Abdullah Port

Imagery (as well as AIS data) shows Krasnodar docked at the King Abdullah Port. A pile of what appears to be grain is visible to the right of the image on September 18.

Credit: Planet Labs PBC

Bosphorus Strait

Returning via the Suez Canal, Krasnodar transits through the Bosphorus on September 28 with its red paint fully visible, indicating it is not heavily laden.

Credit: Yörük Işık

Black Sea

Krasnodar goes dark – an AIS gap lasting more than one week begins on October 6.

Occupied Crimea: Port of Sevastopol

Satellite imagery shows Krasnodar docked, with its hatches open, at Berth 21 of the Avlita grain terminal on October 8.

Satellite image ©2025 Vantor

Black Sea

Krasnodar turns its AIS back on in the Kerch strait. After a few days loitering in the Kerch strait, it transits through the Bosphorus.

Bosphorus Strait

With no red paint visible and the Plimsoll line near maximum draft, the vessel appears to be fully laden when it transits the Bosphorus on October 26.

Credit: Yörük Işık

Saudi Arabia: Jazan City

AIS data shows Krasnodar docked at Jazan City for Primary and Downstream Industries for seven days. Planet imagery captured it on November 6.

Credit: Planet Labs PBC

After leaving Jazan, Krasnodar returned to the Black Sea via the Bosphorus on November 23.

It stopped transmitting AIS for a third time on November 24 for nine days and has been intermittently transmitting data since.

Krasnodar was again captured in satellite imagery docked at the Avlita terminal in Sevastopol on November 26. 

Krasnodar captured in satellite imagery docked at the Avlita terminal in Sevastopol on November 26. Credit: Planet Labs PBC

Petrokhleb-Kuban Denies Visiting Avlita Terminal

Documents accessed on Russia’s federal registry indicate the vessel is leased by Russian firm Petrokhleb-Kuban, a major player in Russian and international grain markets. 

Petrokhleb Kuban told Bellingcat it “categorically denies any allegations of involvement in the theft of grain from Ukrainian regions”.

It added that Petrokhleb-Kuban does not export grain from the Avlita terminal to any country.

“Petrokhleb-Kuban does not operate at the port of Avlita and does not ship grain from there. All grain shipped by Petrokhleb-Kuban is produced by Russian farmers,” a spokesperson said. 

“The vessel Krasnodar follows all widely accepted safety protocols and does not disable its AIS while on passage. The AIS signal in the Black Sea is being jammed by the military due to the ongoing conflict between Russia and Ukraine.”

The spokesperson also said the vessel Krasnodar was loading barley at the port of Kavkaz, “as confirmed by bills of lading and port clearance.”

AIS interference is rampant in the Black Sea, however, instances of jamming typically do not last more than a couple of days. Further, third-party disruptions impact all vessels in one area indiscriminately. 

Bellingcat reviewed the AIS traces of vessels sailing near Krasnodar. In both voyages, Krasnodar was the only vessel in that area that stopped transmitting AIS data for that period of time.  

Bellingcat also checked available Planet Labs PBC and Sentinel-2 satellite imagery covering the grain terminal in Port Kavkaz during the two periods of August and October where Krasnodar has absent or unreliable AIS coverage and found no vessels matching the length of the Krasnodar.

Bellingcat identified Krasnodar in Avlita terminal on three occasions, by cross referencing satellite images of Krasnodar and recent images and video of the ship. Krasnodar was last detected at Avlita terminal in satellite imagery on November 26, again with its AIS switched off.  Krasnodar’s chimney is navy blue in colour, except for a white band on the left, right, and front side of the chimney. The ship’s other features – five grey hatches, four grey cranes, a red deck, a green floor on the bridge, all visually match known images of the ship.

Finally, the ship’s measurements (a total length of 183 metre according to Russia’s shipping registry) matches what we see in satellite images.

Visual Comparison: Images of Krasnodar at Avlita Terminal and other recent images of Krasnodar

The Krasnodar has a dark blue (midnight navy blue) chimney with a white band that runs around the sides and the front of the chimney, leaving the back completely blue.

A close up of the Krasnodar photographed in the Bosphorus on October 26, 2025. Credit: Yörük Işık.

The life boats are immediately to the left and right of the bridge. The boats can also be seen in satellite imagery from Saudi Arabia. The image below shows Krasnodar in Jazan.

Krasnodar seen in Satellite Image at the Port of Jazan, Saudi Arabia on November 6, 2025. Credit: Planet Labs PBC.

Satellite imagery also clearly shows the colour of deck (dull red), the floor colour of the bridge (green), the colour of the hatches and the cranes (grey). All of that, as well as the chimney (navy blue with white) can be matched with satellite imagery from Sevastopol that show Krasnodar docked at the Avlita grain terminal.

Left: Krasnodar seen in Satellite Image at the Port of Jazan, Saudi Arabia on November 6, 2025. Right: Krasnodar seen in Satellite Image docked at Avlita grain terminal in the Port of Sevastopol on October 8, 2025. Credits: Planet Labs PBC and 2025 Vantor.

Five grey hatches and a red deck. The image on the left is from Jazan (November 6). The image on the right is from Sevastopol (October 8).

A close up of the above images. Credits: Planet Labs PBC and 2025 Vantor.

If we zoom in on the bridge, we can also see that the shape and the colour (grey) of the top of the bridge are also a visual match. 

The chimney is not very clearly visible in the image from Jazan but it is clear that the chimney is dark in colour. The image from Sevastopol shows a dark blue chimney with a white band, which was also visible in images and video of Krasnodar.

Left: Krasnodar seen in Satellite Image docked at Avlita grain terminal in the Port of Sevastopol on October 8, 2025. Right: A close up of the Krasnodar taken in the Bosphorus on October 26, 2025. Credits: 2025 Vantor and Yörük Işık. Annotations by Bellingcat.

We see red on the hull, below the water line, in the Sevastopol satellite image. You can also see it in the image from when the ship transited the Bosphorus. The rest of the hull is dark.

Left: Krasnodar seen in Satellite Image docked at Avlita grain terminal in the Port of Sevastopol on October 8, 2025. Right: Krasnodar photographed in the Bosphorus on October 26, 2025. Credits: 2025 Vantor and Yörük Işık.

There are no live or historic sanctions on Krasnodar, according to Lloyd’s List Intelligence data.

Saudi Arabia Joins List of Importers of Russia’s Smuggled Grain


Krasnodar’s voyages from Sevastopol to Saudi Arabia demonstrate that Russia is continuing to expand its grain exports from occupied Crimea to new markets as it negotiates to end the war in Ukraine.

Crimea’s occupied ports have become important assets for Moscow, having evolved into key logistics hubs for dark grain exports over the course of the war.

Prior to the full-scale invasion of Ukraine in 2022, the ports in occupied Crimea were used for the small-scale export of grain and scrap metal, mostly to Syria and Turkey.

The occupation of additional territory in Donetsk and Zaporizhia enabled Russia to establish a new supply route, resulting in more grain being shipped south to Crimea for export to international markets.

The Port of Sevastopol and the Avlita grain terminal remain under European, UK and US sanctions. While no UN sanctions specifically target the port, a majority of UN member states have passed resolutions condemning Russia’s invasion of Ukraine and its occupation of Crimea since 2024. 

Ukraine has repeatedly tried to dissuade countries from purchasing shipments loaded with what it describes as “stolen” grain from occupied regions.

In 2023, Iran received its first grain shipments from Sevastopol. In 2024, it was joined by Venezuela, Libya, Egypt and the Houthis, which control territory in Yemen. Last month, Bellingcat revealed that the bulk carrier Irtysh (IMO: 9664976) delivered grain from the Crimean port of Sevastopol to the Houthi-controlled port of Saleef in Yemen despite Western Sanctions. 

Bellingcat and other news outlets have identified a total of eight countries that have imported grain directly from occupied Crimea.

While Saudi Arabia is the latest direct importer from Sevastopol, it is unclear if authorities are aware of the origin of the cargo. 

The grain shipments follow a similar pattern to Russia’s shadow fleet, which moves sanctioned oil barrels. In both cases steps are taken to disguise the origin of the cargo and port of loading.

Most ships calling to Crimea disable their AIS transponders, which is considered a deceptive shipping practice, and fraudulent documents are issued. 

Alona Shkrum, First Deputy Minister for Development of Communities and Territories of Ukraine, told Bellingcat that Ukraine was closely monitoring Russian exports from occupied territories. She said Ukraine had discussed the issue with Saudi Arabia on the sidelines of recent talks at the International Maritime Organisation Assembly.

She told Bellingcat that Ukraine had “received assurances that Saudi authorities are actively counteracting the risks posed by shadow fleet operations and other violations of international maritime law.” 

She added that Ukraine would continue to work with partners to identify and sanction vessels involved in the illegal export of grain from occupied territories. 

Bellingcat contacted both the Saudi Arabian Ministry of Foreign Affairs and the Russian Ministry of Foreign Affairs; neither responded to requests for comment. 

US-Russia Peace Plan and Ownership of Ukraine’s Ports


The US-Russia 28-point peace proposal includes the recognition of Crimea, Luhansk and Donetsk as “de facto” Russian. Ownership of Crimea and the occupied territories bordering the Sea of Azov is critical for securing shipping routes to and from Russia, and these ports play a vital role in supporting economic growth in the region. 

However, the impact of ceding control of this region and the port of Sevastopol to Russia is not mentioned in either the original US draft plan or subsequent amended versions.

Ian Ralby, chief executive of the maritime and resource security consultancy I.R. Consilium said while it was a high priority for Ukraine to ensure access to the grain market through the Black Sea is preserved, Russia is continuing to try to expand its global access to ports. 

“We see that there is a resurgence in Russia’s efforts on port access.”

“As the prospect of potential peace begins to loom, even though it seems to be much farther off than many would want, there is likely to be a renewed focus on the key strategic assets that matter for the future, and the ports have to be foremost among them.” 


Bridget Diakun, Yörük Işık, Youri van der Weide, Peter Barth and Galen Reich contributed to this report.

Cover image: Planet Lab image shows Krasnodar docked at Jazan City, Saudi Arabia on November 6. Credit: Planet Labs PBC.

Bellingcat is a non-profit and the ability to carry out our work is dependent on the kind support of individual donors. If you would like to support our work, you can do so here. You can also subscribe to our Patreon channel here. Subscribe to our Newsletter and follow us on Twitter here and Mastodon here.

The post Russia’s Smuggled Grain Finds New Market in Saudi Arabia appeared first on bellingcat.

Russia’s Grain Smuggling Fleet Continues Undeterred

An investigation by Bellingcat has identified yet another Russian-flagged bulk carrier, Irtysh (IMO: 9664976), operating in defiance of Western sanctions by exporting grain from occupied Crimea to Houthi-controlled Yemen. 

Following the same pattern of deceptive methods used by other vessels involved in what Ukraine describes as “grain theft,” Irtysh disabled its location tracking en route to and from the Port of Sevastopol. The vessel also made a mandatory stop in Djibouti for inspection by the United Nations Verification and Inspection Mechanism (UNVIM) for Yemen before sailing on to the Port of Saleef, Yemen. 

The majority of UN member states have repeatedly voted against Russia’s invasion of Ukraine. UNVIM told Bellingcat: “As a UN mandated body UNVIM does not have the authority to block shipments based on unilateral national or regional sanctions.” They added: “The UNVIM mandate is limited to verifying compliance with the UN Security Council resolutions related to Yemen.”

However, experts have previously highlighted to Bellingcat that even with the limitations of that remit the fact that grain shipments from occupied Ukrainian territories are passing through UN inspection mechanism creates an awkward situation.

Bellingcat mapped Irtysh’s journey by combining Automated Identification System (AIS) data from Lloyd’s List Intelligence and satellite analysis. During the investigation, two additional vessels were also identified with their tracking systems disabled while loading grain in Sevastopol: Matros Pozynich (IMO: 9573816) and Zafar (IMO: 9720263).

MapLibre | Protomaps© OpenStreetMap contributors
2025-08-07 14:27

Bosphorus Strait

With its red paint fully visible, the vessel appeared to be carrying very little cargo.

Credit: Yörük Işık

Black Sea

Irtysh went dark – an AIS gap lasting two weeks began.

Occupied Crimea: Port of Sevastopol

Imagery showed Irtysh docked with its hatches open at Berth 21 of the Avlita grain terminal.

Satellite image ©2025 Vantor

Black Sea

Returning to Turkish waters, Irtysh turned its AIS back on as required for transiting the Bosphorus.

Bosphorus Strait

With no red paint visible and the Plimsoll line near maximum draft, the vessel appeared fully laden.

Credit: Yörük Işık

Egypt: Suez Canal

Irtysh transited the man-made waterway connecting the Mediterranean to the Red Sea.

Credit: Planet Labs PBC

Port of Djibouti: UNVIM Inspection

All cargo vessels must be inspected in Djibouti before proceeding to Houthi-controlled ports. AIS data showed Irtysh anchored off Djibouti for six days.

Credit: Planet Labs PBC

Houthi-controlled Yemen: Port of Saleef

Irtysh docked at the Port of Saleef for ten days, according to imagery and AIS data.

Credit: Planet Labs PBC

Bosphorus Strait

Returning via the Suez Canal, Irtysh transited the Bosphorus with its red paint fully visible, thus was not heavily laden.

Credit: Yörük Işık

Black Sea

Another AIS blackout, echoing its outbound path.

Occupied Crimea: Port of Sevastopol

Irtysh returned to Berth 21 of the Avlita grain terminal. As of the latest available imagery, the vessel remains in Sevastopol.

Credit: Planet Labs PBC

Just over a month after Irtysh was first seen loading grain at the Port of Sevastopol, Bellingcat identified another Russian vessel, Matros Pozynich, at the same berth. Previously identified by CNN in 2022 for exporting grain from occupied Ukraine, and by Bellingcat the following year, the vessel was docked at the Avlita grain terminal on Sept. 20.

Two days later, Matros Pozynich switched its AIS back on before sailing through the Bosphorus Strait, just as Irtysh had. With its hull sitting low in the water, the vessel was photographed passing through Turkish waters seemingly fully laden.

After calling at Djibouti, likely for inspection by UNVIM, AIS data shows the bulk carrier departing for Saleef, Yemen, on Oct. 8. At time of publication, Matros Pozynich remains in anchorage off the Port of Saleef, Yemen.

Docked at Port of Sevastopol

Sept. 20, 2025

Satellite image ©2025 Vantor

Fully Laden in Bosphorus Strait

Sept. 23, 2025

Credit: Yörük Işık

At Anchor in Djibouti

Oct. 5, 2025

Credit: Planet Labs PBC

At Anchor in Port of Saleef

Oct. 14, 2025

Credit: Planet Labs PBC

A third vessel, also previously implicated for smuggling grain, Zafar, was captured by satellite imagery with its AIS turned off at the Port of Sevastopol from Sept. 23.

Avlita grain terminal, Port of Sevastopol, Sept. 23–25. Satellite image ©2025 Vantor

At the time of publication, Zafar had not sailed to Yemen via Djibouti. Instead, it was anchored off the Port of Alexandria, Egypt – another known location for offloading grain from occupied Ukraine, according to OCCRP reporting.

“Grain Theft”

Ukraine has repeatedly tried to dissuade countries from purchasing shipments loaded with what it describes as stolen grain from occupied regions

The Port of Sevastopol and the Avlita grain terminal remain under European, UK and US sanctions. While no UN sanctions specifically target the port, a majority of UN member states have passed resolutions condemning Russia’s invasion of Ukraine and of its occupation of Crimea since 2024. 

Support Bellingcat

Your donations directly contribute to our ability to publish groundbreaking investigations and uncover wrongdoing around the world.

Both Irtysh and Matros Pozynich delivered grain to the Houti-controlled Port of Saleef via Djibouti – the UNVIM inspection point for Yemen. After ten years of war, the UNHCR reports that tens of thousands of people in Yemen are living in famine-like conditions, with a further five million people experiencing food insecurity.

UNVIM confirmed to Bellingcat that the Irtysh was inspected “in line with UNVIM operational protocols” on Sept. 7 and cleared by the Saudi-led coalition Evacuation and Humanitarian Operations Cell (EHOC) – a body entirely separate from the UN – on Sept. 8.

Asked whether UNVIM was aware the vessel had picked up grain from a port under Western sanctions, the agency replied: “The UNVIM mandate is limited to verifying compliance with the UN Security Council resolutions related to Yemen. Unilateral national sanctions or measures beyond that scope are outside the UNVIM mandate.”

Neither the Russian government nor its foreign ministry responded to requests for comment.


Yörük Işık, Bridget Diakun, Peter Barth, Galen Reich, Claire Press and Merel Zoet contributed to this report.

Bellingcat is a non-profit and the ability to carry out our work is dependent on the kind support of individual donors. If you would like to support our work, you can do so here. You can also subscribe to our Patreon channel here. Subscribe to our Newsletter and follow us on Twitter here and Mastodon here.

The post Russia’s Grain Smuggling Fleet Continues Undeterred appeared first on bellingcat.

What Can Open Sources Reveal About Beijing’s Deadly Floods?

Earlier this week, the Beijing authorities placed all 16 of its districts on high alert in anticipation of torrential rain. More than 40 people have since been confirmed dead, and 80,000 evacuated citywide due to the floods. 

But what can open source data tell us about the damage caused?

Satellite imagery has allowed us to track the impact on both urban and rural areas. On social media, however, a deluge of AI-generated fakes have continued to draw far more views than many genuine eyewitness videos.

“Gaps” in the city’s readiness

In northeast Beijing, near the largest reservoir in northern China, the highest death toll was recorded in the town of Taishitun. Thirty-one of the confirmed fatalities were from an elderly care home situated near the banks of the Qingshui River, which runs through the town.

Taishitun Village, Miyun District, Beijing. Compares 18/07/2025 to 30/07/2025. Credit: Planet.

Yu Weiguo, a Communist Party secretary for the Miyun District, which includes Taishitun, said at a press conference that there were “gaps” in the city’s readiness.

“Our knowledge of extreme weather was lacking. This tragic lesson has warned us that putting the people first, putting human life first, is more than a slogan,” Yu said.

A loss of food and farmland

Across Hebei Province, which neighbours Beijing, agricultural land was also heavily affected. In Jiuying Village, more than 1,300 hectares of farmland, much of it low-lying cornfields, was submerged, according to Reuters. Satellite data from the area north and east of Jiuying Village shows the scale of the flash floods.

Jiuying Village, Hebei Province. Compares 17/07/2025 to 30/07/2025. Credit: Planet.

Zooming out even further, Copernicus’ False Colour (Urban) band shows flooded areas in dark blue, highlighting the impact across Hebei Province.

Copernicus’ False Colour (Urban) band shows flooded farmland across Hebei Province in blue. Credit: Copernicus.

A deluge of AI on Youtube

Yet on other open platforms, such as social media and video sharing sites, the picture became complicated by accounts posting mis-and-disinformation.

Searching in English, the results for #beijingflood on YouTube Shorts revealed multiple AI-generated thumbnails, one of which surpassed 18 million views. Meanwhile, shorts containing real footage struggled to climb past 1,000 views. 

Top five results with the highest views for #beijingflood were all AI generated videos. Credit: YouTube.

All five of the top results carried the hallmarks of AI generated content: cars randomly appearing and disappearing, disproportionately sized objects, and overly dramatised scenes lasting only a few seconds.  

On Facebook, when searching for “Beijing flood,” multiple AI-generated fake posts claimed actor Jackie Chan had died in the floods. Using AI-generated photos of Chan lying in a hospital bed or a casket, these posts collectively gathered more than 150,000 likes.

Credit: Facebook

By comparison, Chinese social media platforms, including Baidu’s Haokan Video, Weibo and Douyin appeared to display very few AI-generated videos. Instead, the vast majority appeared to be genuine posts documenting the real-world impact of the floods.

Montage of videos found on Haokan and geolocated by Bellingcat to several districts in Beijing.

In an attempt to verify a sample of what we were seeing, Bellingcat geolocated several videos. Note that Google and Baidu use different coordinate systems. We identified any landmarks in Baidu Maps, before finalising our geolocations in Google Earth Pro.

One video showed a series of clips, including one of a bulldozer driving along a flooded road with two rescue boats in tow. This footage was geolocated to the People’s Government office in Taishitun Town.

The two buildings in the background, along with the trees, bushes, fence and entrance, can all be matched to the government office in Taishitun. Credit: Bellingcat.

Later, in another clip from the same video, a bulldozer can be seen, again not far from the Taishitun government office

The red roof, blue roof, and four-storey building, as well as the trees and streets, all matched the same location near to the Taishitun government office. Credit: Bellingcat.

Another video, posted on Haokan, showing a destroyed bridge was geolocated east of Bulaotun Village. The collapsed bridge can also be seen in Planet imagery from 30 July.

The power line, road sign, surrounding metal frame, billboard and trees all match details in the satellite image, bottom left. Bottom right, PlanetScope imagery from 30 July shows the river engulfing the bridge. Credit: Bellingcat.

Whilst searching Chinese social media platforms, some recycled footage from past floods could be seen. For example, on Douyin, the Chinese version of TikTok, one of the top results when searching for “Beijing flood” was a video from 2021 showing a mudslide in Japan where buildings and trees were engulfed.

Bellingcat reached out to the Beijing Municipal People’s Government for comment but did not receive a reply at the time of publication.

The post What Can Open Sources Reveal About Beijing’s Deadly Floods? appeared first on bellingcat.

❌