The UK NCSC warns of rising cyberattacks on operational technology, urging organizations to secure internet-exposed industrial systems against physical disruptions.
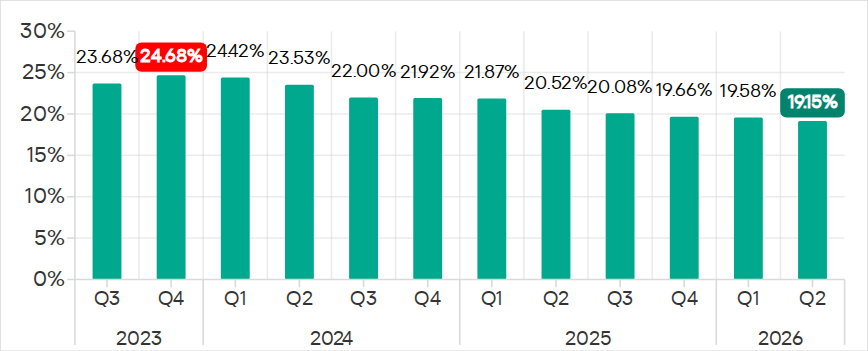
In Q2 2026, the percentage of ICS computers on which malicious objects were blocked continued to decrease, falling to 19.15%, its lowest level since 2022.
Percentage of ICS computers on which malicious objects were blocked, Q3 2023–Q2 2026
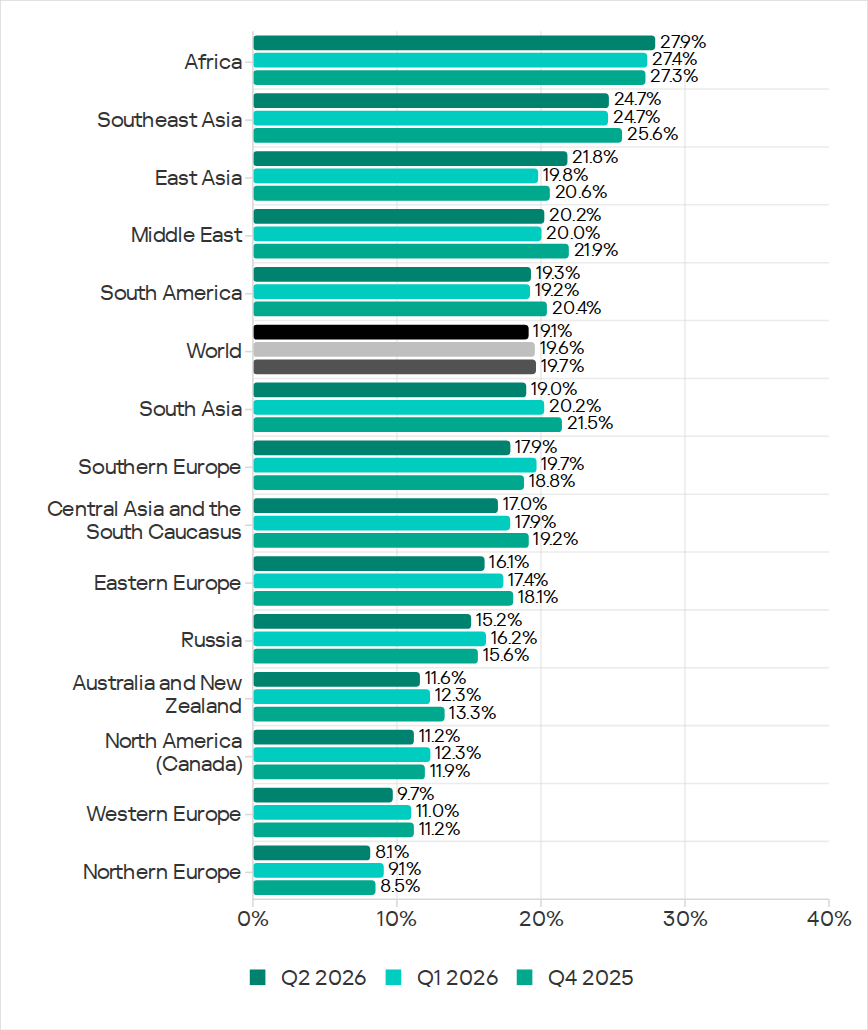
Regionally, the percentages ranged from 8.1% in Northern Europe to 27.9% in Africa.
Regions ranked by percentage of attacked ICS computers
The figures increased in five regions over the quarter, most notably in East Asia (by 2.0 pp) and Africa (by 0.5 pp).
East Asia saw increases in percentages for all threats except miners. The region ranked first in terms of growth for malicious scripts and phishing pages, spyware, and viruses. East Asia also led in terms of growth in threats from the internet. The percentage of ICS computers on which email threats were blocked also increased.
Selected industries
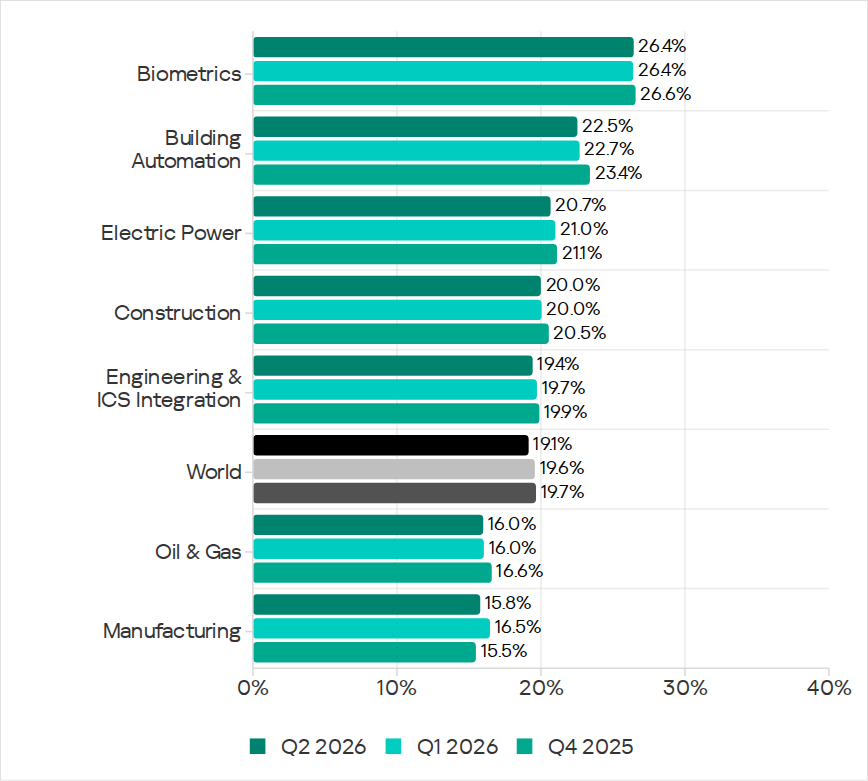
The biometrics sector (26.44%) has traditionally led the rankings of industries and OT infrastructures surveyed in this report in terms of the percentage of ICS computers on which malicious objects were blocked. Biometric systems are characterized by the availability of internet access, extensive email use for data exchange and approvals (e.g. access granting), and, in many cases, minimal cybersecurity controls within the organizations that use them.
Industries ranked by percentage of ICS computers on which malicious objects were blocked
The biometrics sector ranked first among industries in terms of the following threat categories: malicious scripts and phishing pages, malicious documents, spyware, ransomware, and worms. The sector is also leading among industries in terms of email threats. At the same time, unlike other industries, the percentage of affected ICS computers for email threats in biometrics exceeds that for internet threats.
In all selected industries, the global average follows a downward trend.
Threat categories
In Q2 2026, Kaspersky security solutions blocked malware from 10,904 different malware families of various categories on industrial automation systems.
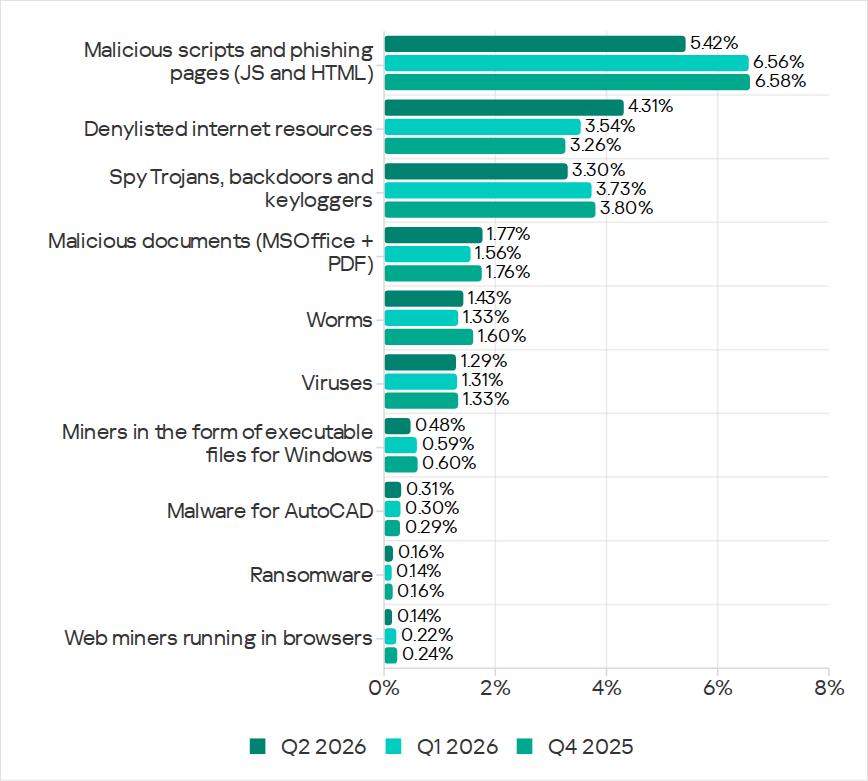
Over the quarter, the percentage of ICS computers on which malicious objects of the following categories were blocked increased: denylisted internet resources, malicious documents, worms, ransomware, and malware for AutoCAD.
Percentage of ICS computers on which the activity of malicious objects from various categories was blocked
Malicious scripts and phishing pages (JS and HTML)
Malicious scripts and phishing pages remained in first place in the threat category rankings based on the percentage of ICS computers on which the respective threats were blocked. In Q2 2026, the global average dropped to 5.42%.
Over the quarter, the figure for this category only increased in East Asia, rising by 0.93 pp to 4.86%. This is the second-highest figure in the region in the last three years.
In East Asia, the percentage of ICS computers affected by malicious scripts and phishing pages increased in all the industries surveyed, except construction. The highest figures were recorded for biometrics (9.01%) and building automation (6.49%).
Denylisted internet resources
In Q2 2026, denylisted internet resources rose in the threat category rankings from third to second place, displacing spyware. Globally, the percentage of ICS computers on which denylisted internet resources were blocked has been increasing for two quarters in row and reached 4.31%.
The figures increased in all regions over the quarter, most notably in Russia (by 1.33 pp). Moreover, Russia ranked first (5.17%) among the regions in terms of denylisted internet resources. Since 2022, the region has topped these rankings twice before, both times in Q2: in 2022 and 2024.
Among the selected industries in Russia, the highest figures for the denylisted internet resources were in the electric power (6.61%) and engineering and ICS integration (5.62%) industries.
Malicious documents (MSOffice + PDF)
Malicious documents ranked fourth in the threat category rankings by the percentage of ICS computers on which they were blocked. The percentage for this category decreased over the previous three quarters, reaching its lowest level in three years. However, in Q2 2026, it increased to 1.77%.
Over the quarter, the figures for malicious documents increased in seven regions, most notably in South America (by 1.35 pp) and Southern Europe (by 0.48 pp). These two regions are among the top three in terms of malicious documents, malicious scripts and phishing pages, as well as threats from email clients.
South America ranked second in the rankings of regions in terms of malicious documents. In Q2 2026, the percentage of ICS computers in the region on which this threat was blocked was 3.56%, which was the fourth highest in three years.
Among the selected industries in South America, the highest percentage of ICS computers on which malicious documents were blocked was in biometrics (6.67%).
Southern Europe ranked first in the rankings of regions in terms of malicious documents. In the previous quarter, the percentage of ICS computers in the region on which this threat was blocked was the lowest in three years, but in Q2 2026 it increased to 3.63%.
Among the selected industries in Southern Europe, the highest percentage of ICS computers on which malicious documents were blocked was once again in biometrics (11.48%).
Spyware
Spyware ranked third in the threat category rankings based on the percentage of ICS computers on which it was blocked. The percentage for this category (3.30%) is the lowest since 2022.
Over the quarter, the figures increased in three regions, most notably in East Asia (by 0.53 pp) and Southeast Asia (by 0.42 pp).
East Asia ranked third based on the figures for spyware (4.77%), behind Africa and Southeast Asia. This is the region’s highest rate since Q2 2025. Among the countries and territories in the region, the highest percentage of ICS computers on which spyware was blocked was in mainland China (6.61%). Among the selected industries in East Asia, the highest figures for spyware were in the electric power (11.75%) and manufacturing (5.87%) industries. In all the industries surveyed, the figures are higher than the regional average.
Southeast Asia ranked second after Africa in the ranking of regions in terms of spyware, with 5.32%. Among the selected industries in Southeast Asia, the highest figures for spyware were in biometrics (8.93%) and manufacturing (7.32%). The figures increased in all industries over the quarter.
Ransomware
The percentage of ICS computers on which ransomware was blocked decreased in the previous three quarters but increased to 0.16% in Q2 2026.
During the quarter, the percentage increased in all regions, except Western and Southern Europe and North America (Canada). Africa led the ranking in terms of growth for this metric.
In Q2 2026, Africa ranked first among the regions in terms of the percentage of ICS computers on which ransomware was blocked (0.29%). The only time the figure in the region was higher in the past three years was Q2 2025 (0.31%).
Among the selected industries in Africa, the highest figures for ransomware were in the electric power industry (0.72%) and biometrics (0.52%). Over the quarter, the figures increased in all industries, except manufacturing and construction. The biggest increase was recorded in the electric power industry.
In Russia, the percentage of ICS computers on which ransomware was blocked in biometric systems has increased for three consecutive quarters, reaching 1.22%. This is the highest level of ransomware across all industries in all regions.
Miners
In Q2 2026, the percentage of ICS computers on which miners were blocked was the lowest since 2021, for both miners in the form of executable files for Windows (0.48%) and web miners running in browsers (0.14%).
The figures for both categories decreased in all regions, except for Africa where figures for miners in the form of executable files for Windows increased slightly.
On average, the oil and gas industry led the rankings among the selected industries both in terms of miners in the form of executable files for the Windows OS (0.66%) and in terms of web miners (0.34%).
Worms
In Q2 2026, the percentage of ICS computers on which worms were blocked increased to 1.43%.
In Q2 2026, the Middle East (2.11%) was second (after Africa) in the rankings of regions in terms of worms, displacing Central Asia and the South Caucasus.
Among the selected industries in the Middle East, the highest percentage of ICS computers on which worms were blocked was in building automation (2.90%). Over the quarter, the figures increased in all industries.
Australia and New Zealand ranked 12th among the regions in terms of the percentage of ICS computers on which worms were blocked (0.41%). Over the past three years, the figure in this region was only higher in Q2 2024 (0.42%). The figures increased in all the surveyed industries in the region, most notably in manufacturing and electric power. As a result, for these industries they exceeded the regional average by 2.9 and 2.3 times, respectively.
Viruses
In Q2 2026, the percentage of ICS computers on which viruses were blocked decreased to 1.29%.
The top three regions for this metric remain unchanged: Southeast Asia (6.03%), Africa (4.22%), and East Asia (3.14%). These same regions lead the rankings in terms of malware for AutoCAD.
The figures increased in three regions: East Asia, Australia and New Zealand, and Africa, where it has been growing for four consecutive quarters and reached its highest value since 2022.
Among the selected industries in Africa, the highest percentage of ICS computers on which viruses were blocked was in construction (5.47%).
East Asia ranked third among the regions in terms of viruses, reaching the highest level in the region for the past three years. Among the countries and administrative regions of East Asia, mainland China is the clear leader in terms of viruses (5.07%).
Among the selected industries in East Asia, the highest percentage of ICS computers on which viruses were blocked was in construction (5.93%).
In Australia and New Zealand, the increase in the percentage of ICS computers on which viruses were blocked was primarily due to a 4.3-fold increase in the figure for the electric power industry: from 0.29% to 1.24%. For a region where the percentage of attacked ICS computers for all threats is 0.12%, this is a very high value.
Malware for AutoCAD
In Q2 2026, the percentage of ICS computers on which malware for AutoCAD was blocked increased to 0.31%.
The most notable increase over the quarter was observed in Africa. After more than doubling in the previous quarter, the figure for the region continued to rise (although not so dramatically), reaching 1.02%.
Among the selected industries across all regions, the highest percentage of ICS computers on which malware for AutoCAD was blocked was in construction in East Asia (6.38%) and in Southeast Asia (4.05%).
Main threat sources
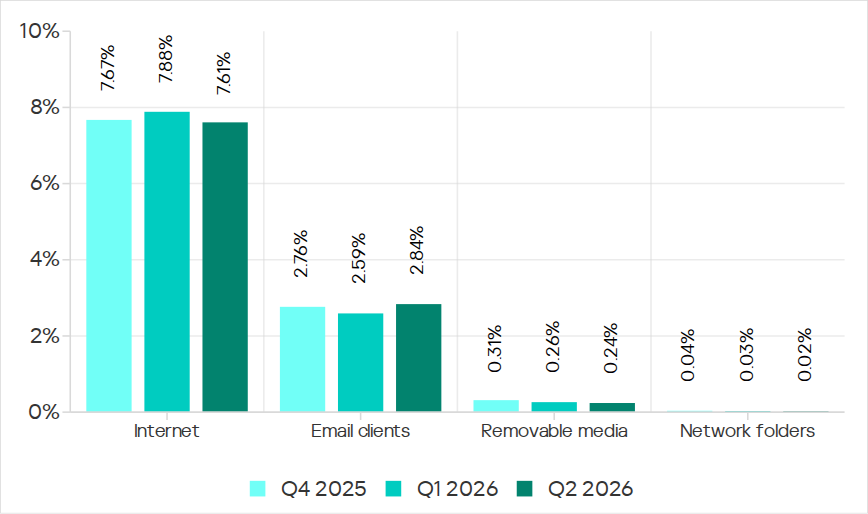
In Q2 2026, of all the threat sources, the percentage increased only for email.
Percentage of ICS computers on which malicious objects from various sources were blocked
Internet
The percentage of ICS computers on which threats from the internet were blocked decreased to 7.61%, reaching its lowest level since 2021.
Over the quarter, the percentage increased in three regions: East Asia by 0.8 pp (to 6.3%), South Asia by 0.3 pp (to 10.4%), and Russia by 0.3 pp (to 6.4%).
Among the selected industries across all regions, the highest percentage of ICS computers on which threats from the internet were blocked was in biometrics (13.03%) and engineering and ICS integration (12.16%) in South Asia.
Email
The percentage of ICS computers on which email threats were blocked increased to 2.84%.
In Q2 2026, the percentage of ICS computers on which email threats were blocked increased in South America by 1.0 pp (to 5.2%) and in Africa by 0.7 pp (to 4.3%).
Among the selected industries across all regions, the highest percentage of ICS computers on which email threats were blocked was in biometrics (19.14%) and building automation (12.49%) in Southern Europe.
Removable media
The percentage of ICS computers on which threats from removable media were blocked continued to decrease, reaching 0.24%, the lowest value for the period under review.
Among the selected industries across all regions, the highest percentage of ICS computers on which threats from removable media were blocked was in the electric power industry in East Asia (1.34%) and biometrics in Africa (1.29%).
Network folders
The percentage of ICS computers on which threats from network folders were blocked continued to decrease. In Q2 2026, it was the lowest for the period under review, at 0.023%.
The only region to see an increase in the percentage of ICS computers on which threats from network folders were blocked during the quarter was Africa. This was mainly due to an increase in the building automation figure to 0.05%.
Among the selected industries across all regions, the highest percentage of ICS computers on which threats from network folders were blocked was in biometrics (0.23%), building automation (0.17%), and engineering and ICS integration (0.13%) in East Asia.
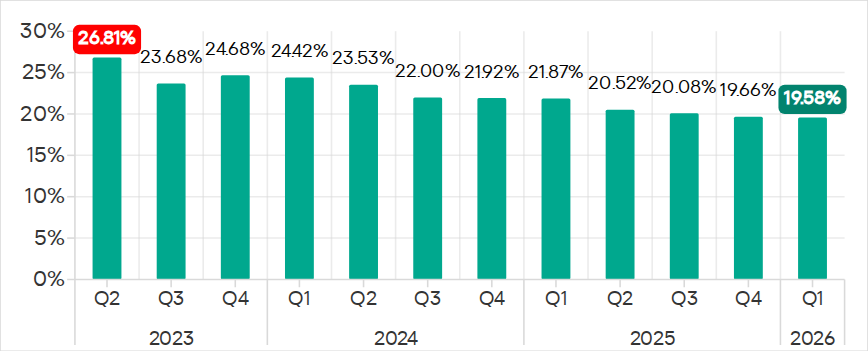
The percentage of ICS computers on which malicious objects were blocked continued to decrease, reaching 19.6% in Q1 2026. This is the lowest value in three years, and it is 1.4 times lower than in Q2 2023.
Percentage of ICS computers on which malicious objects were blocked, Q2 2023–Q1 2026
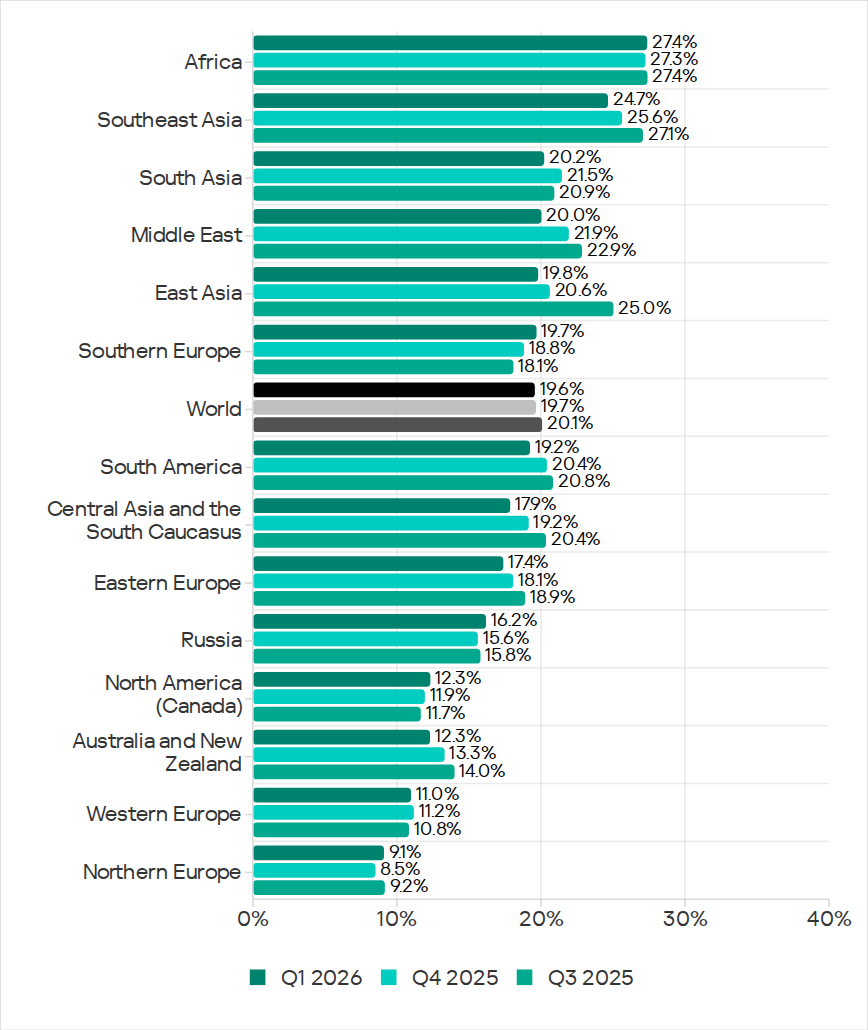
Regionally, the percentages ranged from 9.1% in Northern Europe to 27.4% in Africa.
Regions ranked by percentage of attacked ICS computers
The percentage of ICS computers on which malicious objects were blocked increased in five regions over the quarter, most notably in Southern Europe, Northern Europe, and Russia.
In Q1 2026, Southern Europe led the way in growth for internet and email threats. The region also saw the fastest growth in spyware, as well as malicious scripts and phishing pages.
In Russia, the percentage of ICS computers on which malicious objects were blocked exceeded the figures for the previous two quarters. Russia saw an increase in the percentage for threats from the internet, and a slight increase in the figure for threats from email clients (Russia is one of three regions where this figure did not decrease).
Among the threat categories, the greatest increases were observed in the percentages for denylisted internet resources, as well as spyware (distributed in the region via the internet and email clients).
Selected industries
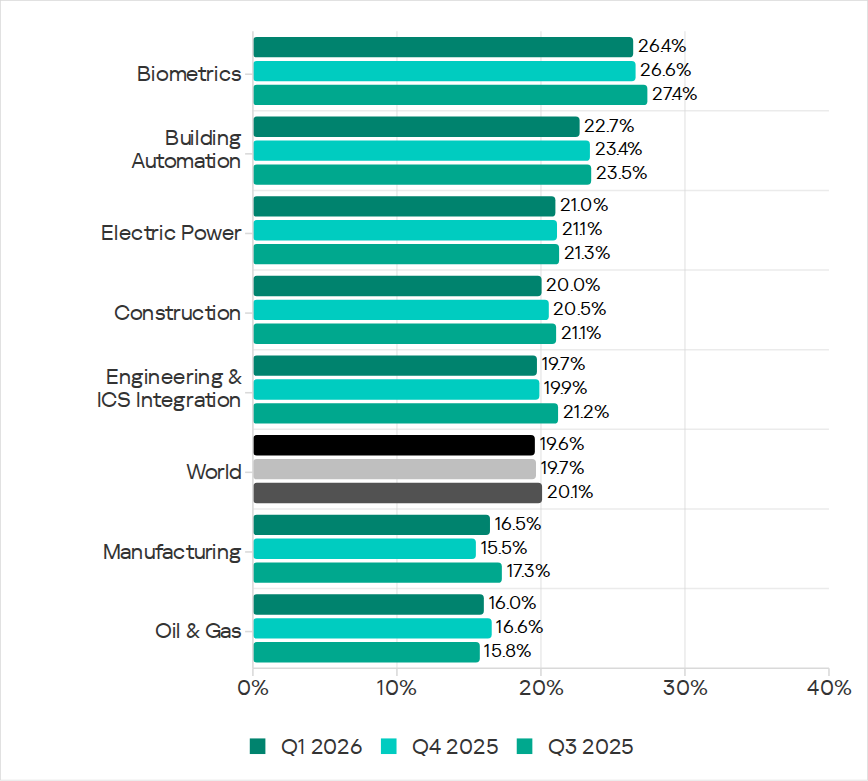
Biometric systems (26.4%) traditionally rank top among the industries and OT infrastructure types covered in this report in terms of the percentage of ICS computers on which malicious objects were blocked. These systems are characterized by internet access, extensive email use for data exchange and approvals (such as access granting), and, in many cases, minimal cybersecurity controls within the organizations that use these systems.
Industries ranked by the percentage of ICS computers on which malicious objects were blocked
Biometric systems rank first among industries in terms of email threats. At the same time, unlike other industries, the percentage for email threats in biometric systems exceeds that for internet threats.
In all selected industries, the global average follows a downward trend. In Q1 2026, the percentage of ICS computers on which malicious objects were blocked increased only in the manufacturing sector — by 1.0 pp. The percentages for this industry increased across 10 regions, with the most notable increases in Western Europe, Northern Europe, and Russia.
Threat categories
In Q1 2026, Kaspersky security solutions blocked malware from 10,052 different malware families of various categories on industrial automation systems.
Over the quarter, the percentage of ICS computers on which denylisted internet resources were blocked increased (after decreasing over the previous two quarters), and there was a slight increase in the percentage for AutoCAD malware.
Percentage of ICS computers on which the activity of malicious objects from various categories was prevented
Malicious scripts and phishing pages (JS and HTML)
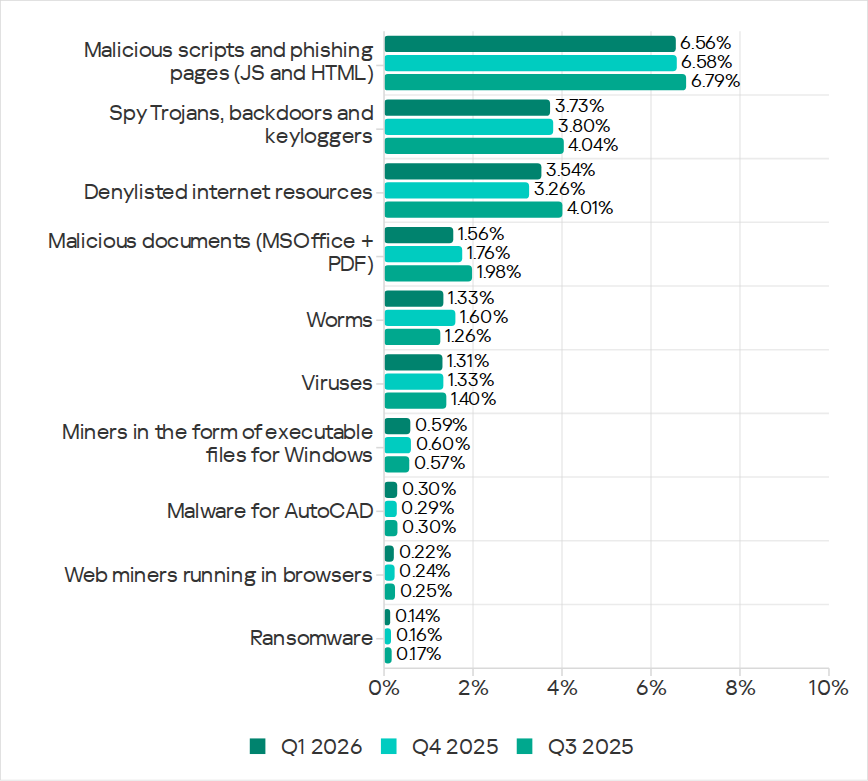
Malicious scripts and phishing pages retained their to spot among threat categories by the percentage of ICS computers on which these threats were blocked. The global average in Q1 2026 was 6.56%.
Over the quarter, the percentages increased in four regions. The most significant change was observed in Southern Europe (9.85%, +0.94 pp). The figures for malicious scripts in the region increased over three consecutive quarters.
Among the selected industries, across all regions, the highest percentages for the malicious scripts and phishing pages category were recorded for biometric systems (19.59%) and building automation (15.43%) in Southern Europe. These same industries lead in similar rankings for malicious documents and spyware.
Spyware
The percentage of ICS computers on which spyware was blocked decreased over two consecutive quarters, dropping to 3.73%. Despite the decline, spyware has ranked second among threat categories by the percentage of attacked computers for three consecutive quarters.
The percentages increased in five regions over the quarter, most notably in Southern Europe (5.46%, +0.35 pp) and Russia (2.84%, +0.24 pp).
In Southern Europe, the percentage of ICS computers on which spyware was blocked increased in all the selected industries except manufacturing. The greatest increase was observed in biometric systems.
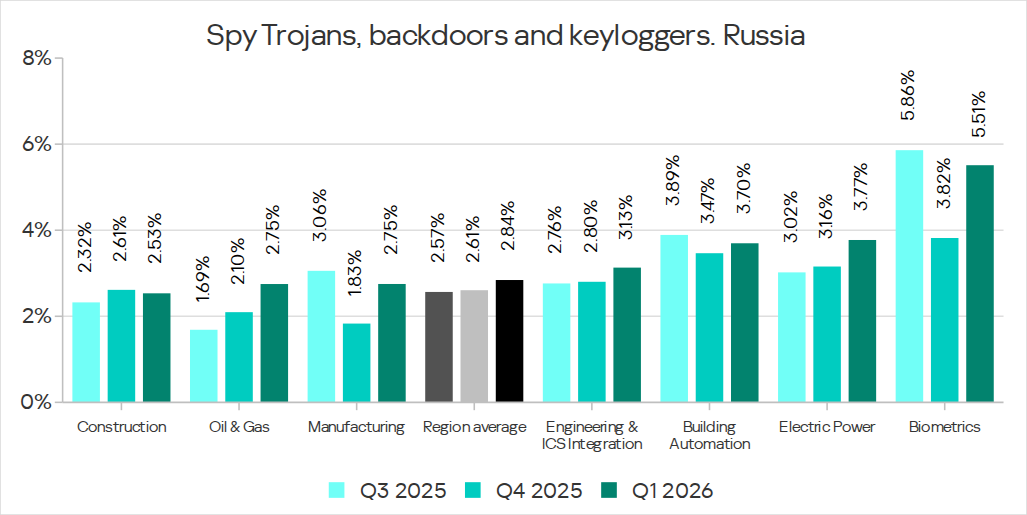
Among the selected industries, the highest percentage of spyware in Russia was recorded in biometric systems. That said, the percentage of ICS computers on which spyware was blocked increased in all industries in the region except construction. The percentage figure has been increasing for two consecutive quarters in the oil and gas industry (by a factor of 1.63 over six months), and for three consecutive quarters in engineering and ICS integration, as well as electric power. In the remaining sectors, the values have been fluctuating.
Percentage of ICS computers on which spyware was blocked in various industries in Russia, Q3 2025–Q1 2026
Denylisted internet resources
The percentage of ICS computers on which denylisted internet resources were blocked increased to 3.54%.
The most notable increase over the quarter occurred in Southeast Asia (4.58%, +0.65 pp). Among the industries in the region, the highest percentage figures for this threat category were recorded in electric power and construction. Over the quarter, the largest increases in percentages figures were observed in the electric power and manufacturing industries.
In North America (Canada), denylisted internet resources (2.14%) showed the greatest increase among all categories — by a factor of 1.22.
Among the selected industries across all regions, the highest percentage figures for the denylisted internet resources category were in the electric power (7.11%) and construction (6.25%) industries in Southeast Asia.
Malicious documents (Microsoft Office + PDF)
The percentage figure for this category decreased over two consecutive quarters, reaching its lowest value (1.56%) for the entire period of observations in Q1 2026. It increased just in two regions: Australia and New Zealand (1.12%, +0.04 pp), and Russia (0.62%, +0.01 pp).
Among the selected industries across all regions, the highest percentages for malicious documents were recorded for biometric systems (9.02%) and building automation (6.97%) in Southern Europe. These same industries also lead in similar rankings for malicious scripts and spyware.
Ransomware
The percentage of ICS computers on which ransomware was blocked has decreased for two consecutive quarters, dropping to 0.14%. This is the lowest value among all categories.
The percentage increased in two regions: North America (Canada) (0.11%, +0.04 pp) and slightly in Northern Europe (0.06%, +0.01 pp).
Among the selected industries across all regions, the highest percentages for ransomware were recorded in the oil and gas and manufacturing industries (0.92% and 0.65%, respectively) in Central Asia and the South Caucasus, and in biometric systems (0.89%) in Russia.
Miners in the form of executable files for Windows
The percentage of ICS computers on which miners in the form of executable files for Windows were blocked decreased to 0.59%.
The percentage increased in seven regions. The largest increase was observed in Africa (0.63%, +0.16 pp). Among the selected industries, the largest increases in the region were in the manufacturing and oil and gas industries.
Among the selected industries across all regions, the highest percentages for miners in the form of executable files were recorded in construction (1.99%), biometric systems (1.98%), and the oil and gas industry (1.97%) in Central Asia and the South Caucasus.
Web miners
The percentage of ICS computers on which web miners were blocked has been declining for a year, and in Q1 2026, it reached the lowest value for the entire period under review (0.22%).
At the same time, the percentage increased in seven regions. The largest increases were observed in South Asia (0.28%, +0.11 pp), the Middle East (0.31%, +0.09 pp), and Africa (0.34%, +0.08 pp). Despite the increases, the percentages in these regions for Q1 2026 did not exceed those observed in 2023–2024 and in Q1 2025.
Among the selected industries across all regions, the highest percentages for web miners were recorded for biometric systems (0.97%) in Russia. Biometric systems in South Asia (0.79%) ranked second, and the electric power sector in Southeast Asia (0.76%) ranked third.
Worms
The percentage of ICS computers on which worms were blocked decreased to 1.33%.
The percentage decreased across all regions following an increase in the previous quarter (due to a wave of phishing attacks that distributed the Backdoor.MSIL.XWorm backdoor worm across all regions of the world).
Among the selected industries across all regions, the highest percentage figure for worms was recorded for biometric systems (4.80%) in Central Asia and the South Caucasus. Two industries in Africa – biometric systems (4.04%) and electric power (3.53%) – took the second and third spots, respectively.
Viruses
The percentage of ICS computers on which viruses were blocked decreased to 1.31%.
The top 3 regions by this figure remained the same: Southeast Asia (6.11%, first by a wide margin), Africa (4.15%), and East Asia (2.97%). These same regions are also among the leaders by the percentage of systems affected by AutoCAD malware. The largest increase in this figure was observed in Africa (+0.41 pp).
Among the selected industries across all regions, the highest percentages for viruses were recorded in the construction industry (6.35%) and building automation (5.50%) in Southeast Asia.
Malware for AutoCAD
The percentage of ICS computers on which malware for AutoCAD was blocked increased to 0.30%.
The most notable increase over the quarter was observed in Africa, with the region’s percentage figure rising by 0.47 pp, a very significant increase for this category, and almost doubling (to 0.91%).
Among the selected industries across all regions, the highest percentages for AutoCAD malware were recorded in the construction industry in East Asia (5.58%) and Southeast Asia (3.87%).
Main threat sources
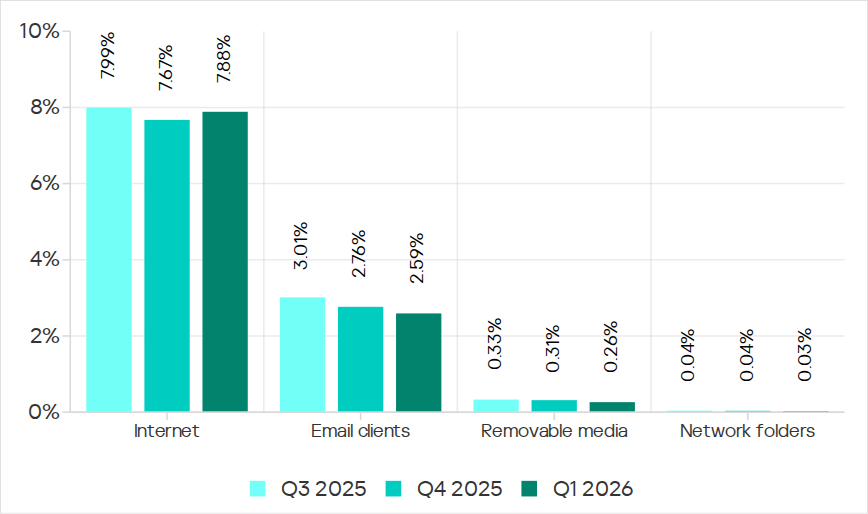
In Q1 2026, the average percentages across all threat sources, except threats from the internet, decreased globally.
Percentage of ICS computers on which malicious objects from various sources were blocked
Internet
The percentage of ICS computers on which threats from the internet were blocked increased to 7.88%. However, over the past three years, the percentage figure for internet threats has followed a downward trend.
The largest increases in the percentages were recorded in Southern Europe (8.59%, +0.59 pp), Southeast Asia (10.16%, +0.55 pp), and Northern Europe (4.47%, +0.51 pp).
Among the selected industries across all regions, the highest percentages for threats from the internet were recorded in electric power (13.16%) and construction (12.55%) in Southeast Asia, and in the engineering and ICS integration sector (12.33%) in South Asia.
Email clients
The percentage of ICS computers on which threats delivered via email clients were blocked decreased to 2.59%. This is a three-year low.
The percentage of this threat source increased in three regions: Southern Europe (6.54%, +0.2 pp), East Asia (1.5%, +0.09 pp), and slightly in Russia (0.7%, +0.04 pp).
Among the selected industries across all regions, the highest percentages for email threats were recorded for biometric systems (19.78%) and building automation (12.34%) in Southern Europe. In these two industries, the percentage of ICS computers on which email threats are blocked is higher than the percentage for threats from the internet. A similar situation was observed in two other instances, both in biometric systems (in South America and Southeast Asia).
Removable media
The percentage of ICS computers on which threats were detected when connecting removable media continued to decrease, reaching its lowest value for the period under review (0.26%).
Among the selected industries across all regions, the highest percentages for removable media threats blocked on ICS computers were observed in the electric power sector in Central Asia and the South Caucasus (1.45%), East Asia (1.34%), and Africa (1.16%).
Network folders
The percentage of ICS computers on which threats are blocked in network folders is steadily decreasing. In Q1 2026, it was the lowest for the period under review (0.029%).
East Asia has traditionally led by a wide margin. The percentage for East Asia (0.135%) is 27 times higher than the lowest regional value (recorded in Northern Europe).
The largest increases in the percentages for threats from network folders were observed in Africa (0.037%, +0.006 pp) and South America (0.013%, +0.006 pp).
Among the selected industries across all regions, the construction industry in East Asia, at 0.36%, holds the top positions in the ranking by the percentage of ICS computers on which threats are blocked in network folders.
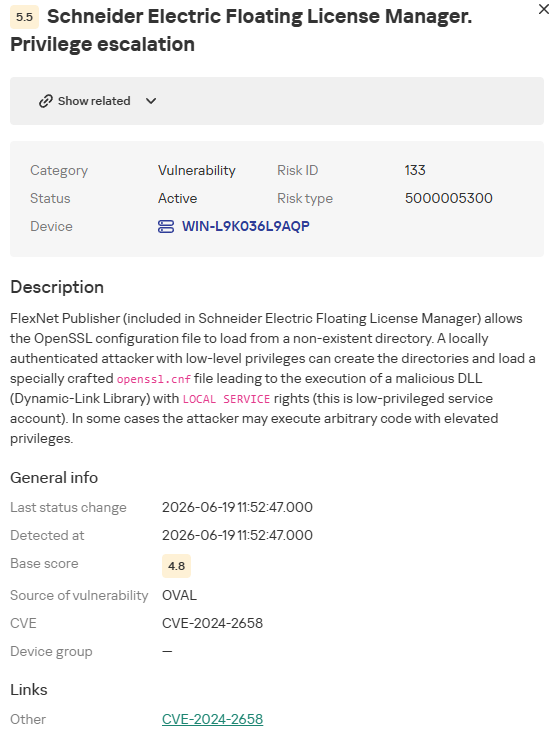
The CVE-2024-2658 vulnerability was discovered in 2024 within the FlexNet Publisher component of the Schneider Electric Floating License Manager. This software handles license management across various Schneider Electric products used for comprehensive industrial automation ranging from PLC programming to centralized control room implementation. Below, we break down how a single flaw can jeopardize an entire industrial facility, how to detect it on your workstations, and how to minimize the risks.
This vulnerability is a CWE-427: Uncontrolled Search Path Element issue. It stems from a system application referencing an OpenSSL configuration file at a hardcoded path without proper access controls.
This behavior allows a local non-administrator to craft a custom OpenSSL configuration file and force the lmadmin.exe system process – the core service that handles licensing – to load a third-party DLL. Consequently, the attacker’s code executes within the context of the service rather than a standard user account. Under specific conditions, this paves the way for further privilege escalation to the NT AUTHORITY\SYSTEM level.
Once NT AUTHORITY\SYSTEM access is achieved, the adversary can gain full control over local configuration files, sensitive system data, and secrets stored on the host. The potential for lateral movement to other nodes in the industrial network – such as engineering workstations – hinges on network connectivity, availability of stored credentials, and overall network architecture. Furthermore, the attacker can disrupt the operation of the license server itself, directly impacting the availability of engineering software and maintenance.
We will examine the role the FlexNet Publisher component plays within the Schneider Electric Floating License Manager (Schneider Electric FLM), why the hardcoded openssl.cnf path inside the application creates a critical hazard, what the exploit chain looks like, and the necessary mitigation steps to secure your environment.
The role of FlexNet Publisher in Schneider Electric FLM
FlexNet Publisher is a third-party commercial product by Flexera Software. The engineers behind Schneider Electric FLM, along with developers of numerous other industry solutions, integrate FlexNet Publisher as a library to manage product licensing. The underlying issue within FlexNet Publisher is that up to and including version 11.19.6.0, the library failed to restrict low-privileged users from modifying or replacing the openssl.cnf file. This is a textbook example of an Uncontrolled Search Path Element vulnerability (CWE-427).
Schneider Electric FLM relies on a combination of tightly integrated components:
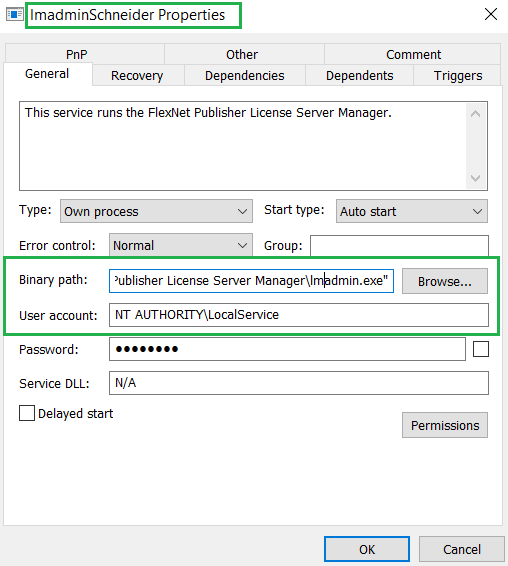
lmadmin.exe: a lightweight 32-bit daemon that services license requests coming from PLCs, HMIs, and SCADA modules. During installation, this component is automatically registered as a Windows service named lmadminSchneider. The service is configured to launch automatically and executes under the NT AUTHORITY\LOCAL SERVICE account.
Properties of lmadminSchneider: the executable file and security context of the service
Properties of lmadminSchneider: the executable file and security context of the service
The openssl.cnf configuration file located in the OpenSSL-contrib subdirectory. This configuration file can specify a path to engine-module, a custom DLL file that FlexNet can automatically load into the lmadmin.exe process space. The application references this configuration file via a hardcoded path built into the binary:
LMADMI~1.4 is the directory name in MS-DOS 8.3 filename format. Any user authorized to create directories in the root of C:\ can recreate this structure – by default, all authenticated users are allowed to do that. A clean, default installation of Schneider Electric FLM does not actually create that folder.
The FlexNet Publisher component (historically known as FLEXlm): the license management library that reads openssl.cnf, specifically parsing the [engine] section. If a dynamic_path parameter is defined within that section, FlexNet Publisher will load the specified DLL module at the specified path without performing any checks.
The Schneider Electric FLM web portal is a lightweight HTTP server embedded directly within the lmadmin.exe process. It provides access to two main areas: Dashboard (accessible without authentication) and Administration (password-protected). Because the web portal and lmadmin.exe share the same address space, any code loaded via FlexNet Publisher executes directly inside the lmadmin.exe process. This allows an attacker to easily intercept credentials for the Administration portal and leverage them to expand their attack surface across other systems.
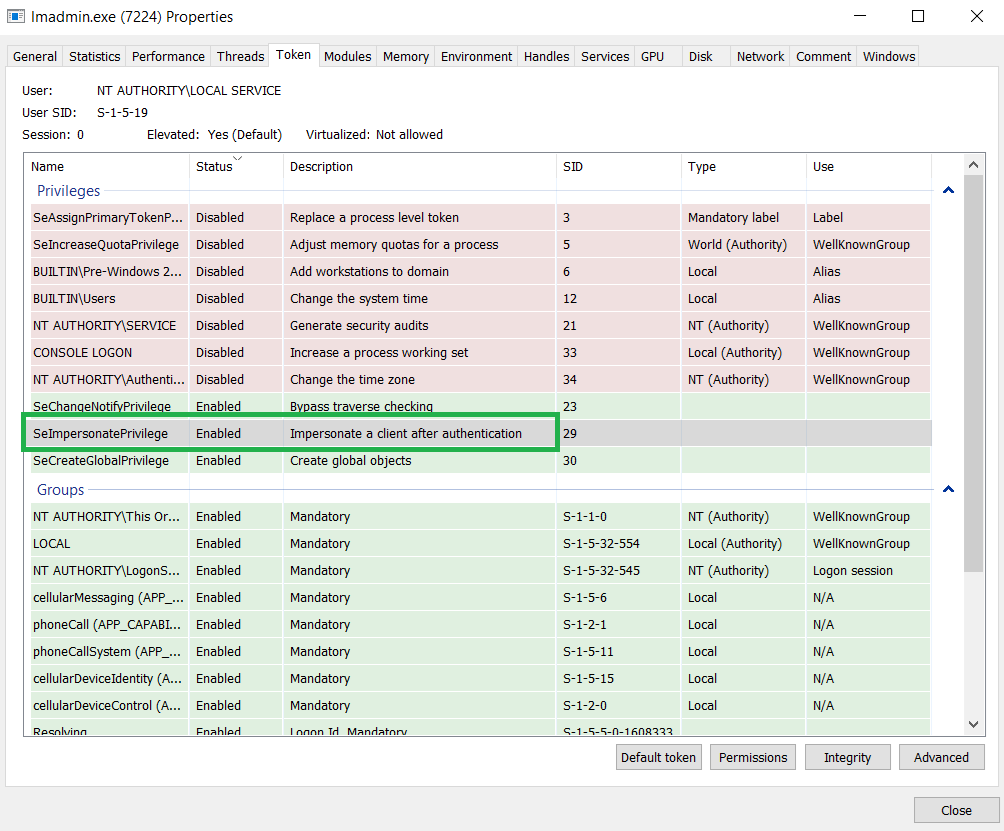
SeImpersonatePrivilege assigned to the lmadmin.exe process
The exploit path
To exploit this vulnerability, the attacker must first have the ability to execute arbitrary code locally on the machine hosting the vulnerable service. The primary weakness exploited here stems from standard Windows NTFS permissions: by default, the root directory of the system drive often allows the Authenticated Users group to create new folders. If these permissions (ACLs) have not been tightened, a non-privileged attacker can manually reconstruct the exact directory structure that lmadmin.exe checks for its OpenSSL configuration:
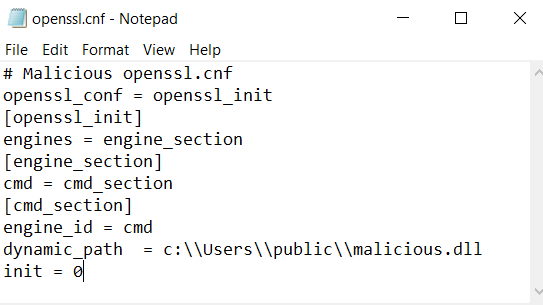
Next, within this newly created openssl.cnf file, the attacker adds a parameter pointing to a malicious engine module hosted in a writeable directory, for example: dynamic_path = C:\\Users\\public\\malicious.dll. When FlexNet Publisher initializes OpenSSL, it parses this section. Upon finding the dynamic_path parameter, it uses it to load the attacker’s DLL. Because vulnerable versions of FlexNet are allowed to read an OpenSSL configuration from an initially non-existent, untrusted path, the lmadmin.exe process accepts the rogue configuration file as legitimate.
Example of a malicious openssl.cnf configuration file
For lmadmin.exe to parse the openssl.cnf file and execute the malicious DLL, the lmadminSchneider service must be restarted. This can happen under any of the following conditions:
After a regular reboot of the host machine.
If the user possesses permissions to restart the service – by default, the Authenticated Users group is not allowed to do that.
Upon lmadmin.exe service startup, FlexNet Publisher initializes OpenSSL, opens the openssl.cnf configuration file, and parses the [engine] section. If a dynamic_path is specified, OpenSSL loads the corresponding DLL module directly into the lmadmin.exe process space. Once loaded, the code within the DLL executes in the context of lmadmin.exe. Because the service runs under NT AUTHORITY\LOCAL SERVICE, the malicious code inherits its privileges.
While the NT AUTHORITY\LOCAL SERVICE account is highly restricted by design, a significant risk for further privilege escalation remains. This exposure exists because, in a standard configuration, the service process is granted SeImpersonatePrivilege. This privilege allows the process to impersonate a client’s security context after authentication. Given an appropriate interaction scenario via RPC, COM, or named pipes, an attacker can exploit this to achieve local privilege escalation to NT AUTHORITY\SYSTEM. This is commonly done with tools from the Potato exploit family or similar impersonation abuse techniques. Consequently, while each individual step may appear unremarkable, their combination forms a complete exploit chain: moving from a low-privileged local user to executing code within a service context, and under the right conditions, to achieving a full escalation to NT AUTHORITY\SYSTEM privileges.
Mitigating CVE-2024-2658
If your organization does not rely on floating licenses, we recommend completely removing Schneider Electric FLM or avoiding its installation on workstations where it isn’t strictly required. Whenever feasible, use licenses tied to specific machines instead.
If still required, Schneider Electric FLM should be hosted on a dedicated server with strictly controlled user access.
Use an administrative account when creating the C:\cygwin directory and explicitly deny write permissions to the Authenticated Users group for this folder. This prevents staging a rogue OpenSSL configuration file along the hardcoded path.
Finally, update Schneider Electric FLM to version 3.0.0.0 or later.
Detection with Kaspersky solutions
Kaspersky Industrial CyberSecurity successfully detects exploitation attempts targeting this vulnerability. The KICS Vulnerability Manager module flags the presence of the vulnerable software version on endpoints, while the behavioral analysis engine tracks each stage of the attack chain – from the creation of the rogue configuration file on disk to the vulnerable service’s attempt to load the malicious library.
Detecting an exploitation attempt: an overview
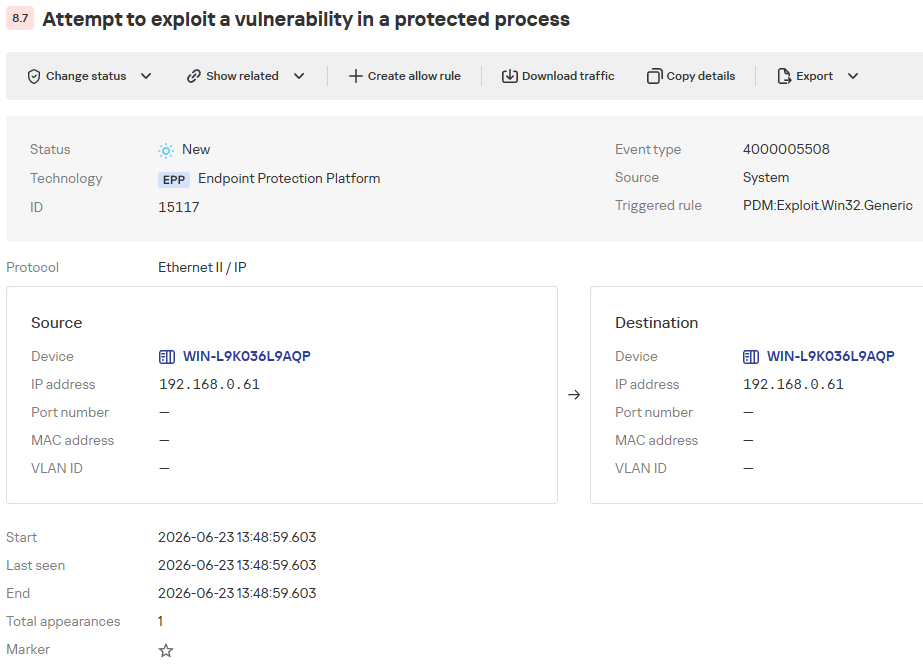
The KICS alert card consolidates details on the exploitation attempt alongside recommended defensive actions.
Description
The Exploit Prevention component of the EPP application detected attempts to exploit a vulnerability in a protected process. This type of attack may lead to malicious code execution, unauthorized access, or system integrity compromise.

EPP application data
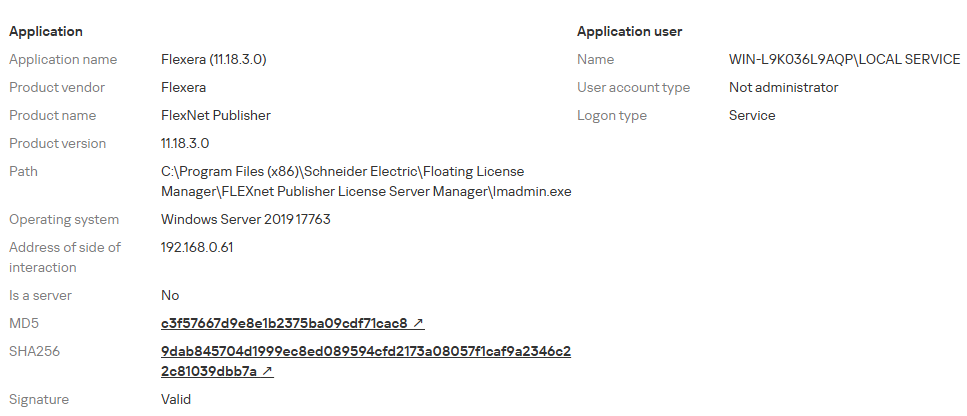
●	Object name: C:\Program Files (x86)\Schneider Electric\Floating License Manager\FLEXnet Publisher License Server Manager\lmadmin.exe.
●	Status: Untreatable.
●	MD5 hash: c3f57667d9e8e1b2375ba09cdf71cac8.
●	SHA256 hash: 9dab845704d1999ec8ed089594cfd2173a08057f1caf9a2346c22c81039dbb7a.

Mitigations
●	Analyze the event and identify the source of the startup or interaction with the process.
●	Make sure that this vulnerability is relevant to your system (check the software version and installed updates).
●	If a vulnerability exploit is confirmed, isolate the device and search for signs of compromise (suspicious files and their checksums, unknown processes/services, or queries to external IPs/FQDNs). Also, check for similar traces on other devices.
●	Install security updates for the attacked software or operating system and run a full scan of the device if necessary.
Detecting an exploitation attempt: target process details
Additionally, to proactively identify the presence of the vulnerability on a host as part of a continuous vulnerability management process, organizations can utilize the OVAL scanning task within KICS products. The following screenshot illustrates how KICS for Nodes highlights the presence of the vulnerable software version.
CVE-2024-2658 vulnerability details
Conclusion
The CVE-2024-2658 vulnerability is a prime example of the consequences that dependency-loading mechanisms lacking proper validation can have. In the case of the Schneider Electric Floating License Manager, a local non-administrator can position a rogue openssl.cnf configuration file at the hardcoded path to inject a malicious DLL directly into the lmadmin.exe service context. Given a certain system configuration, this chain can be leveraged to escalate privileges to the NT AUTHORITY\SYSTEM level.
To remediate this vulnerability, organizations must immediately upgrade the affected component (FlexNet Publisher) to a patched version and restrict write permissions for non-privileged users to the C:\cygwin directory. Implementing these controls will significantly reduce exploitation risk, while Kaspersky Industrial CyberSecurity solutions can provide an added layer of defense by detecting anomalous behavior at the earliest stages of the attack.
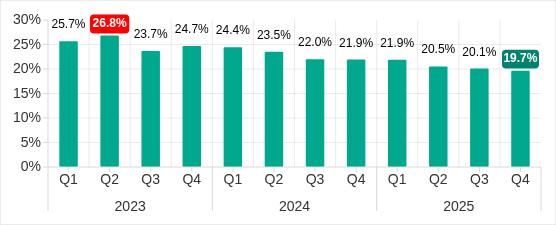
The percentage of ICS computers on which malicious objects were blocked has been decreasing since the beginning of 2024. In Q4 2025, it was 19.7%. Over the past three years, the percentage has decreased by 1.36 times, and by 1.25 times since Q4 2023.
Percentage of ICS computers on which malicious objects were blocked, Q1 2023–Q4 2025
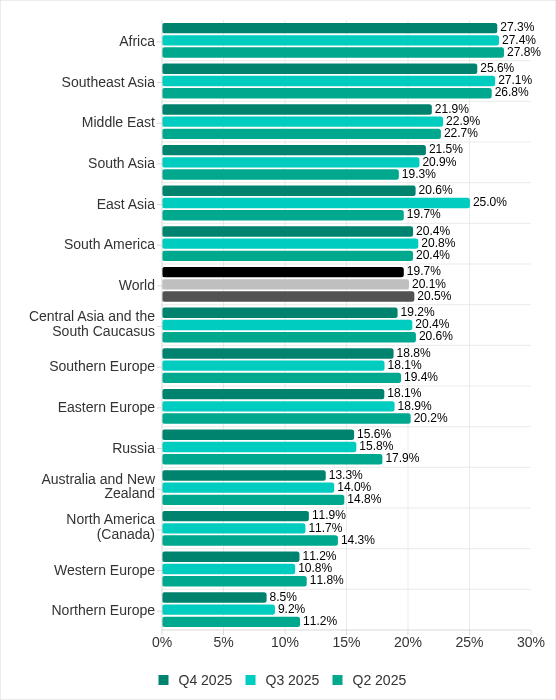
Regionally, in Q4 2025, the percentage of ICS computers on which malicious objects were blocked ranged from 8.5% in Northern Europe to 27.3% in Africa.
Regions ranked by percentage of ICS computers on which malicious objects were blocked
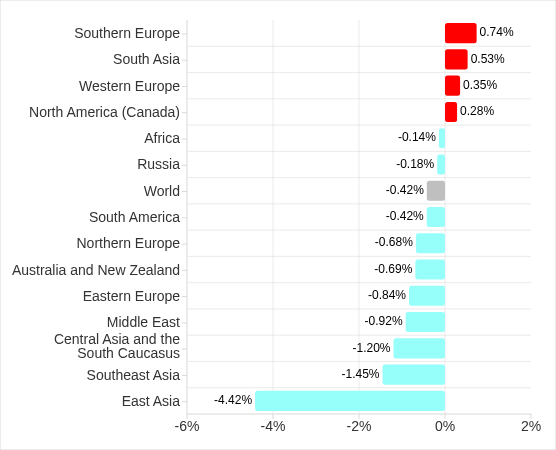
Four regions saw an increase in the percentage of ICS computers on which malicious objects were blocked. The most notable increases occurred in Southern Europe and South Asia. In Q3 2025, East Asia experienced a sharp increase triggered by the local spread of malicious scripts, but the figure has since returned to normal.
Changes in percentage of ICS computers on which malicious objects were blocked, Q4 2025
Feature of the quarter: worms in email
In Q4 2025, the percentage of ICS computers on which wormsinemailattachments were blocked increasedinallregions of the world.
Many of the blocked threats were related to the worm Backdoor.MSIL.XWorm. This malware is designed to persist on the system and then remotely control it.
Interestingly, this threat was not detected on ICS computers in the previous quarter, yet it appeared in all regions in Q4 2025.
A study found that the active spread of Backdoor.MSIL.XWorm via phishing emails was likely linked to the use by hackers of another malware obfuscation technique that was actively used during massive phishing campaigns in Q4 2025. These campaigns have been known since 2024 as “Curriculum-vitae-catalina”.
The attackers distributed phishing emails to HR managers, recruiters, and employees responsible for hiring. The messages were disguised as responses from job applicants with subjects such as “Resume” or “Attached Resume” and contained a malicious executable file under the guise of a curriculum vitae. Typically, the file was named Curriculum Vitae-Catalina.exe. When executed, it infected the system.
In Q4 2025, the threat spread across regions in two waves — one in October and another in November. Russia, Western Europe, South America, and North America (Canada) were attacked in October. A spike in Backdoor.MSIL.XWorm blocking was observed in other regions in November. The attack subsided in all regions in December.
The highest percentage of ICS computers on which Backdoor.MSIL.XWorm was blocked was observed in regions where threats from email clients had been historically blocked at high rates on ICS computers: Southern Europe, South America, and the Middle East.
At the same time, in Africa, where USB storage media are still actively used, the threat was also detected when removable devices were connected to ICS computers.
Selected industries
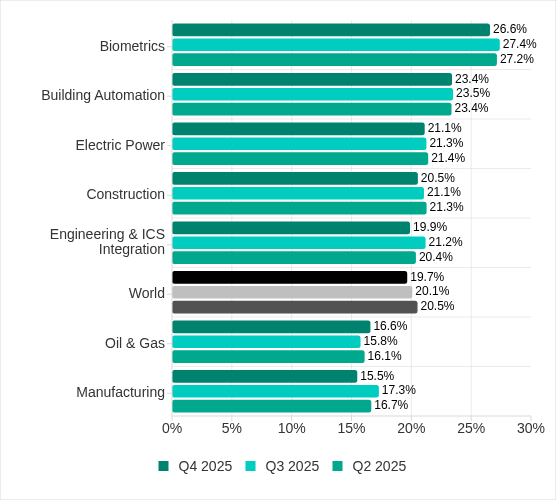
The biometrics sector has historically led the rankings of industries and OT infrastructures surveyed in this report in terms of the percentage of ICS computers on which malicious objects were blocked.
These systems are characterized by accessibility to and from the internet, as well as minimal cybersecurity controls by the consumer organization.
Rankings of industries and OT infrastructure by percentage of ICS computers on which malicious objects were blocked
In Q4 2025, the percentage of ICS computers on which malicious objects were blocked increased only in one sector: oil and gas. The corresponding figures increased in two regions: Russia, and Central Asia and the South Caucasus.
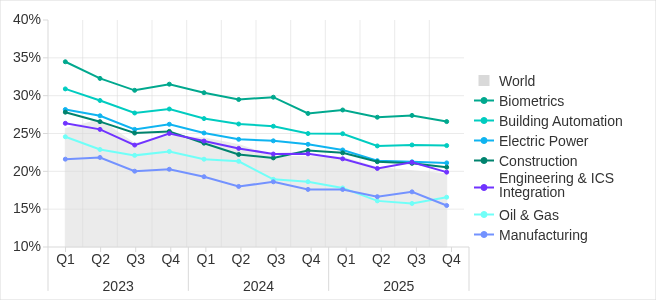
However, if we look at a broader time span, there is a downward trend in all the surveyed industries.
Percentage of ICS computers on which malicious objects were blocked in selected industries
Diversity of detected malicious objects
In Q4 2025, Kaspersky protection solutions blocked malware from 10,142 different malware families of various categories on industrial automation systems.
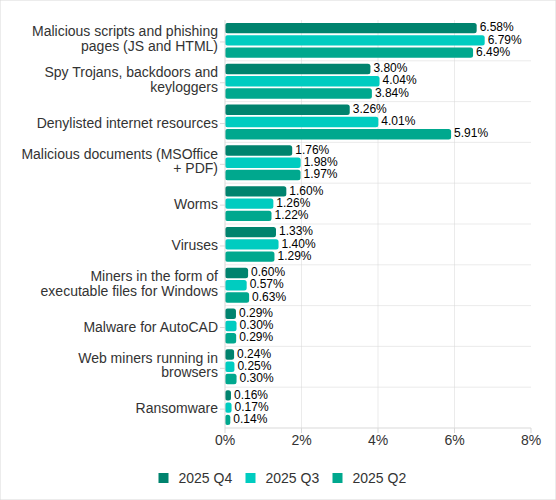
Percentage of ICS computers on which the activity of malicious objects from various categories was blocked
In Q4 2025, there was an increase in the percentage of ICS computers on which worms, and miners in the form of executable files for Windows were blocked. These were the only categories that exhibited an increase.
Main threat sources
Depending on the threat detection and blocking scenario, it is not always possible to reliably identify the source. The circumstantial evidence for a specific source can be the blocked threat’s type (category).
The internet (visiting malicious or compromised internet resources; malicious content distributed via messengers; cloud data storage and processing services and CDNs), email clients (phishing emails), and removable storage devices remain the primary sources of threats to computers in an organization’s technology infrastructure.
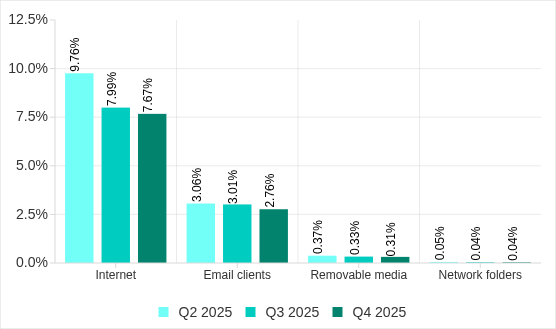
In Q4 2025, the percentage of ICS computers on which malicious objects from various sources were blocked decreased. All sources except email clients saw their lowest levels in three years.
Percentage of ICS computers on which malicious objects from various sources were blocked
The same computer can be attacked by several categories of malware from the same source during a quarter. That computer is counted when calculating the percentage of attacked computers for each threat category, but is only counted once for the threat source (we count unique attacked computers). In addition, it is not always possible to accurately determine the initial infection attempt. Therefore, the total percentage of ICS computers on which various categories of threats from a certain source were blocked can exceed the percentage of computers affected by the source itself.
In Q4 2025, the percentage of ICS computers on which threats from the internet were blocked decreased to 7.67% and reached its lowest level since the beginning of 2023. The main categories of internet threats are malicious scripts and phishing pages, and denylisted internet resources. The percentage ranged from 3.96% in Northern Europe to 11.33% in South Asia.
The main categories of threats from email clients blocked on ICS computers were malicious scripts and phishing pages, spyware, and malicious documents. Most of the spyware detected in phishing emails was delivered as a password archive or a multi-layered script embedded in office document files. The percentage of ICS computers on which threats from email clients were blocked ranged from 0.64% in Northern Europe to 6.34% in Southern Europe.
The main categories of threats that were blocked when removable media was connected to ICS computers were worms, viruses, and spyware. The percentage of ICS computers on which threats from removable media were blocked ranged from 0.05% in Australia and New Zealand to 1.41% in Africa.
The main categories of threats that spread through network folders in Q4 2025 were viruses, AutoCAD malware, worms, and spyware. The percentage of ICS computers on which threats from network folders were blocked ranged from 0.01% in Northern Europe to 0.18% in East Asia.
Threat categories
Typical attacks blocked within an OT network are multi-step sequences of malicious activities, where each subsequent step of the attackers is aimed at increasing privileges and/or gaining access to other systems by exploiting the security problems of industrial enterprises, including OT infrastructures.
Malicious objects used for initial infection
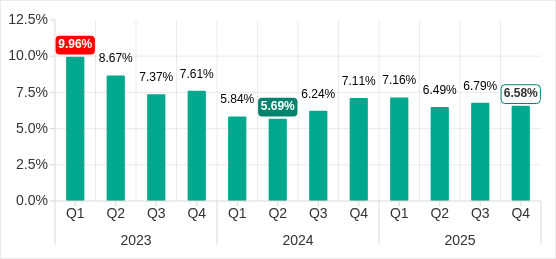
In Q4 2025, the percentage of ICS computers on which denylisted internet resources were blocked decreased to 3.26%. This is the lowest quarterly figure since the beginning of 2022, and it has decreased by 1.8 times since Q2 2025.
Percentage of ICS computers on which denylisted internet resources were blocked, Q1 2023–Q4 2025
Regionally, the percentage of ICS computers on which denylisted internet resources were blocked ranged from 1.74% in Northern Europe to 3.93% in Southeast Asia, which displaced Africa from first place. Russia rounded out the top three regions for this indicator.
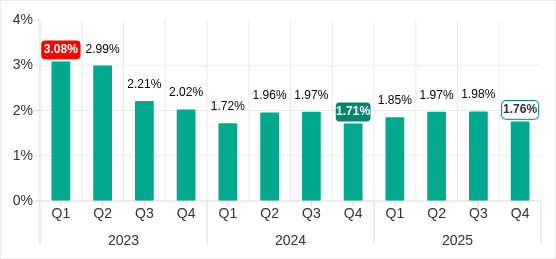
The percentage of ICS computers on which malicious documents were blocked increased for three consecutive quarters. However, in Q4 2025 it decreased by 0.22 pp to 1.76%.
Percentage of ICS computers on which malicious documents were blocked, Q1 2023–Q4 2025
Regionally, the percentage ranged from 0.46% in Northern Europe to 3.82% in Southern Europe. In Q4 2025, the indicator increased in Eastern Europe, Russia, and Western Europe.
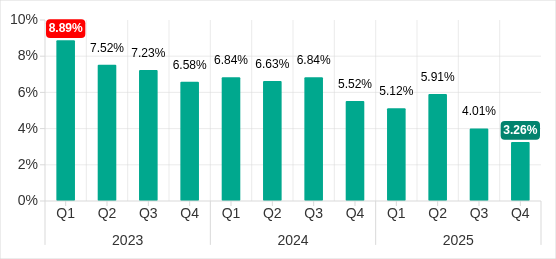
The percentage of ICS computers on which malicious scripts and phishing pages were blocked decreased to 6.58%. Despite the decline, this category led the rankings of threat categories in terms of the percentage of ICS computers on which they were blocked.
Percentage of ICS computers on which malicious scripts and phishing pages were blocked, Q1 2023–Q4 2025
Regionally, the percentage ranged from 2.52% in Northern Europe to 10.50% in South Asia. The indicator increased in South Asia, South America, Southern Europe, and Africa. South Asia saw the most notable increase, at 3.47 pp.
Next-stage malware
Malicious objects used to initially infect computers deliver next-stage malware — spyware, ransomware, and miners — to victims’ computers. As a rule, the higher the percentage of ICS computers on which the initial infection malware is blocked, the higher the percentage for next-stage malware.
In Q4 2025, the percentage of ICS computers on which spyware, ransomware and web miners were blocked decreased. The rates were:
Spyware: 3.80% (down 0.24 pp). For the second quarter in a row, spyware took second place in the rankings of threat categories in terms of the percentage of ICS computers on which it was blocked.
Ransomware: 0.16% (down 0.01 pp).
Web miners: 0.24% (down 0.01 pp), this is the lowest level observed thus far in the period under review.
The percentage of ICS computers on which miners in the form of executable files for Windows were blocked increased to 0.60% (up 0.03 pp).
Self-propagating malware
Self-propagating malware (worms and viruses) is a category unto itself. Worms and virus-infected files were originally used for initial infection, but as botnet functionality evolved, they took on next-stage characteristics.
To spread across ICS networks, viruses and worms rely on removable media and network folders and are distributed in the form of infected files, such as archives with backups, office documents, pirated games and hacked applications. In rarer and more dangerous cases, web pages with network equipment settings, as well as files stored in internal document management systems, product lifecycle management (PLM) systems, resource management (ERP) systems and other web services are infected.
In Q4 2025, the percentage of ICS computers on which worms were blocked increased by 1.6 times to 1.60%. As mentioned above, this increase is related to a global phishing attack that spread the Backdoor.MSIL.XWorm backdoor worm across all regions of the world. The percentage increased in all regions. The biggest increase (up by 2.16 times) was in Southern Europe. The malware was primary distributed through email clients, and Southern Europe led the way in terms of the percentage of ICS computers on which threats from email clients were blocked.
The percentage of ICS computers on which viruses were blocked decreased to 1.33%.
AutoCAD malware
This category of malware can spread in a variety of ways, so it does not belong to a specific group.
After an increase in the previous quarter, the percentage of ICS computers on which AutoCAD malware was blocked decreased to 0.29% in Q4 2025.

 Entrar