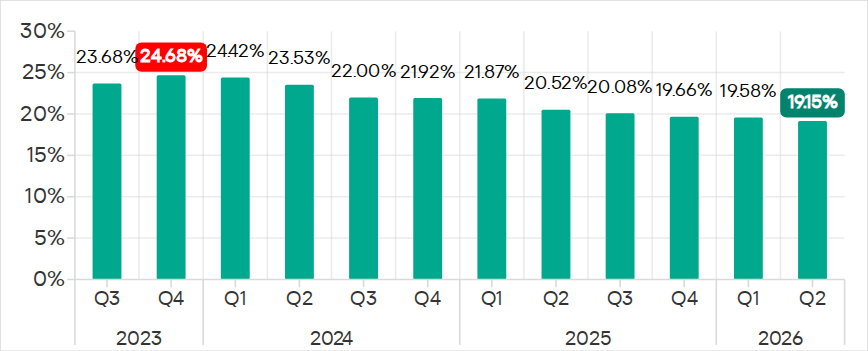
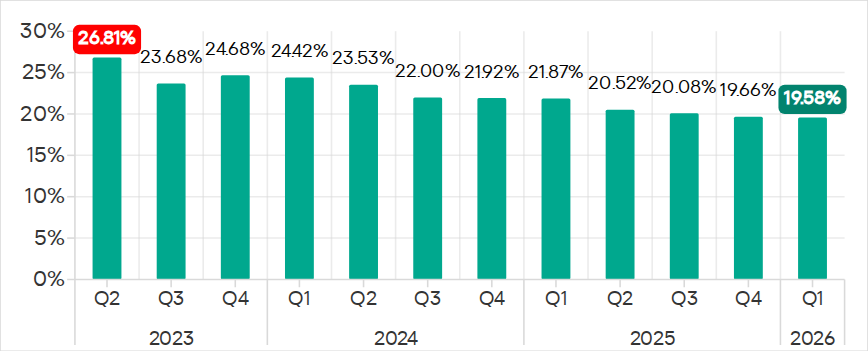
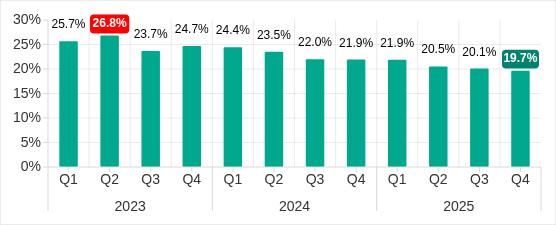
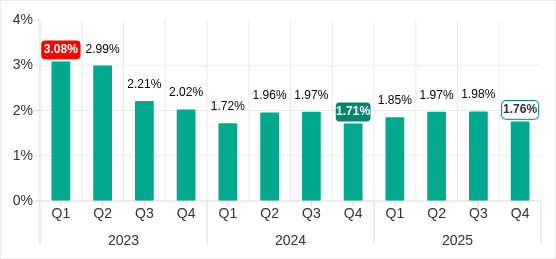
In Q2 2026, the percentage of ICS computers on which malicious objects were blocked continued to decrease, falling to 19.15%, its lowest level since 2022.
Percentage of ICS computers on which malicious objects were blocked, Q3 2023–Q2 2026
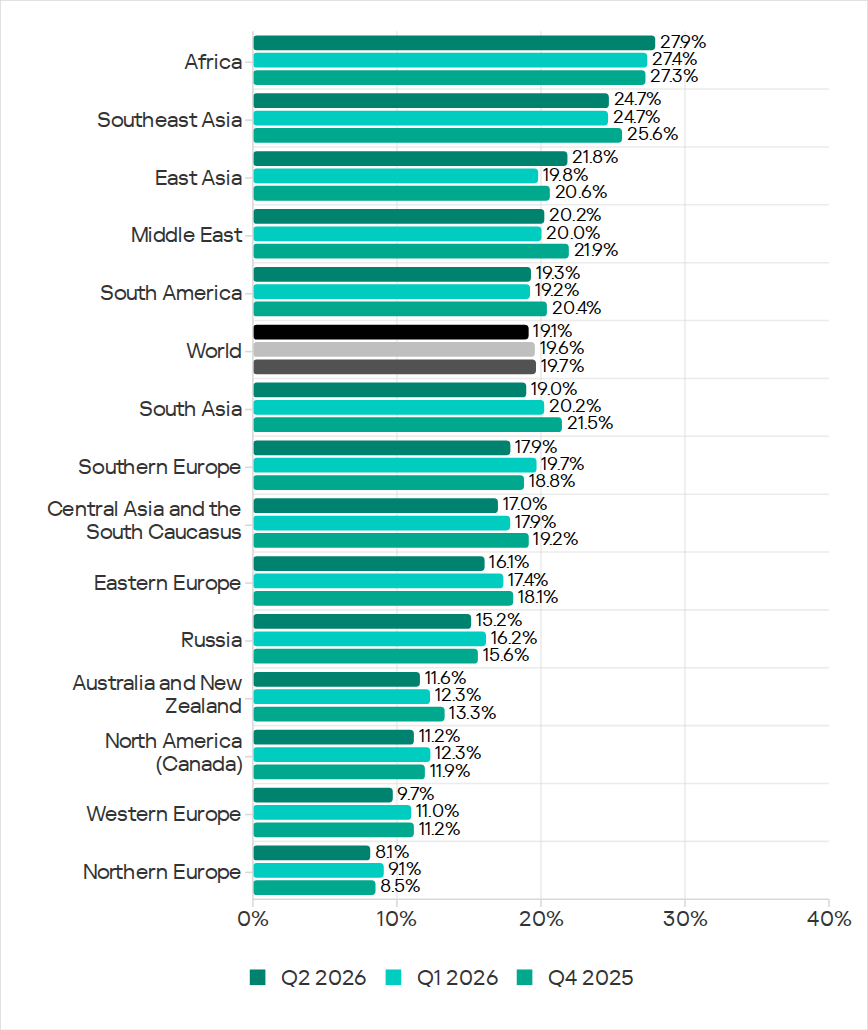
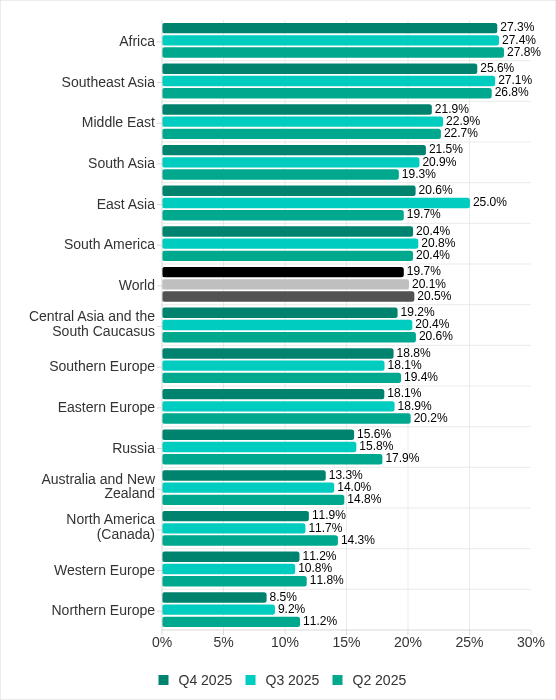
Regionally, the percentages ranged from 8.1% in Northern Europe to 27.9% in Africa.
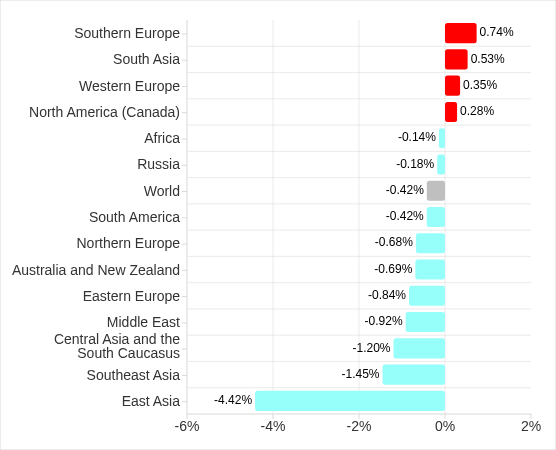
Regions ranked by percentage of attacked ICS computers
The figures increased in five regions over the quarter, most notably in East Asia (by 2.0 pp) and Africa (by 0.5 pp).
East Asia saw increases in percentages for all threats except miners. The region ranked first in terms of growth for malicious scripts and phishing pages, spyware, and viruses. East Asia also led in terms of growth in threats from the internet. The percentage of ICS computers on which email threats were blocked also increased.
Selected industries
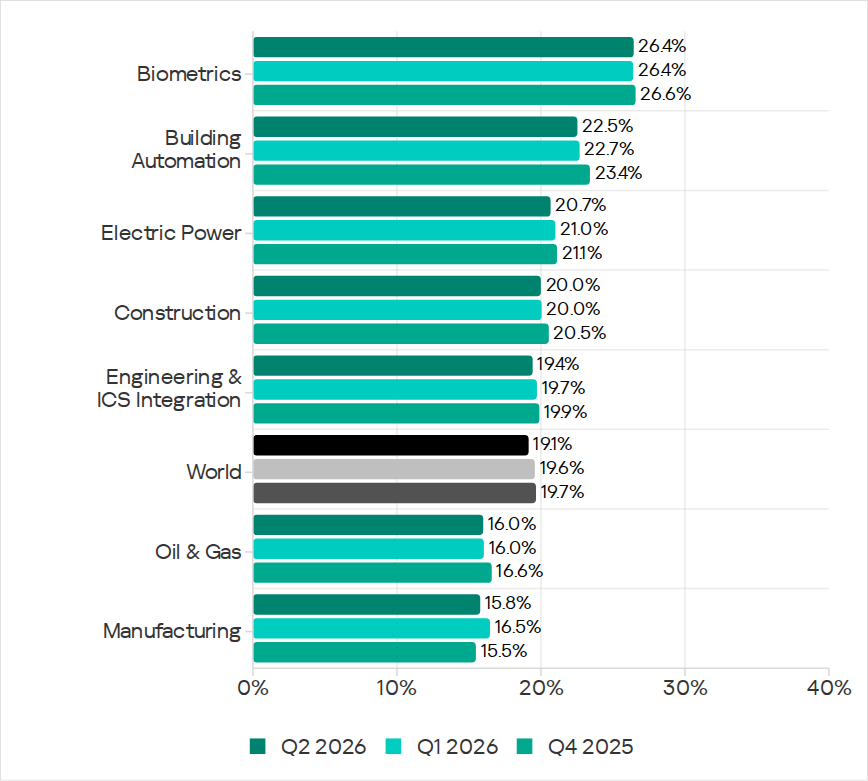
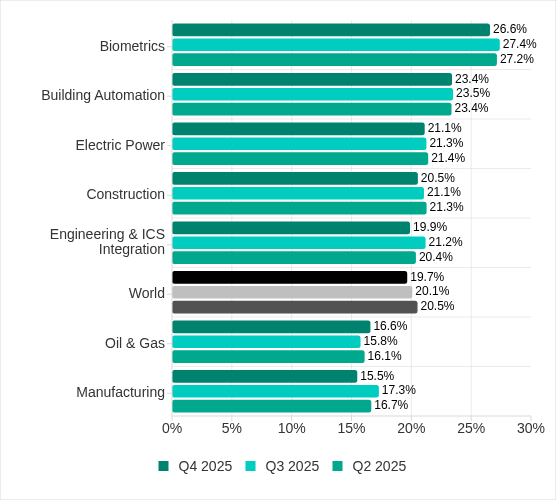
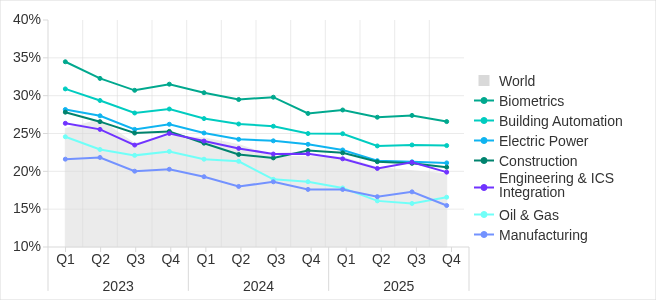
The biometrics sector (26.44%) has traditionally led the rankings of industries and OT infrastructures surveyed in this report in terms of the percentage of ICS computers on which malicious objects were blocked. Biometric systems are characterized by the availability of internet access, extensive email use for data exchange and approvals (e.g. access granting), and, in many cases, minimal cybersecurity controls within the organizations that use them.
Industries ranked by percentage of ICS computers on which malicious objects were blocked
The biometrics sector ranked first among industries in terms of the following threat categories: malicious scripts and phishing pages, malicious documents, spyware, ransomware, and worms. The sector is also leading among industries in terms of email threats. At the same time, unlike other industries, the percentage of affected ICS computers for email threats in biometrics exceeds that for internet threats.
In all selected industries, the global average follows a downward trend.
Threat categories
In Q2 2026, Kaspersky security solutions blocked malware from 10,904 different malware families of various categories on industrial automation systems.
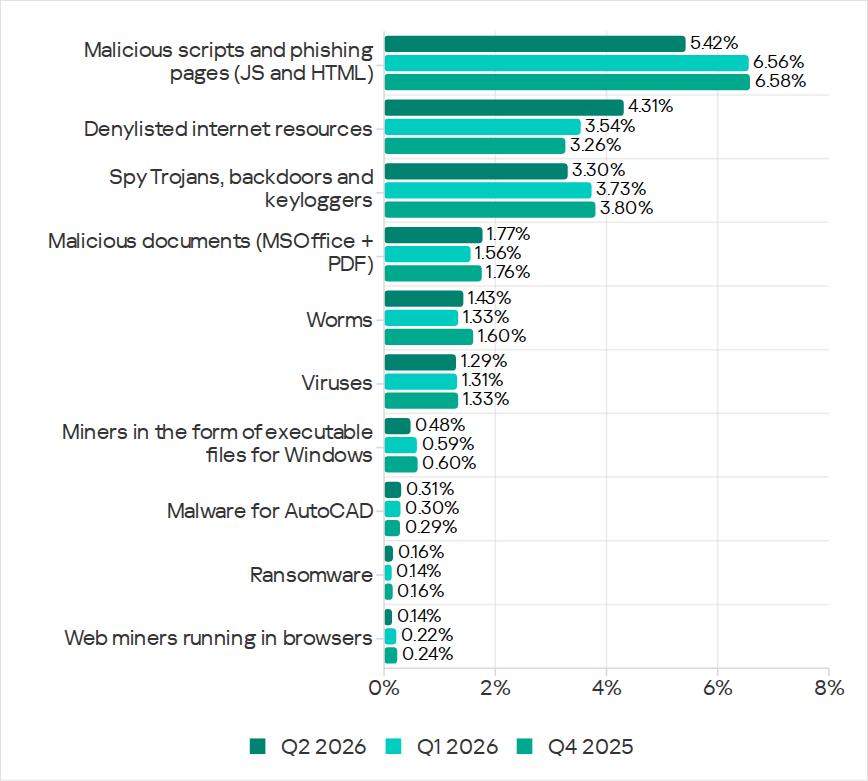
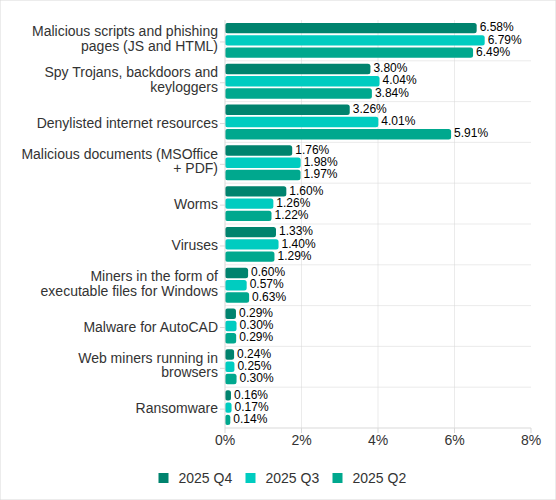
Over the quarter, the percentage of ICS computers on which malicious objects of the following categories were blocked increased: denylisted internet resources, malicious documents, worms, ransomware, and malware for AutoCAD.
Percentage of ICS computers on which the activity of malicious objects from various categories was blocked
Malicious scripts and phishing pages (JS and HTML)
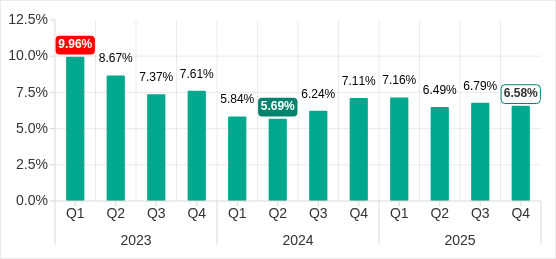
Malicious scripts and phishing pages remained in first place in the threat category rankings based on the percentage of ICS computers on which the respective threats were blocked. In Q2 2026, the global average dropped to 5.42%.
Over the quarter, the figure for this category only increased in East Asia, rising by 0.93 pp to 4.86%. This is the second-highest figure in the region in the last three years.
In East Asia, the percentage of ICS computers affected by malicious scripts and phishing pages increased in all the industries surveyed, except construction. The highest figures were recorded for biometrics (9.01%) and building automation (6.49%).
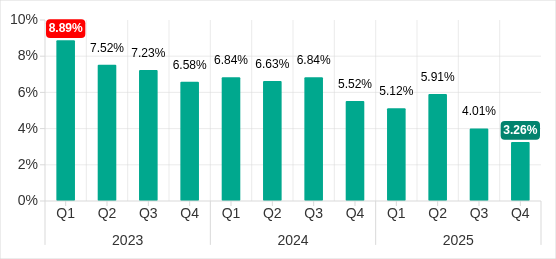
Denylisted internet resources
In Q2 2026, denylisted internet resources rose in the threat category rankings from third to second place, displacing spyware. Globally, the percentage of ICS computers on which denylisted internet resources were blocked has been increasing for two quarters in row and reached 4.31%.
The figures increased in all regions over the quarter, most notably in Russia (by 1.33 pp). Moreover, Russia ranked first (5.17%) among the regions in terms of denylisted internet resources. Since 2022, the region has topped these rankings twice before, both times in Q2: in 2022 and 2024.
Among the selected industries in Russia, the highest figures for the denylisted internet resources were in the electric power (6.61%) and engineering and ICS integration (5.62%) industries.
Malicious documents (MSOffice + PDF)
Malicious documents ranked fourth in the threat category rankings by the percentage of ICS computers on which they were blocked. The percentage for this category decreased over the previous three quarters, reaching its lowest level in three years. However, in Q2 2026, it increased to 1.77%.
Over the quarter, the figures for malicious documents increased in seven regions, most notably in South America (by 1.35 pp) and Southern Europe (by 0.48 pp). These two regions are among the top three in terms of malicious documents, malicious scripts and phishing pages, as well as threats from email clients.
South America ranked second in the rankings of regions in terms of malicious documents. In Q2 2026, the percentage of ICS computers in the region on which this threat was blocked was 3.56%, which was the fourth highest in three years.
Among the selected industries in South America, the highest percentage of ICS computers on which malicious documents were blocked was in biometrics (6.67%).
Southern Europe ranked first in the rankings of regions in terms of malicious documents. In the previous quarter, the percentage of ICS computers in the region on which this threat was blocked was the lowest in three years, but in Q2 2026 it increased to 3.63%.
Among the selected industries in Southern Europe, the highest percentage of ICS computers on which malicious documents were blocked was once again in biometrics (11.48%).
Spyware
Spyware ranked third in the threat category rankings based on the percentage of ICS computers on which it was blocked. The percentage for this category (3.30%) is the lowest since 2022.
Over the quarter, the figures increased in three regions, most notably in East Asia (by 0.53 pp) and Southeast Asia (by 0.42 pp).
East Asia ranked third based on the figures for spyware (4.77%), behind Africa and Southeast Asia. This is the region’s highest rate since Q2 2025. Among the countries and territories in the region, the highest percentage of ICS computers on which spyware was blocked was in mainland China (6.61%). Among the selected industries in East Asia, the highest figures for spyware were in the electric power (11.75%) and manufacturing (5.87%) industries. In all the industries surveyed, the figures are higher than the regional average.
Southeast Asia ranked second after Africa in the ranking of regions in terms of spyware, with 5.32%. Among the selected industries in Southeast Asia, the highest figures for spyware were in biometrics (8.93%) and manufacturing (7.32%). The figures increased in all industries over the quarter.
Ransomware
The percentage of ICS computers on which ransomware was blocked decreased in the previous three quarters but increased to 0.16% in Q2 2026.
During the quarter, the percentage increased in all regions, except Western and Southern Europe and North America (Canada). Africa led the ranking in terms of growth for this metric.
In Q2 2026, Africa ranked first among the regions in terms of the percentage of ICS computers on which ransomware was blocked (0.29%). The only time the figure in the region was higher in the past three years was Q2 2025 (0.31%).
Among the selected industries in Africa, the highest figures for ransomware were in the electric power industry (0.72%) and biometrics (0.52%). Over the quarter, the figures increased in all industries, except manufacturing and construction. The biggest increase was recorded in the electric power industry.
In Russia, the percentage of ICS computers on which ransomware was blocked in biometric systems has increased for three consecutive quarters, reaching 1.22%. This is the highest level of ransomware across all industries in all regions.
Miners
In Q2 2026, the percentage of ICS computers on which miners were blocked was the lowest since 2021, for both miners in the form of executable files for Windows (0.48%) and web miners running in browsers (0.14%).
The figures for both categories decreased in all regions, except for Africa where figures for miners in the form of executable files for Windows increased slightly.
On average, the oil and gas industry led the rankings among the selected industries both in terms of miners in the form of executable files for the Windows OS (0.66%) and in terms of web miners (0.34%).
Worms
In Q2 2026, the percentage of ICS computers on which worms were blocked increased to 1.43%.
In Q2 2026, the Middle East (2.11%) was second (after Africa) in the rankings of regions in terms of worms, displacing Central Asia and the South Caucasus.
Among the selected industries in the Middle East, the highest percentage of ICS computers on which worms were blocked was in building automation (2.90%). Over the quarter, the figures increased in all industries.
Australia and New Zealand ranked 12th among the regions in terms of the percentage of ICS computers on which worms were blocked (0.41%). Over the past three years, the figure in this region was only higher in Q2 2024 (0.42%). The figures increased in all the surveyed industries in the region, most notably in manufacturing and electric power. As a result, for these industries they exceeded the regional average by 2.9 and 2.3 times, respectively.
Viruses
In Q2 2026, the percentage of ICS computers on which viruses were blocked decreased to 1.29%.
The top three regions for this metric remain unchanged: Southeast Asia (6.03%), Africa (4.22%), and East Asia (3.14%). These same regions lead the rankings in terms of malware for AutoCAD.
The figures increased in three regions: East Asia, Australia and New Zealand, and Africa, where it has been growing for four consecutive quarters and reached its highest value since 2022.
Among the selected industries in Africa, the highest percentage of ICS computers on which viruses were blocked was in construction (5.47%).
East Asia ranked third among the regions in terms of viruses, reaching the highest level in the region for the past three years. Among the countries and administrative regions of East Asia, mainland China is the clear leader in terms of viruses (5.07%).
Among the selected industries in East Asia, the highest percentage of ICS computers on which viruses were blocked was in construction (5.93%).
In Australia and New Zealand, the increase in the percentage of ICS computers on which viruses were blocked was primarily due to a 4.3-fold increase in the figure for the electric power industry: from 0.29% to 1.24%. For a region where the percentage of attacked ICS computers for all threats is 0.12%, this is a very high value.
Malware for AutoCAD
In Q2 2026, the percentage of ICS computers on which malware for AutoCAD was blocked increased to 0.31%.
The most notable increase over the quarter was observed in Africa. After more than doubling in the previous quarter, the figure for the region continued to rise (although not so dramatically), reaching 1.02%.
Among the selected industries across all regions, the highest percentage of ICS computers on which malware for AutoCAD was blocked was in construction in East Asia (6.38%) and in Southeast Asia (4.05%).
Main threat sources
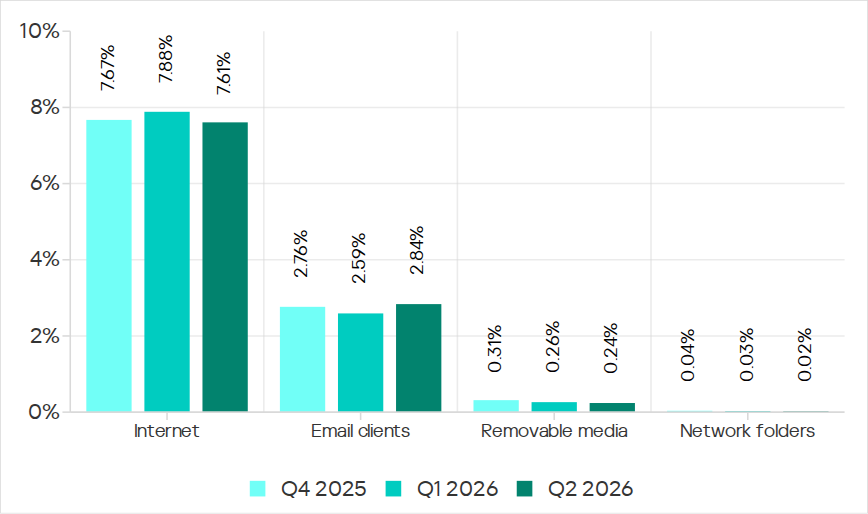
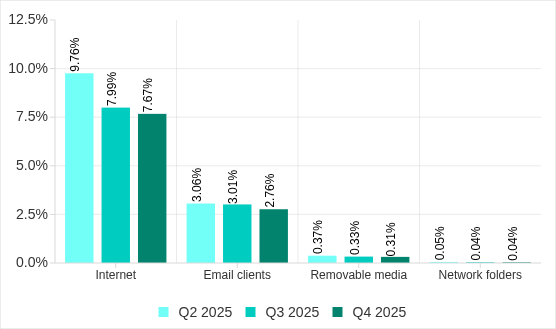
In Q2 2026, of all the threat sources, the percentage increased only for email.
Percentage of ICS computers on which malicious objects from various sources were blocked
Internet
The percentage of ICS computers on which threats from the internet were blocked decreased to 7.61%, reaching its lowest level since 2021.
Over the quarter, the percentage increased in three regions: East Asia by 0.8 pp (to 6.3%), South Asia by 0.3 pp (to 10.4%), and Russia by 0.3 pp (to 6.4%).
Among the selected industries across all regions, the highest percentage of ICS computers on which threats from the internet were blocked was in biometrics (13.03%) and engineering and ICS integration (12.16%) in South Asia.
Email
The percentage of ICS computers on which email threats were blocked increased to 2.84%.
In Q2 2026, the percentage of ICS computers on which email threats were blocked increased in South America by 1.0 pp (to 5.2%) and in Africa by 0.7 pp (to 4.3%).
Among the selected industries across all regions, the highest percentage of ICS computers on which email threats were blocked was in biometrics (19.14%) and building automation (12.49%) in Southern Europe.
Removable media
The percentage of ICS computers on which threats from removable media were blocked continued to decrease, reaching 0.24%, the lowest value for the period under review.
Among the selected industries across all regions, the highest percentage of ICS computers on which threats from removable media were blocked was in the electric power industry in East Asia (1.34%) and biometrics in Africa (1.29%).
Network folders
The percentage of ICS computers on which threats from network folders were blocked continued to decrease. In Q2 2026, it was the lowest for the period under review, at 0.023%.
The only region to see an increase in the percentage of ICS computers on which threats from network folders were blocked during the quarter was Africa. This was mainly due to an increase in the building automation figure to 0.05%.
Among the selected industries across all regions, the highest percentage of ICS computers on which threats from network folders were blocked was in biometrics (0.23%), building automation (0.17%), and engineering and ICS integration (0.13%) in East Asia.
Hackers are exploiting a macOS Screen Sharing flaw to gain root access and install Monero miners on Macs with port 5900 exposed online.
The Dutch National Cyber Security Centre confirmed active exploitation of a critical macOS authentication flaw, tracked as CVE-2026-65400 (CVSS score of 9.8), less than two weeks after Apple shipped the fix.
The bug sits in macOS’s built-in Screen Sharing feature, the remote desktop tool baked into every Mac. Apple’s fix improved how the system manages authentication state, closing a gap that let attackers on the network authenticate to Screen Sharing without valid credentials at all.
“An attacker on the network may be able to authenticate to Screen Sharing without valid credentials” reads the advisory.
That’s a fast, coordinated fix by industry standards. It just wasn’t fast enough to beat whoever started scanning for exposed systems.
NCSC-NL says it received reports of active abuse hitting multiple systems where port 5900, the port Screen Sharing runs on, was reachable directly from the internet.
“The vulnerability concerns an authentication issue in the Screen Sharing functionality where network attackers can gain access without valid credentials. This is made possible by insufficient state management during the authentication process. As a result, unauthorized individuals can perform authentication attempts that would normally not be accepted.” reads the advisory. “The NCSC has received a security advisory indicating that active exploitation of this vulnerability has been observed on multiple systems where port 5900 was accessible from the internet. In all these cases, root access was obtained on the affected system and a Monero crypto miner was placed.”
In every case documented so far, attackers gained root access and dropped a Monero cryptocurrency miner on the compromised machine. Cryptomining is a relatively boring payload compared to what root access on a Mac could actually enable, which makes this look more like opportunistic scanning than a targeted campaign, for now.
This flaw sits in the same source code file as two other Screen Sharing bugs Apple patched a month earlier in macOS 26.6, one of them a genuinely pre-authentication flaw that a researcher going by @osxreverser described needing nothing but a target’s IP address to exploit, no password, no username, nothing.
That researcher claimed to have found around 40,000 exposed Screen Sharing hosts on the internet during a scan, nearly half of them in the US, spanning residential connections, university networks, and at least a few corporate servers.
What ties both bugs together is how mechanically simple they are to trigger. Security firm Calif, which analyzed the flaws, found no memory corruption, no exploitation trickery, no race condition to win, just logic errors that let a couple of correctly ordered packets walk straight past authentication. Calif also said it built a working exploit for both vulnerabilities in about four hours using an AI coding agent, which is the detail that should worry defenders more than the Monero miner itself: the gap between a patch note and a working exploit keeps shrinking, and it’s shrinking because building the exploit barely takes effort anymore.
If you’re running a Mac with Screen Sharing enabled and haven’t updated yet, do it now rather than after finishing this article. And if updating isn’t possible immediately, turn Screen Sharing off entirely under General, Sharing, until you can; leaving port 5900 open to the internet at this point is less a risk than an open invitation.
The statistics in this report are based on detection verdicts returned by Kaspersky products unless otherwise stated. The information was provided by Kaspersky users who consented to sharing statistical data.
Quarterly figures
In Q2 2026:
Kaspersky products blocked nearly 400 million attacks that originated with various online resources.
Web Anti-Virus responded to 52 million unique links.
File Anti-Virus blocked more than 16 million malicious and potentially unwanted objects.
There were 2538 new ransomware variants discovered.
More than 71,000 users experienced ransomware attacks.
15% of all ransomware victims whose data was published on threat actors’ data leak sites (DLS) were attacked by Qilin.
More than 213,000 users were targeted by miners.
Ransomware
Quarterly trends and highlights
Threat actor disruption
Microsoft has dismantled an illicit malware-signing service used by ransomware operators. Microsoft’s Digital Crimes Unit has shut down a malware-signing-as-a-service (MSaaS) operation run by the threat group Fox Tempest. The illicit service abused the Microsoft Artifact Signing platform to generate digital signature certificates for malicious software. Malware signed by these certificates was observed in campaigns conducted by such ransomware groups as Rhysida, Akira, INC, Qilin, and BlackByte. The service was also leveraged by operators of the Oyster loader as well as the Lumma and Vidar infostealers. To disrupt the operation, Microsoft seized the domain used by the MSaaS platform, revoked all associated certificates, and disabled the related accounts. Additionally, the company filed a lawsuit against Fox Tempest.
Vulnerabilities and attacks
CISA has confirmed that a Windows vulnerability known as BlueHammer is actively being exploited in ransomware attacks. On April 22, the agency updated its Known Exploited Vulnerabilities (KEV) catalog to note the ongoing ransomware exploitation of CVE-2026-33825. The local privilege escalation flaw in Microsoft Defender was originally disclosed earlier in April. Although Microsoft released a fix on April 14, unpatched systems remain vulnerable. CISA did not disclose further details or attribute the attacks to specific threat groups.
Check Point has linked zero-day exploitation of CVE-2026-50751 to the Qilin ransomware group. The critical vulnerability affects Check Point Remote Access VPN and Mobile Access. Attackers began exploiting the flaw as a zero-day on May 7, with activity spiking sharply in early June. While several dozen organizations have been targeted, at least one incident has been definitively tied to Qilin. Check Point also disclosed a related certificate validation flaw (CVE-2026-50752) that affects site-to-site VPN connections relying on the legacy IKEv1 key exchange protocol.
Researchers assess with high confidence that the PayoutsKing group is leveraging the legitimate QEMU emulator to deploy hidden, Alpine Linux-based virtual machines on compromised hosts. Because security solutions often lack visibility inside virtualized environments, the threat actors use this technique to evade detection. Inside the VM image, the operators deploy various tools — such as credential theft software — and configure the virtual machine as a backdoor managed via a reverse SSH tunnel to their command-and-control infrastructure. While the technique is not new, and we’ve detailed it before, it remains relatively rare in ransomware attacks.
The most prolific groups
This section highlights the most prolific ransomware gangs by number of victims added to each group’s DLS. Qilin reclaimed the top spot (accounting for 14.57% of total listings) after placing second last quarter. It is followed by the Akira ransomware (7.80%) and the DragonForce RaaS group (6.88%).
Number of each group’s victims according to its DLS as a percentage of all groups’ victims published on all the DLSs under review during the reporting period (download)
Number of new ransomware variants
In Q2, Kaspersky solutions detected four new ransomware families and 2538 new modifications. This signals a continued stabilization following spikes seen in Q1 and Q4 of last year.
Number of new ransomware modifications, Q2 2025 — Q2 2026 (download)
Number of users attacked by ransomware Trojans
Our solutions protected a total of 71,860 unique users from ransomware during Q2. Ransomware activity peaked in April, with 31,206 targeted users recorded during that month.
Number of unique users attacked by ransomware Trojans, Q2 2026 (download)
TOP 10 countries and territories attacked by ransomware Trojans
Country/territory*
%**
1
South Korea
0.87
2
Pakistan
0.76
3
China
0.71
4
Libya
0.49
5
Tajikistan
0.46
6
Turkmenistan
0.38
7
Cameroon
0.38
8
Indonesia
0.36
9
Bangladesh
0.36
10
Mozambique
0.34
* Excluded are countries and territories with relatively few (under 50,000) Kaspersky users.
** Unique users whose computers were attacked by ransomware Trojans as a percentage of all unique users of Kaspersky products in the country/territory.
* Unique Kaspersky users attacked by the specific ransomware Trojan family as a percentage of all unique users attacked by this type of threat.
Miners
Number of new miner variants
In Q2 2026, Kaspersky solutions detected 6067 new miner variants, almost twice the number for the previous reporting period.
Number of new miner modifications, Q2 2026 (download)
Number of users attacked by miners
In Q2, we detected attacks using miner programs on the computers of 213,003 unique Kaspersky users worldwide.
Number of unique users attacked by miners, Q2 2026 (download)
TOP 10 countries and territories attacked by miners
Country/territory*
%**
1
Mali
1.56
2
Senegal
1.54
3
Tanzania
1.32
4
Panama
1.04
5
Bangladesh
1.03
6
Ethiopia
0.87
7
Costa Rica
0.67
8
Bolivia
0.67
9
Côte d’Ivoire
0.65
10
Kazakhstan
0.62
* Excluded are countries and territories with relatively few (under 50,000) Kaspersky users.
** Unique users whose computers were attacked by miners as a percentage of all unique users of Kaspersky products in the country/territory.
Attacks on macOS
Quarterly highlights
In April, Aikido researchers reported a new attack by the GlassWorm stealer, which was distributed via malicious IDE extensions on the Open VSX Registry. The payload operated by installing a secondary malicious extension across all installed IDE environments on the host machine. Ultimately, this second-stage implant exfiltrated crypto wallet data, environment variables, and other secrets. It also installed a RAT on the infected device.
In May, Socket researchers uncovered a supply chain compromise involving the popular npm package art-template. As a result of the breach, the weaponized package injected the Coruna exploit kit into web applications it was used to build. Coruna targets iOS devices.
In June, Palo Alto Networks’ Unit 42 discovered FlutterShell, a new backdoor family that targets macOS devices. Developed with the Flutter framework, the malware leverages the WebView engine to load web pages that contain malicious JavaScript. On the client side, the backdoor registers bridge functions invoked by the loaded JavaScript that allow threat actors to execute arbitrary payloads on the victim’s device. Notably, the malicious applications successfully passed Apple notarization. Although the specific samples analyzed functioned primarily as adware, the underlying architecture permits the delivery of far more sophisticated malicious payloads.
TOP 20 threats to macOS
* Unique users who encountered this malware as a percentage of all attacked users of Kaspersky security solutions for macOS (download)
* Data for the previous quarter may differ slightly from previously published data due to some verdicts being retrospectively revised.
Detections of PasivRobber spyware continued their downward trend. Meanwhile, adware and traffic-routing utilities (categorized as NetTool) rose to the top of the rankings. Additionally, Q2 saw a noticeable spike in detections for the DirtyCow exploit frequently leveraged for iPhone jailbreaking.
TOP 10 countries and territories by share of attacked users
Country/territory
%* Q1 2026
%* Q2 2026
Brazil
1.13
1.13
China
1.04
1.28
Hong Kong
0.92
0.49
Singapore
0.85
0.19
France
0.62
1.18
Mexico
0.43
0.72
India
0.41
0.42
Thailand
0.40
0.24
Germany
0.33
0.71
The Netherlands
0.31
0.62
* Unique users who encountered threats to macOS as a percentage of all unique Kaspersky users in the country/territory.
IoT threat statistics
This section presents statistics on attacks targeting Kaspersky IoT honeypots. The geographic data on attack sources is based on the IP addresses of attacking devices.
In Q2 2026, the breakdown of attacking devices and sessions that targeted Kaspersky honeypots by protocol was as follows:
Distribution of attacked services by number of unique IP addresses of attacking devices (download)
The share of SSH attacks saw a slight uptick compared to the previous quarter.
Distribution of cybercriminal sessions in Kaspersky honeypots (download)
TOP 10 threats delivered to IoT devices
Share of each threat delivered to an infected device as a result of a successful attack, out of the total number of threats delivered (download)
As is typically the case, Mirai botnet variants continue to dominate the IoT threat landscape. Activity of another prominent botnet, Prometei, also saw an increase.
Attacks on IoT honeypots
the Netherlands, Germany, and The United States accounted for the highest proportions of SSH-based attacks during this period. While the top three countries remained the same as last quarter, their relative rankings shifted.
Country/territory
Q1 2026
Q2 2026
The Netherlands
17.57%
21.18%
Germany
10.34%
16.73%
United States
23.74%
6.76%
Bulgaria
1.10%
5.50%
Sweden
2.09%
4.93%
Panama
6.34%
4.67%
Luxembourg
0.16%
4.62%
Romania
5.82%
4.06%
Vietnam
3.50%
3.91%
India
6.05%
2.78%
The percentage of Telnet-based attacks originating from Pakistan continued to climb, knocking China down to second place.
Country/territory
Q1 2026
Q2 2026
Pakistan
27.31%
36.60%
China
39.54%
35.62%
Russian Federation
8.25%
8.75%
India
4.66%
4.19%
Brazil
3.30%
3.34%
United States
0.45%
3.03%
Indonesia
6.71%
1.52%
Philippines
0.36%
0.95%
France
0.17%
0.84%
Thailand
0.55%
0.66%
Attacks via web resources
The statistics in this section are based on detection verdicts by Web Anti-Virus, which protects users when suspicious objects are downloaded from malicious or infected web pages. These malicious pages are purposefully created by cybercriminals. Websites that host user-generated content, such as message boards, as well as compromised legitimate sites, can become infected.
TOP 10 countries and territories that served as sources of web-based attacks
The following statistics show the distribution by country/territory of the sources of internet attacks blocked by Kaspersky products on user computers (web pages redirecting to exploits, sites containing exploits and other malware, botnet C&C centers, and so on). One or more web-based attacks could originate from each unique host.
To determine the geographic source of web attacks, we matched the domain name with the real IP address where the domain is hosted, then identified the geographic location of that IP address (GeoIP).
In Q2 2026, Kaspersky solutions blocked 399,312,961 attacks launched from internet resources worldwide. Web Anti-Virus was triggered by 52,850,592 unique URLs.
Web-based attacks by country/territory, Q1 2026 (download)
Countries and territories where users faced the greatest risk of online infection
To assess the risk of malware infection via the internet for users’ computers in different countries and territories, we calculated the share of Kaspersky users in each location on whose computers Web Anti-Virus was triggered during the reporting period. The resulting data provides an indication of the aggressiveness of the environment in which computers operate in different countries and territories.
This ranked list includes only attacks by malicious objects classified as Malware. Our calculations leave out Web Anti-Virus detections of potentially dangerous or unwanted programs, such as RiskTool or adware.
Country/territory*
%**
1
Bangladesh
11.71
2
India
7.40
3
Tajikistan
7.13
4
Venezuela
7.05
5
New Zealand
6.58
6
Vietnam
6.34
7
Taiwan
6.28
8
Belgium
6.24
9
France
5.97
10
Hungary
5.92
11
Nepal
5.91
12
Portugal
5.86
13
Italy
5.77
14
Costa Rica
5.72
15
Canada
5.65
16
Qatar
5.61
17
Dominican Republic
5.52
18
Palestine
5.48
19
Greece
5.47
20
UAE
5.43
* Excluded are countries and territories with relatively few (under 10,000) Kaspersky product users.
** Unique users targeted by web-based Malware attacks as a percentage of all unique users of Kaspersky products in the country/territory.
On average during the quarter, 4.54% of users’ computers worldwide were subjected to at least one Malware web attack.
Local threats
Statistics on local infections of user computers are an important indicator. They include objects that penetrated the target computer by infecting files or removable media, or initially made their way onto the computer in non-open form. Examples of the latter are programs in complex installers and encrypted files.
Data in this section is based on analyzing statistics produced by anti-virus scans of files on the hard drive at the moment they were created or accessed, and the results of scanning removable storage media. The statistics are based on detection verdicts from the On-Access Scan (OAS) and On-Demand Scan (ODS) modules of File Anti-Virus and include detections of malicious programs located on user computers or removable media connected to the computers, such as flash drives, camera memory cards, phones, or external hard drives.
In Q2 2026, our File Anti-Virus detected 16,986,351 malicious and potentially unwanted objects.
Countries and territories where users faced the highest risk of local infection
For each country and territory, we calculated the percentage of Kaspersky users whose computers had the File Anti-Virus triggered at least once during the reporting period. These statistics reflect the level of personal computer infection in different countries.
Note that this ranked list includes only attacks by malicious objects classified as Malware. Our calculations leave out File Anti-Virus detections of potentially dangerous or unwanted programs, such as RiskTool or adware.
Country/territory*
%**
1
Turkmenistan
46.38
2
Cuba
29.70
3
Tajikistan
28.46
4
Afghanistan
28.19
5
Yemen
27.85
6
Burundi
26.82
7
Mozambique
25.01
8
Republic of the Congo
24.88
9
Syria
23.17
10
Uzbekistan
22.49
11
China
21.92
12
Nicaragua
21.60
13
Cameroon
21.47
14
Bangladesh
20.43
15
Democratic Republic of the Congo
20.25
16
Algeria
19.78
17
Uganda
19.48
18
Ethiopia
18.57
19
Tanzania
18.54
20
Mali
18.53
* Excluded are countries and territories with relatively few (under 10,000) Kaspersky users.
** Unique users on whose computers Malware local threats were blocked, as a percentage of all unique users of Kaspersky products in the country/territory.
On average worldwide, Malware local threats were detected at least once on 10.93% of users’ computers during Q2.
The AhnLab SEcurity intelligence Center (ASEC) is monitoring attacks targeting poorly managed Linux servers using multiple honeypots. Recently, ASEC identified cases where malware with propagation capabilities was used to install the XMRig CoinMiner. In these attack cases, malware such as ShellBot, MIG LogCleaner, and XHide were used. The threat actors created and used downloaders […]
Contents The AhnLab SEcurity intelligence Center (ASEC) analyzed attack logs from the second quarter of 2026 targeting MS-SQL server and MySQL server installations on Windows. This report summarizes the damage status, attack status, and the classification of the malware and tools used in the attacks. Purpose and Scope The targets are MS-SQL servers and MySQL […]
A cybercrime campaign combined a loader-as-a-service framework and DLL sideloading via a Go-compiled fake MpClient.dll, a novel evasion layer combination.
The percentage of ICS computers on which malicious objects were blocked continued to decrease, reaching 19.6% in Q1 2026. This is the lowest value in three years, and it is 1.4 times lower than in Q2 2023.
Percentage of ICS computers on which malicious objects were blocked, Q2 2023–Q1 2026
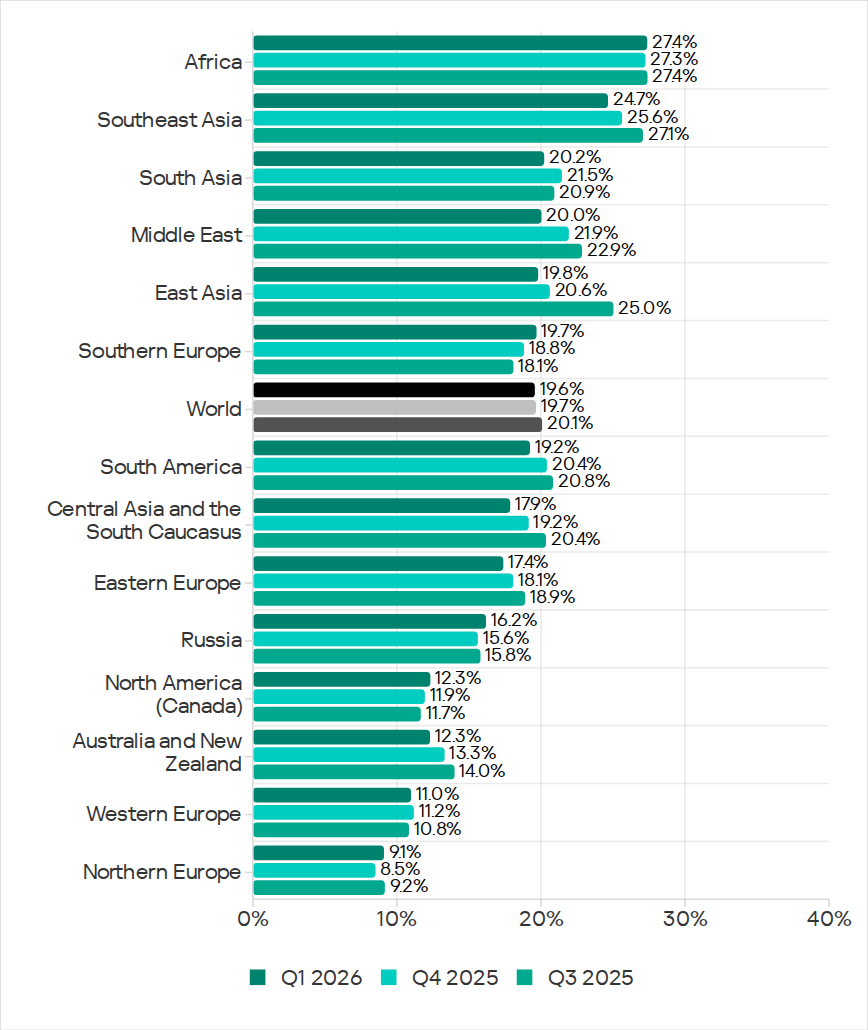
Regionally, the percentages ranged from 9.1% in Northern Europe to 27.4% in Africa.
Regions ranked by percentage of attacked ICS computers
The percentage of ICS computers on which malicious objects were blocked increased in five regions over the quarter, most notably in Southern Europe, Northern Europe, and Russia.
In Q1 2026, Southern Europe led the way in growth for internet and email threats. The region also saw the fastest growth in spyware, as well as malicious scripts and phishing pages.
In Russia, the percentage of ICS computers on which malicious objects were blocked exceeded the figures for the previous two quarters. Russia saw an increase in the percentage for threats from the internet, and a slight increase in the figure for threats from email clients (Russia is one of three regions where this figure did not decrease).
Among the threat categories, the greatest increases were observed in the percentages for denylisted internet resources, as well as spyware (distributed in the region via the internet and email clients).
Selected industries
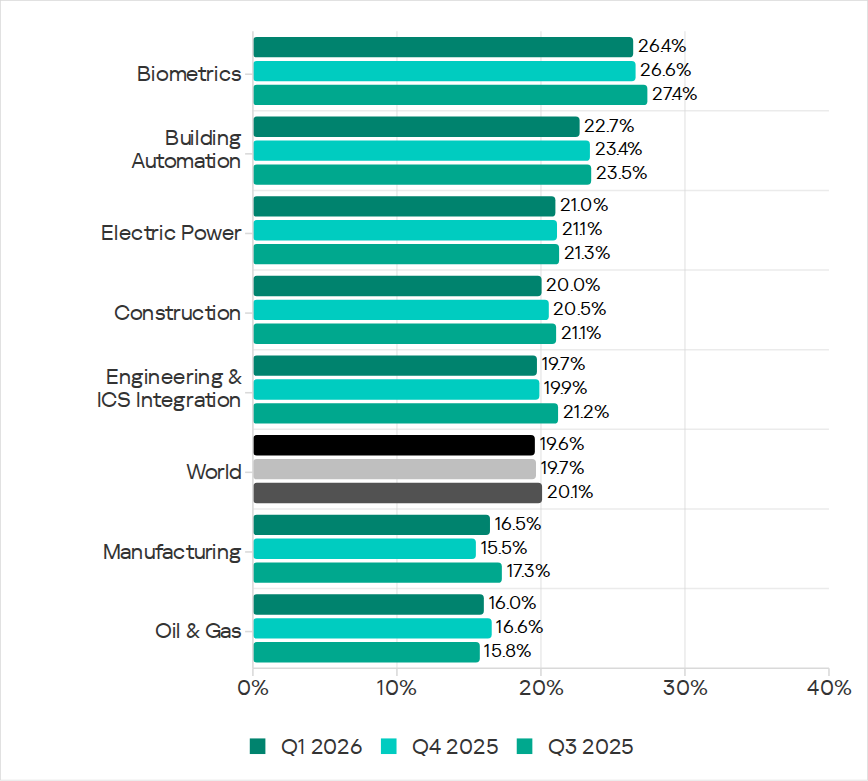
Biometric systems (26.4%) traditionally rank top among the industries and OT infrastructure types covered in this report in terms of the percentage of ICS computers on which malicious objects were blocked. These systems are characterized by internet access, extensive email use for data exchange and approvals (such as access granting), and, in many cases, minimal cybersecurity controls within the organizations that use these systems.
Industries ranked by the percentage of ICS computers on which malicious objects were blocked
Biometric systems rank first among industries in terms of email threats. At the same time, unlike other industries, the percentage for email threats in biometric systems exceeds that for internet threats.
In all selected industries, the global average follows a downward trend. In Q1 2026, the percentage of ICS computers on which malicious objects were blocked increased only in the manufacturing sector — by 1.0 pp. The percentages for this industry increased across 10 regions, with the most notable increases in Western Europe, Northern Europe, and Russia.
Threat categories
In Q1 2026, Kaspersky security solutions blocked malware from 10,052 different malware families of various categories on industrial automation systems.
Over the quarter, the percentage of ICS computers on which denylisted internet resources were blocked increased (after decreasing over the previous two quarters), and there was a slight increase in the percentage for AutoCAD malware.
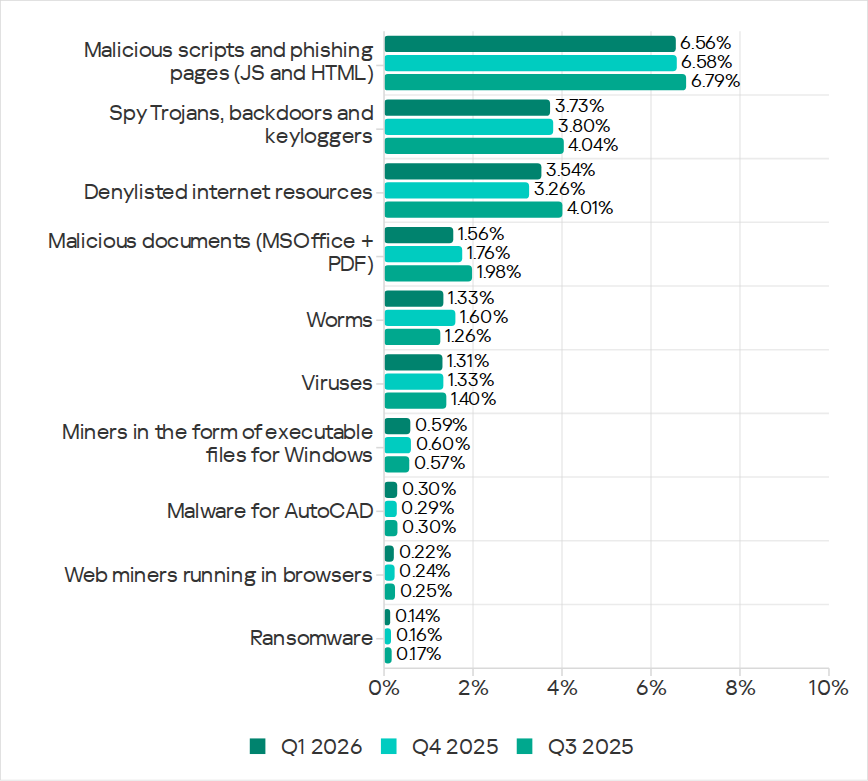
Percentage of ICS computers on which the activity of malicious objects from various categories was prevented
Malicious scripts and phishing pages (JS and HTML)
Malicious scripts and phishing pages retained their to spot among threat categories by the percentage of ICS computers on which these threats were blocked. The global average in Q1 2026 was 6.56%.
Over the quarter, the percentages increased in four regions. The most significant change was observed in Southern Europe (9.85%, +0.94 pp). The figures for malicious scripts in the region increased over three consecutive quarters.
Among the selected industries, across all regions, the highest percentages for the malicious scripts and phishing pages category were recorded for biometric systems (19.59%) and building automation (15.43%) in Southern Europe. These same industries lead in similar rankings for malicious documents and spyware.
Spyware
The percentage of ICS computers on which spyware was blocked decreased over two consecutive quarters, dropping to 3.73%. Despite the decline, spyware has ranked second among threat categories by the percentage of attacked computers for three consecutive quarters.
The percentages increased in five regions over the quarter, most notably in Southern Europe (5.46%, +0.35 pp) and Russia (2.84%, +0.24 pp).
In Southern Europe, the percentage of ICS computers on which spyware was blocked increased in all the selected industries except manufacturing. The greatest increase was observed in biometric systems.
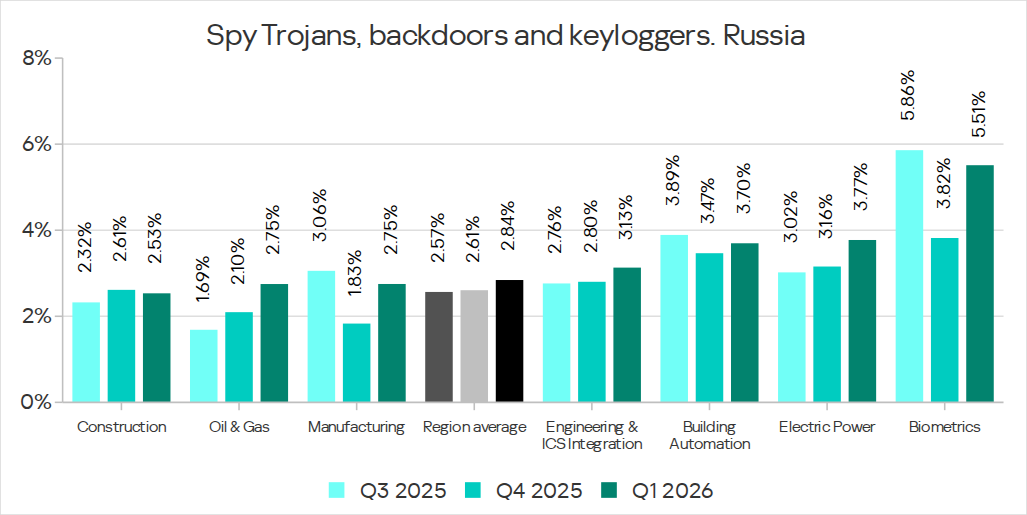
Among the selected industries, the highest percentage of spyware in Russia was recorded in biometric systems. That said, the percentage of ICS computers on which spyware was blocked increased in all industries in the region except construction. The percentage figure has been increasing for two consecutive quarters in the oil and gas industry (by a factor of 1.63 over six months), and for three consecutive quarters in engineering and ICS integration, as well as electric power. In the remaining sectors, the values have been fluctuating.
Percentage of ICS computers on which spyware was blocked in various industries in Russia, Q3 2025–Q1 2026
Denylisted internet resources
The percentage of ICS computers on which denylisted internet resources were blocked increased to 3.54%.
The most notable increase over the quarter occurred in Southeast Asia (4.58%, +0.65 pp). Among the industries in the region, the highest percentage figures for this threat category were recorded in electric power and construction. Over the quarter, the largest increases in percentages figures were observed in the electric power and manufacturing industries.
In North America (Canada), denylisted internet resources (2.14%) showed the greatest increase among all categories — by a factor of 1.22.
Among the selected industries across all regions, the highest percentage figures for the denylisted internet resources category were in the electric power (7.11%) and construction (6.25%) industries in Southeast Asia.
Malicious documents (Microsoft Office + PDF)
The percentage figure for this category decreased over two consecutive quarters, reaching its lowest value (1.56%) for the entire period of observations in Q1 2026. It increased just in two regions: Australia and New Zealand (1.12%, +0.04 pp), and Russia (0.62%, +0.01 pp).
Among the selected industries across all regions, the highest percentages for malicious documents were recorded for biometric systems (9.02%) and building automation (6.97%) in Southern Europe. These same industries also lead in similar rankings for malicious scripts and spyware.
Ransomware
The percentage of ICS computers on which ransomware was blocked has decreased for two consecutive quarters, dropping to 0.14%. This is the lowest value among all categories.
The percentage increased in two regions: North America (Canada) (0.11%, +0.04 pp) and slightly in Northern Europe (0.06%, +0.01 pp).
Among the selected industries across all regions, the highest percentages for ransomware were recorded in the oil and gas and manufacturing industries (0.92% and 0.65%, respectively) in Central Asia and the South Caucasus, and in biometric systems (0.89%) in Russia.
Miners in the form of executable files for Windows
The percentage of ICS computers on which miners in the form of executable files for Windows were blocked decreased to 0.59%.
The percentage increased in seven regions. The largest increase was observed in Africa (0.63%, +0.16 pp). Among the selected industries, the largest increases in the region were in the manufacturing and oil and gas industries.
Among the selected industries across all regions, the highest percentages for miners in the form of executable files were recorded in construction (1.99%), biometric systems (1.98%), and the oil and gas industry (1.97%) in Central Asia and the South Caucasus.
Web miners
The percentage of ICS computers on which web miners were blocked has been declining for a year, and in Q1 2026, it reached the lowest value for the entire period under review (0.22%).
At the same time, the percentage increased in seven regions. The largest increases were observed in South Asia (0.28%, +0.11 pp), the Middle East (0.31%, +0.09 pp), and Africa (0.34%, +0.08 pp). Despite the increases, the percentages in these regions for Q1 2026 did not exceed those observed in 2023–2024 and in Q1 2025.
Among the selected industries across all regions, the highest percentages for web miners were recorded for biometric systems (0.97%) in Russia. Biometric systems in South Asia (0.79%) ranked second, and the electric power sector in Southeast Asia (0.76%) ranked third.
Worms
The percentage of ICS computers on which worms were blocked decreased to 1.33%.
The percentage decreased across all regions following an increase in the previous quarter (due to a wave of phishing attacks that distributed the Backdoor.MSIL.XWorm backdoor worm across all regions of the world).
Among the selected industries across all regions, the highest percentage figure for worms was recorded for biometric systems (4.80%) in Central Asia and the South Caucasus. Two industries in Africa – biometric systems (4.04%) and electric power (3.53%) – took the second and third spots, respectively.
Viruses
The percentage of ICS computers on which viruses were blocked decreased to 1.31%.
The top 3 regions by this figure remained the same: Southeast Asia (6.11%, first by a wide margin), Africa (4.15%), and East Asia (2.97%). These same regions are also among the leaders by the percentage of systems affected by AutoCAD malware. The largest increase in this figure was observed in Africa (+0.41 pp).
Among the selected industries across all regions, the highest percentages for viruses were recorded in the construction industry (6.35%) and building automation (5.50%) in Southeast Asia.
Malware for AutoCAD
The percentage of ICS computers on which malware for AutoCAD was blocked increased to 0.30%.
The most notable increase over the quarter was observed in Africa, with the region’s percentage figure rising by 0.47 pp, a very significant increase for this category, and almost doubling (to 0.91%).
Among the selected industries across all regions, the highest percentages for AutoCAD malware were recorded in the construction industry in East Asia (5.58%) and Southeast Asia (3.87%).
Main threat sources
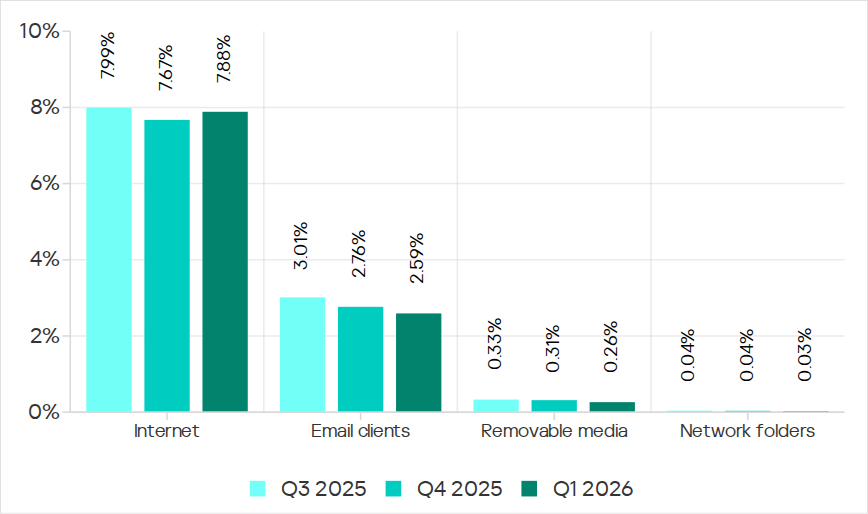
In Q1 2026, the average percentages across all threat sources, except threats from the internet, decreased globally.
Percentage of ICS computers on which malicious objects from various sources were blocked
Internet
The percentage of ICS computers on which threats from the internet were blocked increased to 7.88%. However, over the past three years, the percentage figure for internet threats has followed a downward trend.
The largest increases in the percentages were recorded in Southern Europe (8.59%, +0.59 pp), Southeast Asia (10.16%, +0.55 pp), and Northern Europe (4.47%, +0.51 pp).
Among the selected industries across all regions, the highest percentages for threats from the internet were recorded in electric power (13.16%) and construction (12.55%) in Southeast Asia, and in the engineering and ICS integration sector (12.33%) in South Asia.
Email clients
The percentage of ICS computers on which threats delivered via email clients were blocked decreased to 2.59%. This is a three-year low.
The percentage of this threat source increased in three regions: Southern Europe (6.54%, +0.2 pp), East Asia (1.5%, +0.09 pp), and slightly in Russia (0.7%, +0.04 pp).
Among the selected industries across all regions, the highest percentages for email threats were recorded for biometric systems (19.78%) and building automation (12.34%) in Southern Europe. In these two industries, the percentage of ICS computers on which email threats are blocked is higher than the percentage for threats from the internet. A similar situation was observed in two other instances, both in biometric systems (in South America and Southeast Asia).
Removable media
The percentage of ICS computers on which threats were detected when connecting removable media continued to decrease, reaching its lowest value for the period under review (0.26%).
Among the selected industries across all regions, the highest percentages for removable media threats blocked on ICS computers were observed in the electric power sector in Central Asia and the South Caucasus (1.45%), East Asia (1.34%), and Africa (1.16%).
Network folders
The percentage of ICS computers on which threats are blocked in network folders is steadily decreasing. In Q1 2026, it was the lowest for the period under review (0.029%).
East Asia has traditionally led by a wide margin. The percentage for East Asia (0.135%) is 27 times higher than the lowest regional value (recorded in Northern Europe).
The largest increases in the percentages for threats from network folders were observed in Africa (0.037%, +0.006 pp) and South America (0.013%, +0.006 pp).
Among the selected industries across all regions, the construction industry in East Asia, at 0.36%, holds the top positions in the ranking by the percentage of ICS computers on which threats are blocked in network folders.
The following analysis presents the key findings from Kaspersky Compromise Assessment engagements performed in 2025. A compromise assessment is an independent, expert-driven service that examines whether a target network has been compromised. The service combines threat intelligence analysis (including darknet sources), tool-aided endpoint scanning, a systematic review of security event logs and network traffic, and, when necessary, an initial incident response and digital forensic investigation.
This report focuses on missed incidents – threats that remained undetected for weeks, months, or even years.
Key trends observed during compromise assessment engagements
Proactive compromise assessment decreases the number of missed high-severity incidents. The highest proportions of high-severity incidents were revealed in organizations that requested our compromise assessment service after containing a known incident. The lowest proportions of high-severity incidents were observed in organizations that conducted regular audits. Of all the incidents discovered, 20% were found manually, while enterprises missed 60% because of the absence of high-confidence alerts from the tools in place.
Nearly a third of discovered incidents took over three months to detect. The longer a threat persisted in the target environment, the greater the likelihood that an incident would be severe. 30.8% of all discovered incidents and 52% of high-severity compromises had historical activity spanning over three months. The oldest incident discovered in 2025 had gone undetected for four years.
Malicious files often remain in backups and are restored after incident response activities. 40% of all discovered web shells resided in backups and went unnoticed until a proper compromise assessment was conducted.
Threat actors rely on remote management tools and LoLBins. These types of tools were found in all compromise assessment engagements that resulted in an incident detection.
Monitoring tools and controls are not self-sufficient; operational maturity makes the difference. Monitoring tools must be configured and adapted to the changing threat landscape. Furthermore, human analysts need to review low-confidence alerts. A lack of continuous monitoring and threat hunting activities increased the likelihood of high- and medium-severity incidents to 84–86%. At the same time, high‑severity incidents were rare among organizations with in-house capabilities to reverse-engineer malware.
Communication issues lead to missed incidents. Nearly a third of the compromise assessments revealed communication issues that impacted incident response activities.
The incident response playbook is not set in stone. For incident response to be efficient and effective, playbooks must be updated as new artifacts are discovered. Treating the incident response plan as a living document reduces the risk of missing threats.
About the Kaspersky Compromise Assessment service
Our global compromise assessment portfolio spans several regions. In 2025, around 71% of the incidents we identified affected our customers in the META region, while the APAC and CIS regions accounted for the remaining 29%.
Geographic distribution of incidents identified during Kaspersky Compromise Assessment projects in 2025 (download)
Our service was requested by organizations from a diverse set of sectors. The government sector accounted for around 29% of incidents, followed by the education (19%) and financial (17%) sectors.
Distribution of economy sector incidents identified during Kaspersky Compromise Assessment projects in 2025 (download)
Detection logic families
Our compromise assessments operate on a continuously updated catalogue of indicators of attack (IoAs). Because the raw set of IoAs is too granular for high-level reporting, we map them to a concise set of detection logic families. The statistics indicate that three detection families dominate the incident mix:
Credentials from dumps: 12.4% of all incidents;
Specific living-off-the-land (LOTL) tools: 11.2 %;
Specific malware families: 11.2 %.
These three detection logic families represent high-fidelity indicators of attack that reliably signal infrastructure compromises ranging from dormant, disk-based malware to persistent and multi-stage attacks.
Distribution of detection logic families (download)
Reasons for requesting Kaspersky Compromise Assessment services
Analysis of our compromise assessment engagements that took place in 2025 reveals a clear correlation between the stated purpose of the engagement and the risk profile of the findings. General audits dominate the portfolio with 56% of requests, followed by authority reporting engagements (19%), post-incident checkups (17%), and acquisitions (9%).
Statistics on the reasons behind CA project requests (download)
When the findings are classified by severity, the post-incident checkup category exhibits the highest proportion of high-severity incidents (40.7%). The full breakdown is shown below.
Incident severity breakdown by service engagement reason
Incident severity (%)
High
Medium
Low
Reason for service
Acquiring new company
28.6
42.8
28.6
General audit
27.7
36.7
35.6
Report to an authority
30
46.7
23.3
Checkup after a cybersecurity incident
40.7
25.9
33.4
Post-incident checkups are frequently initiated after an initial incident response (IR) effort. The elevated share of high-severity findings suggests that IR activities, which are typically limited to containing a known incident, do not provide a complete view of the broader environment. Consequently, other threats may remain undetected until a full compromise assessment is performed.
Merger and acquisition-related assessments are proactive assessments performed when a company acquires another entity. This involves the target’s network being scanned for hidden threats before the two environments are merged. These assessments demonstrate a balanced distribution of severity: 28.6% low-severity, 42.8% medium-severity, and 28.6 % high-severity. This reflects the mixed risk posture of target environments of acquisitions, which are often evaluated for both known vulnerabilities and hidden malicious activity. Similarly, other proactive approaches like general audit assessments or assessments driven by the need to regularly submit a compliance report to a regulatory authority, share almost the same ratio. This indicates that regular, proactive and compliance-oriented assessments tend to reveal substantive issues earlier in the attack lifecycle, reducing the likelihood that they will evolve into high-severity incidents.
Organizations that conduct regular audits have the highest rate of low-severity findings (36%) and the lowest rate of high-severity issues (28%). We can assume with medium confidence that continuous, proactive compromise assessments are more effective at limiting the emergence of high-severity compromises than reactive, incident-driven evaluations. The data collected in 2025 are consistent with this hypothesis. Integrating regular, third-party compromise assessments into governance processes can therefore reduce the probability of unexpected high-severity findings and improve overall risk posture.
The following case study illustrates the impact of relying on a reactive rather than proactive approach. It describes a persistent threat that remained dormant on a client’s network and was only discovered after a comprehensive compromise assessment was performed following initial IR activity.
Case study: Dormant threat uncovered only by a compromise assessment
A midsize enterprise suffered a high-severity intrusion that was contained and remediated by the IR team within the defined scope of the initial alert. Following containment, the organization requested a check to determine if any additional footholds existed elsewhere in the network. To address this need, the organization engaged Kaspersky’s Compromise Assessment (CA) service, which performed a full forensic review of the environment beyond the scope of the initial incident.
Compromise assessment experts collected forensic metadata, historical security event logs, and Active Directory configuration data from the entire infrastructure. Threat hunting queries were executed against the aggregated telemetry, focusing on persistence mechanisms, lateral movement artifacts, and anomalous process activity. As a result, a number of severe threats were detected and reported; for example, malicious persistence:
A cron job that recreates a web shell
A critical Linux system (web server) had a cron job that automated fetched a copy of a PHP web shell from a public GitHub repository and placed it in an online directory. Even if the file was removed by security personnel, the cron job would simply download it again, giving the attacker a persistent remote code execution point on the web server.
A live reverse shell
On a server hosting a published web application, the process list showed a bash reverse shell.It was run by a user with the username “apache,” which was the account used to run the web application. This may indicate that the attacker exploited a vulnerability in the web application to gain remote code execution, allowing them to establish a reliable command and control channel that bypassed the firewall because it was initiated from inside the network.
ClipBanker data stealer persisting via Windows registry
A ClipBanker variant was detected on a user’s workstation machine maintaining persistence by adding itself to the registry key HKU\S-1-5-21-[REDACTED]-500\Software\Microsoft\Windows\CurrentVersion\Run\9Er6IIp.
This was done after adding the malware’s folder to Windows Defender exclusions and applying hidden and system attributes to the file to hide it from regular users.
Malicious WMI event consumer with deceptive alias
A malicious WMI event consumer was detected that downloads and executes a PowerShell script. It created the alias “Kaspersky” for “Invoke-Expression” in an attempt to blend in as legitimate activity in the hope that a quick glance at the script would not raise suspicion. Kaspersky’s Cyber Threat Intelligence confirmed that the downloaded script (no longer reachable) was a weaponized payload used to spread the infection further.
The IR containment was rapid, focused and effective in addressing the specific incident that triggered the alert. However, the broad-scope compromise assessment revealed multiple backdoors across the environment, each using a different persistence technique: cron jobs, scheduled registry runs, and WMI subscriptions. The infected hosts were outside the original IR scope, so they remained unseen until a comprehensive hunt was conducted.
Incident response excels at stopping the bleeding and ensuring business continuity after a known incident. A compromise assessment provides a health check that determines whether any other wounds exist. By pairing timely IR with regular, full network compromise assessments, the organization had both the reactive agility to contain incidents and the proactive visibility to eradicate malicious persistence wherever it was hiding. The investigation uncovered additional undetected footholds, providing a clearer view of the environment and reducing the likelihood of a repeat incident.
Missed long-term incidents
The statistics on the mean time to detect (MTTD) incidents identified during compromise assessment projects are concerning. Many incidents go unnoticed for extended periods. For example, in 2025 we identified an incident that was approximately four years old!
Such prolonged detection times can lead to severe consequences, as 30.8% of incidents have historical activity spanning over three months. These incidents can range from dormant malware to persistent threats, highlighting the need for robust detection and response mechanisms.
Severity distribution of incidents by MTTD (download)
The relationship between detection latency and incident severity was analyzed by grouping findings according to their MTTD:
For incidents detected within the first month, severity is more or less evenly distributed among the low, medium and high categories.
However, as the MTTD increases, the severity of incidents shifts towards higher severity. Notably, a high proportion of incidents that took between 30–60 days to be detected are medium-severity incidents (78.57%), while those detected between 60–90 days are predominantly high-severity (71.43%).
Among incidents detected after 90 days, a significant proportion are also high-severity incidents (52%).
Overall, 52% of high-severity incidents are only identified after 90 days of going undetected. This represents a concrete risk: the longer an incident goes undetected, the higher the probability of severe compromise. Organizations that integrate continuous detection, threat hunting activities, and regular compromise assessments can reduce MTTD, limit threat escalation, and lower their overall risk profile.
The following case study highlights the importance of timely detection and response to prevent incidents from escalating into high-severity events.
Case study: Four-year-old crypto mining activity on domain controllers
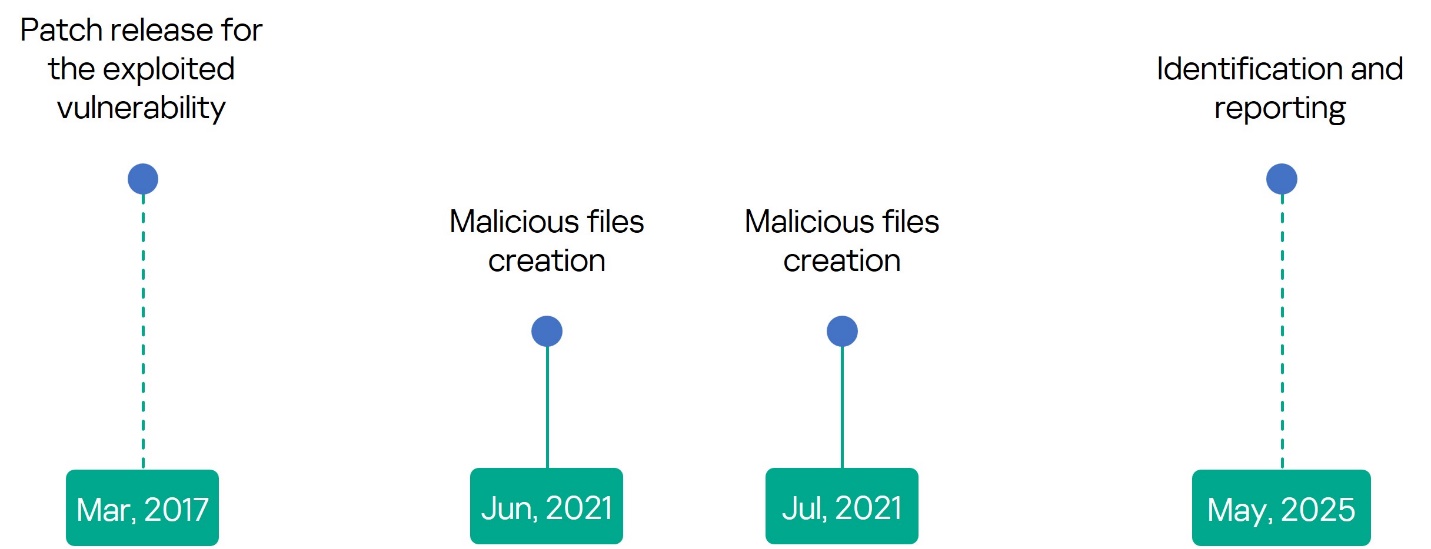
In May 2025, our compromise assessment experts identified three domain controllers on a customer network that were infected with malicious files. The files had remained hidden for almost four years. They were created in the C:\Windows\Fonts\Mysql directory, abusing its unique characteristic whereby only font files in this directory are visible to regular users. Files with the names nei.bat, dl1host.exe, bat.bat, cmd.bat, and a spoofed svchost.exe were found there. These files were created in June and July of 2021.
Kaspersky Threat Intelligence confirmed that these files are part of a crypto-mining campaign called NSABuffMiner, which spreads via the SMB protocol by exploiting the EternalBlue (MS17-010) vulnerability. A patch was released for this vulnerability in March 2017, four years before the initial compromise. This was more than enough time to patch the systems. This underscores the importance of implementing effective patch management operations and staying informed through threat intelligence news feeds.
Based on the organization’s request, the malicious files were collected along with a forensic image for analysis and revealed the following:
bat.bat and cmd.bat generate random IPs and scan them with a lightweight port scanner renamed taskhost.exe to locate live hosts with SMB port 445 and NetBIOS port 139 open and looking for vulnerable machines.
Discovered vulnerable IPs are handed to helper scripts named bat, poab.bat, load.bat, and loab.bat that execute the malware mance.exe, Eter.exe, and puls.exe to inject the malicious DLLs Eternalblue2.dll and Doublepulsar2.dll into lsass.exe and explorer.exe, enabling lateral movement.
Persistence is then established by creating scheduled tasks to execute the propagation and infection scripts, and services are created to execute the crypto miner, with the names MicrosoftMysql, MicrosoftFonts, and MicrosoftMSSql. Other scheduled tasks were also observed with the names At1 and At2 and created for the same purpose.
After successfully compromising the machine and installing the persistence mechanisms, a cleanup task is performed to delete temporary files and dropped malware.
Because of the lack of proper monitoring and threat hunting procedures, the organization was unaware that a mining operation had been hijacking their resources for four years, running on their domain controllers.
Unintentional malware preservation
An issue that is frequently discovered during compromise assessment activities is that of web shells remaining or being restored on target systems. Based on data collected during 2025 compromise assessment engagements, 64% of web shell incidents were classified as high-severity findings, 7% as low-severity (possibly legitimate files, but potentially compromised), and 29% as medium-severity findings requiring eradication.
Web shell incident distribution by severity (download)
One way web shells persist is through infected backups. The distribution of discovered incidents in our projects shows that 60% of the web shells were located on active systems, while 40% were stored in backups. Restoring such backups can reintroduce the threat long after the initial infection.
Another common issue is asset inventory gaps, which were observed in 25% of engagements. This resulted in untracked devices, particularly cloud-only Linux web servers that are not joined to Active Directory, evading routine scans.
An attacker can plant a web shell on such a cloud server, and that server never appears in the inventory, though is still regularly backed up. As a result, the web shell may persist on the cloud server for a long time. If it is occasionally deleted, the backup server later restores the infected files, exposing the web shell to third parties again. This demonstrates that without a complete and up-to-date asset inventory, detection capabilities are significantly impaired.
One case was observed in which the web shell was located on an internal file server (not a web server) within a .rar archive at the following path: D:\backup\[redacted_for_privacy].rar/wwwroot/<…>/[redacted_for_privacy].aspx
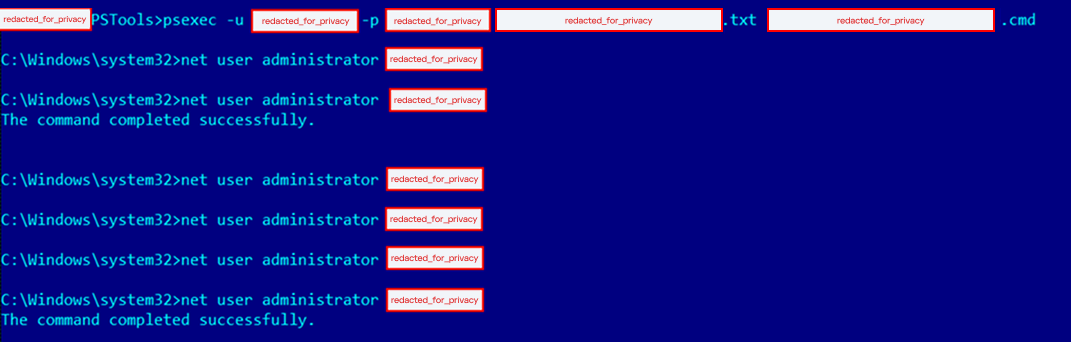
During the investigation, the server administrators indicated that the folder had been copied from a different server that was offline at the time of the assessment. Because of poor asset inventory, the company’s security team did not detect the infection of this server. As a result of the backup procedure, the web shell was copied to the internal file server. Forensic analysis of the offline server revealed that the adversary had introduced a backdoor to the majority of the Windows servers in the environment, configuring the local administrator account with an identical password.
The technique involved using PsExec to execute a .cmd script across all the servers listed in a .txt file; the script altered the local administrator password to a common value:
Legitimate, yet suspicious: LoLBins and remote management tools
In 2025, nonstandard remote management (RM) utilities were observed in all compromise assessment engagements. Living-off-the-land binaries (LoLBins) were also present in every engagement. These findings highlight the ongoing challenge for security operations centers (SOCs) that must distinguish between legitimate administrative use and malicious abuse.
The observed remote management utilities span both proprietary platforms, such as TeamViewer and AnyDesk, and freely available tools, including PsExec, VNC servers, and open-source RM frameworks. These binaries are used daily in many environments for troubleshooting, software deployment, or remote support. However, the same capabilities – creating a new local admin account, copying files to a remote share, or launching a network port scan for diagnostics – are also typical of attacker post-exploitation activity. Our analysts frequently encounter cases where a legitimate sysadmin action resembles a lateral movement step. This makes the mere fact that “a remote management tool was executed” insufficient to classify it as an incident. Instead, the incident must be judged against an organization-specific baseline of expected usage. Establishing that baseline requires a deep, contextual understanding of who is authorized to run the tool, from which endpoints, and under which circumstances – a resource-intensive process on a case-by-case basis.
LoLBins, binaries that are part of the operating system or commonly installed utilities (such as certutil, bitsadmin, regsvr32, and wmic), were also present in every assessment. While these files are trusted system components, threat intelligence confirms they are often repurposed for lateral movement, data exfiltration, and persistence. The graph below shows the severity distribution for incidents involving riskware or a LoLBin binary. The relatively high share of medium- (40%) and high-severity (31%) findings underscores that misuse of legitimate utilities is often the vector that enables a compromise to progress beyond the initial foothold.
Severity distribution of incidents involving riskware or LoLBin involvement (2025) (download)
To address the potential use of LoLBins and remote management tools by attackers, we recommend a multi-layered approach that goes beyond static deny lists:
Formalize a policy that enumerates the remote management tools authorized for use. The policy must be coupled with a requirement to forward software operational logs to a central log management platform (SIEM or dedicated log collector). Continuous monitoring of these logs enables a SOC to detect deviations from authorized usage patterns.
Periodically perform a software inventory audit to identify unauthorized remote management tools. Consider collecting data from the following registry keys on all hosts:
Enrich the hashes (MD5/SHA-256) of every executed binary with a functional category, such as “Remote Access”, “Golden Image”, or “Security Software.” Correlating the category with the execution path makes it possible to hunt for instances where a “Remote Access” binary runs from a non-standard location, such as %TEMP% or a user’s Downloads folder.
Deploy detection rules that capture known LoLBin abuse patterns, such as certutil -decode, bitsadmin -transfer, regsvr32 -i <dll>, wmic process call create. These rules should be continuously baselined against the organization’s normal activity. The baseline is derived from a period of verified legitimate use and refreshed whenever new legitimate use cases emerge. Alerts are generated only when observed behavior diverges from the established norm, thereby reducing noise while preserving sensitivity to genuine abuse.
Impact of not having continuous monitoring and proactive threat hunting
Analyses of recent compromise assessment projects reveal a systematic blind spot in organizations that follow the security-by-purchase model to defend their networks. Without continuous human monitoring or a dedicated threat hunting program, the severity profile of detected incidents becomes heavily skewed toward a higher impact:
Incident severity breakdown, where 24/7 monitoring or threat hunting is absent
Control type
Low-severity
Medium/high-severity
No continuous monitoring
14%
86%
No threat hunting
16%
84%
Often, the problem is not a lack of tools, but rather a lack of operational use of those tools. Many enterprises deploy next-generation security solutions and then let them run in “set-and-forget” mode, or they rely exclusively on an alert-driven workflow. The following issues are common in such organizations:
Alert fatigue: high false positive rates drown analysts in noise, forcing them to triage superficial indicators rather than conduct deep, contextual investigations.
Fragmented analyst assignment: without a dedicated hunting team, the same analyst may be tasked with dozens of unrelated alerts, limiting the time available for the hypothesis-driven exploration required to uncover stealthy footholds.
The practical consequence is that adversaries retain an extended dwell time, enabling continued lateral movement and data exfiltration before the organization becomes aware of the breach. This pattern represents a measurable risk exposure that translates directly into business impact. As the following example illustrates, merely purchasing security controls does not guarantee detection; continuous monitoring, regular alert validation, and structured threat hunting are essential to reduce dwell time and limit business impact.
Case study: Secure by design without continuous monitoring
The enterprise invested in security controls and assumed that the environment was secure by design. However, security controls require proper configuration, continuous tuning, and active monitoring to be effective. The tools had been installed, but no one was ensuring that the security controls were configured effectively, there was no analyst reviewing the alerts they produced, and no schedule existed to review the collected logs.
The organization opted for Kaspersky’s Compromise Assessment service. Historical security logs were collected and investigated as part of the assessment procedures. The goal was simple: to determine what had really been going on in the network over the previous few months.
Log analysis revealed clear evidence of malicious activity. Activities related to Impacket behavior were discovered that led to the deployment of Cobalt Strike and Mimikatz on several critical servers, including the domain controllers. These activities were three months old at the time of detection, and the enterprise was unaware of them because there was no effective 24/7 monitoring in place.
Impacket is a collection of Python scripts for network protocols and low-level network packet manipulation. Attackers can abuse it to move laterally into the network. The following are examples of its artifacts detected in the network:
The attacker used Impacket to execute a PowerShell command that downloaded an executable from a command-and-control server. This server was found to be associated with Cobalt Strike. Cobalt Strike is a post-exploitation tool that provides capabilities for remote command execution and lateral movement within a compromised network. The execution was set up via a scheduled task that attempted to masquerade as a legitimate Google Chrome update task.
The timeline assessment confirmed the presence of a Mimikatz binary and a memory dump associated with the same incident on the compromised system, confirming that a credential theft operation had indeed taken place.
The organization was completely unaware of the breach. The activity had gone undetected for three months because the deployed controls were never monitored. Upon learning of the findings, a full-scale incident response was initiated to eradicate the footholds, rotate credentials, and harden the security of the environment.
Security controls are not self-sufficient. Deploying a firewall or an EDR solution does not automatically protect you. Without proper configuration, baseline tuning, and, most critically, continuous log monitoring and threat hunting, those controls become merely decorative. Always-on monitoring, either performed internally or delegated to an external managed security service, can turn weeks-old compromises into minutes-old alerts by correlating events, hunting for anomalous use of penetration testing or hacking tools, and escalating suspicious activity.
Incident response action statistics
An analysis of historical compromise assessment projects reveals a persistent discrepancy between the best practices described in incident response playbooks and the operational realities of executing them in unprepared, often legacy-affected environments. The figure below shows how frequently each response action was required during the initial response phase of a compromise assessment.
Incident response actions required after compromise assessment (download)
The distribution highlights three frequently observed patterns:
Forensic analysis accounts for the majority of cases, with around 59% requiring at least one forensic package collection and analysis.
Remote eradication, i.e., file or registry key removal, was reported in 39% of cases.
Plans evolve as the investigation proceeds; 39% of engagements required a mid-engagement plan update, reflecting the iterative nature of incident response.
Why forensic collection is the default entry point
Forensic package collection and analysis was the most frequent response action, occurring in 59% of cases. The prevalence of forensic package collection can be explained by two observable factors in CA engagements: (1) the targeted organization’s limited historical visibility and (2) the fact that a substantial proportion of incidents were older than 90 days at the start of the assessment. In many cases, native logs had already been rotated or purged, forcing investigators to rely on residual artifacts (e.g., MFT entries, registry hives, filesystem timestamps) to reconstruct timelines.
Our observations suggest that remote forensic package collection is effectively a prerequisite rather than an optional convenience. The graph below summarizes the reported ability to collect forensic packages, categorized by incident severity level. It highlights that, in a significant proportion of high-severity cases, the affected organization lacked this capability.
The organization’s ability to collect forensic data by incident severity (download)
Containment: The remove files/registry keys paradox
Response execution and eradication actions, such as file or registry key removal (reported in 39% of cases), were also common. However, they highlighted a notable gap in execution practices. While many organizations reported having EDR capabilities for remote removal, execution was often delegated to IT teams or MSPs via ticketing systems. This can introduce delays and reduce the precision of the removal process. Malware removal is a surgical process, particularly in multi-stage, fileless, or persistence-heavy scenarios. Capability alone is insufficient without expertise, sequencing, and planning, especially when artifacts may exist in shadow copies, backups, hidden paths, or downloader chains.
Communication failures: An additional operational overhead
A notable organizational finding emerged regarding communication. In 32% of projects, internal communication issues at the assessed organization materially impacted response execution. Below are the typical blockers:
Unclear action confirmation – system administrators could not quickly confirm whether a suspicious file was legitimate.
Delayed owner validation – ticket escalations stalled while waiting for system owners to respond.
Compromised communication channels – email accounts or ticketing portals may already be under the attacker’s control in the event of a suspected domain compromise.
Staff turnover – loss of knowledge about historical configuration baselines.
These findings suggest that regular tabletop exercises are required to test not only technical playbooks, but also human and communication workflows, as well as operational level agreements that govern and facilitate communication between different teams, and standard operating procedures for proper documentation.
The iterative nature of response plan updates
The need to update response plans based on new analytical input arose in 39% of cases, emphasizing the inherently iterative nature of incident response. Early-stage plans cannot realistically account for all variables. Examples of the most commonly observed causes for updating the response plan are listed below:
Reverse engineering results that reveal previously unknown command-and-control (C2) servers or behaviors.
Forensic discoveries, such as hidden scheduled tasks, shadow-copy artifacts, or dormant DLLs.
Traffic analysis outcomes that expose additional lateral movement paths.
Human constraints – unavailable system owners, changes in management processes, or supervisor approval.
Based on our experience, teams that treat the IR plan as a living document – incorporating each new artifact, reprioritizing actions, and reissuing the playbook before the next containment step – reduce the risk of missed eradication steps. Conversely, strict adherence to an initial, evidence-limited plan can increase the risk of overlooking persistent footholds.
Distinguishing real attacker artifacts from penetration testing leftovers
Finally, distinguishing attacker activity from penetration testing artifacts remained a recurring challenge (12% of cases). Compromise assessments frequently uncover remnants of legitimate testing tools, which can create uncertainty about whether a detected artifact originated from a malicious intrusion or a legitimate penetration test. Contributing factors:
Poorly documented penetration test report and artifact cleanup.
Overlapping toolsets (e.g., SharpHound) used by both red team operators and adversaries.
Running compromise assessments and active penetration testing projects simultaneously, which degrades analyst focus and increases false positive rates. Although correlating findings with penetration testing reports is essential, compromise assessments are human-driven investigative processes, and confusing analysts with overlapping “legitimate” attack signals leads to misinterpretation and weaker outcomes.
Incident response maturity and its effect on severity
Our data show a correlation between the presence of internal digital forensics or malware reverse engineering capabilities and the distribution of incident severity categories. Across the 2025 compromise assessment engagements, the distribution of low-, medium- and high-severity findings differed markedly between organizations that possessed these capabilities and those that did not. The data below illustrate this correlation and provide a basis for assessing the business value of expanding internal response skill sets.
Incident severity split for cases requiring digital forensics, based on an organization’s capabilities (download)
Organizations capable of analyzing digital forensic artifacts independently experienced half as many high-severity incidents and a higher proportion of low- and medium-severity cases.
Incident severity split for cases requiring malware analysis, based on an organization’s capabilities (download)
The presence of a dedicated reverse engineering resource correlates with a total absence of high-severity cases in our sample set; the majority of incidents were rated as medium severity, with a significant proportion of low-severity outcomes.
The analysis of this correlation indicates, with medium confidence, that the observed shifts are unlikely to be caused solely by sample size effects. Rather, they are more likely to reflect a genuine operational phenomenon: internal digital forensics and malware analysis capabilities contribute not only to SOC processes, but also to cyber-resilience in general.
Case study: In-memory LionTail infection on critical Windows servers
During a compromise assessment, a persistent in-memory threat was identified on several critical servers. The activity was attributed to the LionTail framework, a sophisticated set of custom loaders and memory-resident shellcode implants. LionTail takes advantage of undocumented Windows HTTP.sys driver behaviors to covertly deliver and retrieve payloads via inbound HTTP traffic, effectively blending malicious activity into legitimate network flows.
Several observed variants are attributed to the Scarred Manticore actor, which generates a unique implant per compromised host and performs data exfiltration while carefully masking command-and-control communications within normal-looking traffic.
Detection was achieved through static memory signatures discovered within the scrcons.exe process. Although scrcons.exe is a legitimate WMI host binary located under C:\Windows\System32\wbem, it is frequently abused to host injected payloads, making it an attractive target for stealthy in-memory operations.
The response plan comprised a number of actions, the most critical of which are highlighted below:
Collection of volatile memory dumps for in-depth analysis.
Acquisition of full forensic disk images from affected systems.
Detailed analysis of the collected artifacts and subsequent updates to the incident response plan.
Executing these actions proved challenging for the organization because of its limited digital forensics and reverse engineering capabilities. In incidents dominated by fileless memory-resident threats, these capabilities are not optional – they are essential. Without them, organizations risk losing critical evidence, misjudging the scope of the compromise, or failing to fully eradicate advanced implants that leave minimal traces on disk.
While our specialists were able to complete the investigation and contain the breach, the case revealed a readiness gap. It demonstrated the operational risk of depending on external assistance during high‑impact incidents and reinforced the necessity of in‑house forensic and reverse‑engineering maturity to achieve timely, confident and comprehensive incident handling.
Solving the root cause problems
Upon completion of a compromise assessment engagement, the focus shifts from incident response to a consulting phase. The final workshop focuses on preventing recurrence of incidents by identifying underlying deficiencies that allowed them to go unnoticed. The recommendations are actionable and tailored to the environment. For the purpose of this report, they have been grouped into a limited set of high-level categories.
Root-cause category
Share of incidents
Typical findings
Insufficient detection fidelity
60.7%
• No high-confidence alerts were generated by the EPP/EDR or related log sources.
• In 9.4% of cases, the product was mis-configured or out of date or malfunctioning.
Missing alert-driven monitoring
35.9%
• Alerts that could have indicated compromise were generated, but an incident was not declared.
• Signals with high uncertainty (e.g., heuristic web shell detections) required analyst validation.
Deficient vulnerability and configuration management
28.2%
• Evident misconfigurations (e.g., disabled audit logging, over-permissive service accounts).
• Known vulnerabilities left unpatched or unmitigated.
Lack of structured threat hunting processes
27.4%
• Low-fidelity alerts were never reexamined after initial dismissal.
• High-volume telemetry remained unchecked due to staffing constraints.
Inadequate security awareness programs
25.6%
• Credential leaks from personal devices of employees or contractors accounted for 27.2% of incidents where inadequate security awareness was identified.
• Social engineering attempts were successful because of insufficient user training.
Absence of documented policies/processes
23.9%
• No formal incident response playbooks, change management procedures or data handling guidelines were available.
Common observations on root causes
The detection health check was the most frequent corrective action. In more than half of the cases where alerts were missing, a simple verification of sensor health and rule relevance was recommended to fill the gap. Without such validation, immediate attribution of the failure to the product capability could not be made.
Human analysis is still essential for low-confidence alerts. Automated pipelines alone cannot compensate for rules prone to false positives (e.g., generic web shell heuristics). Embedding a manual triage step was recommended to reduce the dwell time for incidents.
Process hygiene (vulnerability management, threat hunting, security policies) accounts for a substantial proportion of the root causes. Even mature organizations exhibited gaps in routine activities that could be mitigated with disciplined workflows. The absence of documented policies/processes was the root cause of 23.9% of cases.
A modern example of a policy gap is the use of generative AI development tools that operate without clear data handling rules. During one project, we identified a macOS workstation that executed the Claude Code (Anthropic) command-line assistant as a VS Code extension. The tool automatically captured filesystem snapshots to enrich its language model prompts. These snapshots included full directory listings and absolute paths to several Excel workbooks containing internal confidential data:
ls -lh /Users/[REDACTED]/Documents/[REDACTED].xlsx /Users/[REDACTED]/Documents/[REDACTED].xlsx /Users/[REDACTED]/Documents/[REDACTED].xlsx .. [REDACTED]
The organization was advised to conduct awareness sessions for employees on the risk of exposing confidential internal data to generative AI tools, and to develop a policy governing the use of such tools with confidential information.
Lack of detections: Causes and impacts
Compromise assessment engagements repeatedly show that insufficient detection fidelity is a significant contributing factor to high-severity incidents. In cases where the target organization’s detection coverage was rated low, 52% of incidents were classified as high severity and 15% as low severity. This suggests a correlation: limited visibility appears to increase the proportion of incidents that evolve into high-severity compromises.
Incident severity distribution when detection coverage was insufficient (download)
A common assumption is that engaging a managed security service provider (MSSP) improves detection maturity. The data, however, show a more nuanced picture. Even when an MSSP is engaged, 26.5% of incidents related to low detection coverage remain unidentified, and roughly 50% of MSSP-supported projects have basic Windows audit gaps (e.g., missing event log collection or disabled audit policies).
These findings suggest that outsourcing alone does not guarantee effective detection; active governance and continuous validation are required. Detection should be treated as an evolving capability that requires continuous testing, measurement, and refinement, irrespective of whether it is managed internally or by a third party.
Statistics of missed incidents due to lack of detection capability with or without MSSP (download)
The analysis of root causes of missed detections reveals several recurring themes. In many environments, the technology is present but poorly operationalized. The main issues are:
Absence of endpoint protection platform (EPP) health check – nearly 50% of incidents escalated to high severity in engagements where the EPP health check was weak or absent. This reflects the classic “installed-but-not-enforced” risk, where agents are present but not tuned, updated, or validated.
Threat intelligence gaps – when there was no functional threat intelligence feed or platform, about half of the incidents reached high severity. Without curated indicators of compromise and contextual enrichment, analysts rely on generic alerts and may overlook known malicious behaviors.
The underlying issue is an alert-driven, set-and-forget mindset: organizations assume that deployed tools will automatically protect them, even though the tools are not continuously tuned, validated, or enriched with threat intelligence.
Incident severity breakdown where there was no EPP health check or threat intelligence
Missing control
High-severity
Medium-severity
Low-severity
EPP health check
48.3%
36.7%
15%
Threat intelligence feed
50%
40%
10%
Detection failures are rarely caused by a single missing control; they emerge from weak configuration, insufficient telemetry, and an absence of regular checks of controls and processes to ensure they are functional, especially in outsourced models. A hybrid monitoring approach that combines internal ownership with external MDR or MSSP support consistently proves to be the most resilient model when roles, expectations, and performance metrics are clearly defined. Detection must be treated as a living function, not a procurement outcome.
The following example illustrates the real-world consequences of control gaps by walking through a severe incident that persisted undetected for months simply because the organization lacked the necessary detection capabilities and security tools.
Case study: In-memory PurpleFox infection evades conventional endpoint protection
During a compromise assessment engagement, memory was scanned on the target hosts using the threat hunting rule set. Two hidden objects were identified:
PurpleFox rootkit code injected into legitimate svchost.exe processes on several critical servers.
PurpleFox drops specially crafted DLLs and forces svchost.exe to load them. From there, it installs a kernel-mode driver that gives the attacker persistent and stealthy execution capabilities, as well as the ability to pull additional payloads. This results in the loading of the XMRig miner.
The deployed EPP solution monitored file creation, registry modifications and network connections. However, its memory inspection module was disabled. Additionally, the signature set applied at the time of the assessment was not up to date. As a result, no alerts were generated for the injected DLLs or the miner’s shellcode. The compromise assessment team identified this detection gap during the memory analysis phase and documented the missing in-memory inspection capability in the final report.
The organization’s security operations were outsourced to an MSSP, which collected the logs and forwarded them to the SIEM solution. Because the logs never contained alerts for in-memory activity, PurpleFox activity was not identified.
Insufficient vulnerability management: A catalyst for high-severity compromises
In the 2025 compromise assessment engagements, more than half of the threats identified and linked to insufficient vulnerability management practices or missing patches were classified as high severity. The most frequently observed consequences were the deployment of web shells that enabled persistent remote code execution and the exploitation of misconfigured Active Directory instances.
Severity distribution of incidents due to improper vulnerability management (download)
The root causes of missing patches are multifaceted. They include inadequate asset inventory management (25% of projects) and the absence of formal vulnerability management processes (41% of projects). Moreover, 86% of organizations that claimed to have a vulnerability management program still exhibited exploited misconfigurations during compromise assessment engagements. These findings suggest that robust patch management, comprehensive asset inventory practices, and structured vulnerability management processes are critical for preventing high-severity incidents.
Case study: How overly permissive GPO-based software distribution goes wrong
During multiple compromise assessment engagements, a high-impact misconfiguration was consistently observed: a Group Policy Object (GPO) was used to point to an executable in a shared folder and run it on every workstation via a scheduled task. The access control list (ACL) on the share was set to “Everyone – Full Control”.
Given that any authenticated domain user can write to the share, an attacker who compromises a single low-privilege account can replace the legitimate binary with a malicious payload. The next scheduled task run propagates the payload automatically to all endpoints that receive the GPO. This provides:
Elevated execution context: the scheduled task typically runs under the SYSTEM or local administrator account.
Automatic lateral movement: the malicious binary propagates without requiring additional network exploitation.
Privilege escalation: a compromised low-privilege account can lead to domain administrator code execution.
Vulnerability management procedures that include systematic GPO and share permission audits would have flagged the writeable ACL as a high-severity finding, enabling remediation before exploitation. Remediation typically involves restricting the share permissions to “Authenticated Users” with read-only access and limiting modifications to certain privileged accounts. Incorporating these checks into the baseline security controls reduces the attack surface, demonstrating the tangible risk reduction achievable through disciplined vulnerability assessment and penetration testing (VAPT) practices.
Conclusion
In 2025, Kaspersky Compromise Assessment helped organizations reveal a persistent detection gap: 30.8% of all incidents and 52% of high-severity compromises had historical activity spanning over three months. Of all the incidents discovered, 20% were found manually, while 60% were missed by enterprises because of the absence of high-confidence alerts from existing tools. The oldest missed incident identified by the Kaspersky Compromise Assessment team in 2025 was four years old.
Post-incident checkups produced the highest percentage of high-severity findings, while regular proactive audits, compliance-driven audits, and audits performed before merging two networks tended to reveal issues earlier. This indicates that purely reactive investigations often miss hidden persistence. The top high-level recommendations for immediate improvement in 2025 for all projects were:
Run a comprehensive detection engine health check within 30 days of project closure, prioritizing telemetry integrity and rule relevance.
Introduce a Tier 1 alert validation team that reviews all low-confidence events on a defined schedule.
Ensure robust 24/7 monitoring augmented with threat hunting capabilities focused on baselining, low-fidelity alerts, and emerging adversary techniques.
Reevaluate the vulnerability management pipeline to ensure continuous patching and audit log activation across all critical assets.
Update security awareness curricula to address credential leakage from personal devices and reinforce secure BYOD practices.
Ensure periodic tabletop exercises are run to test technical playbooks and sharpen the team’s skills and communication workflows.
Establish operational-level agreements to govern and facilitate communication between different teams and standard operating procedures used for proper documentation.
Addressing the root cause categories systematically will reduce the likelihood of future blind spots and improve the overall security posture of the engaged organizations.
Since late 2025, malware has been spreading rapidly through the Steam Workshop, the gaming platform’s built-in service for players to create and share custom content. The attackers are primarily targeting gamers in China and Russia, aiming to hijack their accounts. To pull this off, they are exploiting Wallpaper Engine – a popular live wallpaper app available on Steam – specifically leveraging its Workshop sharing feature. The malware is hidden inside the wallpaper packages users share with one another. Running one of these compromised wallpapers can lead to a stolen Steam account or leave the victim’s system infected with backdoors or crypto miners.
What is Wallpaper Engine?
Wallpaper Engine is an app that allows you to put animated wallpapers on your desktop. It’s available for both Windows and Android, though our investigation focused strictly on the Windows version. Thanks to a massive Steam community, the app is quite popular, boasting around 100,000 daily active users and nearly a million reviews. It comes with a built-in editor so users can create their own designs, and it supports a few different wallpaper types:
Videos: MP4, WebM, and other common video formats
Scenes: interactive wallpapers built inside the app’s own editor
Web pages: HTML pages powered by JavaScript and CSS, which can also include audio and video elements
Applications: active windows from third-party Windows-compatible software that Wallpaper Engine sets as the user’s desktop background
That last type, application wallpapers, is where things get risky, because these are essentially standalone programs. They can be anything from mini-games you play right on your desktop, to planners, calendars, system monitors, or widgets tracking your CPU or GPU usage.
Application wallpapers: a built-in security risk
The whole concept of “application wallpapers” essentially allows foreign code to be run directly on your computer. Cybercriminals took note of this feature and started embedding malware right into these types of wallpapers. Because Wallpaper Engine relies on Steam Workshop for content sharing, anyone can create a wallpaper and publish it for the community to download and install for free. Naturally, this setup is a magnet for bad actors.
We discovered dozens of these malicious application wallpapers floating around Steam Workshop, and each one had already been downloaded thousands – or even tens of thousands – of times.
When we analyzed them, we caught two different methods the attackers were using to spread their malware:
An archive containing the executable wallpaper alongside the malicious files. This payload usually consisted of compromised EXE files, DLLs, or malicious scripts.
In other cases, attackers threw a curveball by hiding the malware inside a password-protected archive. Either the victim was tricked into typing the password, or a script handled it automatically. The attackers would hide the password in plain sight – either right in the archive’s name or inside a JSON configuration installed along with other wallpaper files. For all the other variations, the payload triggered automatically when the user selected and applied the wallpaper.
Inside an infected game wallpaper
Main screen of the wallpaper application
On the surface, this wallpaper sample (above) we uncovered in December 2025 looks completely harmless. Once launched, there’s absolutely nothing to trigger your suspicion. The built-in game boots up flawlessly, runs smoothly, and the desktop controls work exactly as they should. But behind the scenes, a full-blown infection is underway. Within just a few minutes, a user might suddenly realize their Steam account has been hijacked, or find their computer crippled by malware, with their files being encrypted by ransomware or their system performance tanking because of a hidden crypto miner.
How the malware deploys
Once the game wallpaper launches, it drops a backdoor file called Synaptics.exe (part of the DarkKomet malware family) straight into the victim’s system. At the same time, an executable named ._cache_GAME1.exe fires up to boot the actual game, NTRaholic.
But that ._cache_GAME1.exe module is doing double duty. It simultaneously installs a custom version of a system library called AggregatorHost.dll with a payload inside. This modified library has one main objective: track down the Steam app on the computer and hunt for account credentials.
Looking for the Steam app
Next, the modified library hijacks the user’s live Steam session.
Hijacking the Steam session
After that, the compromised AggregatorHost.dll sends all the collected data to a server controlled by the hackers at hxxp://120.48.156[.]17/ey.php. Once the attackers have control of that active session, they can use the victim’s account to upload even more malicious wallpapers to Steam Workshop.
Attribution and victims
The game wallpaper described above is just one flavor of the many variations we uncovered during our research. By weaponizing the application wallpaper feature, bad actors have successfully distributed almost every type of malware under the sun – from popular infostealers and backdoors to crypto miners and botnet loaders.
Because the range of tools being used is so diverse, we suspect this isn’t the work of a single mastermind. Instead, it looks like multiple scattered, independent hacking groups are all jumping on the same trend. Right now, the primary targets are gamers in China. The wallpaper art styles and titles are tailored specifically to them, and the data backs it up: our security systems caught a staggering 89% of the malicious download attempts happening right there. That said, there’s absolutely nothing stopping these attackers from pivoting and launching a similar campaign in any other part of the world. Russia comes in second place for total downloads at 5.5%, followed by a smattering of other countries and territories: Singapore (1.4%), Hong Kong (0.9%), Germany (0.9%), Vietnam (0.9%), India (0.5%), and Canada (0.5%).
Malicious app wallpaper downloads by region
How to stay safe
Our investigation proves that even trusted platforms like the Steam Workshop aren’t completely safe from malware. In most cases, we caught old, familiar threats such as DarkKomet, the Lumma and Vidar infostealers, and the RenEngine loader. Kaspersky solutions can easily spot and block all of these payloads, no matter how clever the packaging is, thanks to our proactive security layers. Here are some of the specific threat detection verdicts assigned to the objects we discovered during our research:
HEUR:Trojan-PSW.Win32.gen
HEUR:Trojan-PSW.Win32.Python.gen
HEUR:Backdoor.Win32.DarkKomet
Trojan-Dropper.Python.Agent
HEUR:Trojan-Ransom.Win32.Gen.gen
PDM:Trojan.Win32.Generic.
By the time this post went live, the Steam team had already scrubbed the identified malicious wallpapers and links from the platform. However, given how frequently new infected wallpapers keep popping up on the Steam Workshop, you shouldn’t rely on Steam to catch everything. It’s highly recommended to run an antivirus scan on these types of wallpapers before you actually apply them.
In late April 2026, a client reached out to us for incident response support after discovering a miner running on users’ computers. We later discovered that the malware was being distributed via illegal movie and TV show streaming sites. The infection chain leveraged a fake update for a video player plugin. When the user attempted to watch a video, the player displayed a message saying the plugin version was outdated and asking to install an update to continue.
Clicking the link downloaded a ZIP archive with the following contents:
The archive contained a legitimate executable, HLS Installer.874.exe, alongside a malicious DLL. Launching the EXE triggered a DLL side-loading mechanism, injecting the malicious module into a legitimate program process and executing code within its context. The library contained the logic for deploying the miner and establishing persistence on the device.
At the time of the investigation, the infection risk was associated with two pirated video sites in the .ru and .top TLDs.
Link to previous campaigns
The current incident does not appear to be an isolated case. After analyzing the infection vector and the logic of the DLL, we concluded that this activity is a continuation of a campaign involving pirated digital libraries, which was previously described by another cybersecurity company.
The delivery mechanism for the malicious archive has remained virtually unchanged. Previously, the archive was downloaded in parts from the domain file[.]ipfs[.]us[.]69[.]mu, but this domain was unavailable at the time of our investigation. Instead, the threat actor employed a new website, urush1bar4[.]online.
The structure of the archive has also been preserved: inside is a legitimate executable and a large malicious DLL (see the screenshot below).
In the course of our research, we also discovered a blog post by NTT Security describing a similar delivery method for a malicious archive. In that instance, the threat actors displayed a fake browser crash page (shown below) while simultaneously downloading an archive to the device with a name starting with chromium-patch-nightly.
This scenario resembles the current scheme involving the fake video player plugin update. Given the previously described activity, it’s safe to assume that this campaign has been active since at least 2022. Throughout this entire period, the threat actor has been updating both the downloadable malware and individual parts of the infection mechanism.
Potential distribution scale
As in previous episodes of the campaign, infections occur via highly popular websites. As of late April 2026, sites linked to the campaign typically displayed extremely high monthly traffic. For instance, the audience for the smallest of the free digital libraries stood at 11,000 users, while the largest reached 4.7 million. For pirated movie and TV show streaming sites, this figure ranged from 2.1 million to 27.4 million. In April, the total number of visits to websites where the malware described in this study was detected reached 40 million.
The popularity of these sites increases the potential scale of the miner’s distribution. Furthermore, the campaign is not limited to a single type of platform: the malicious archive is being distributed through both online digital libraries and movie and TV show streaming sites. This broadens the potential range of victims and makes it more difficult to attribute the threat to a single infection vector.
The downloadable archive
The current version of the downloadable malware is a ZIP archive containing a legitimate EXE file and a malicious DLL. When the executable runs, the library side-loads into its process, triggering the malicious logic.
The technical analysis that follows covers the current version of this malware. This version was first observed in April 2025 and has been distributed unmodified for over a year.
DLL analysis
Most of the data inside the DLL carries no meaningful weight and was randomly generated just to inflate the file size and impede analysis.
Amidst the large volume of junk code inside the DLL, there is a single function that triggers a stack overflow during execution:
Based on the code, the size of the stackBuf buffer on the stack is only 64 bytes, and the SmashStack function overwrites this buffer without validating the length of the input data.
This overflow constructs a ROP chain that decrypts the next stage. After decryption, it transfers execution to code located within the modified DOS header of the PE file:
The header was intentionally modified to make it into valid shellcode:
pop     r10
push    r10
call    $+5
pop     rcx
sub     rcx, 9
mov     rax, rcx
add     rax, 5C1000h
call    rax
retn
This shellcode passes control to a function located at offset 0x5C1000 from the base of the PE file. This function then reflectively loads the same PE file into memory.
Going forward, we will refer to this decrypted PE file as the main module.
Main module
The module’s behavior across its different operational stages is detailed below:
Upon an initial run, the main module checks whether it has permission to proceed with execution. To do this, it collects the following data from the victim’s device:
Processor information
The serial number of the C:/ drive
Whether the process was launched with elevated privileges
The process start time in Unix timestamp format
The information is transmitted as a single large DNS query using the DNS tunneling technique. An example of the DNS query is shown below:
The attackers disguise the DNS query as legitimate traffic through low-level packet crafting and by using a domain name ending in microsoft.com. However, the IP address to which the query is actually sent has no relation to Microsoft.
DNS query crafting code
The execution of the main module proceeds only if the following byte sequence is detected in the response: 01 02 03 04. Following a successful check, the main module launches, and the subsequent logic is adjusted depending on whether the process has elevated privileges on the compromised host.
Let’s look at both scenarios:
1. The process is launched with elevated privileges.
In this case, preparatory steps precede the miner launch:
The malware adds Windows Defender exclusions for EXE and DLL files, as well as for the %USERPROFILE%, %PROGRAMDATA%, and %WINDIR% folders.
It kills Microsoft’s Malicious Software Removal Tool (MSRT) by calling ZwSetInformationFile with the FileDispositionInformation type, which causes the mrt.exe file to be deleted upon closing. To prevent MSRT from being automatically installed during the next update, the DontOfferThroughWUAU parameter is created with a value of 1 under the HKLM\Software\Policies\Microsoft\MRT registry key.
Automatic hibernation and sleep mode are disabled for when the device is running on both AC power and battery.
This is done to maximize the miner’s potential runtime on the device.
Next, to achieve persistence, a copy is created in the C:\ProgramData\Google\Chrome directory, after which the GoogleUpdateTaskMachineQC service is registered and configured to launch automatically at system startup.
Finally, four reflexive loads are executed: the components are injected directly into the memory of the target processes without writing to disk, having bypassed standard Windows loading mechanisms. Each implant is injected into its own host process:
RAT agent → into conhost.exe
Watchdog → into explorer.exe
CPU miner → into explorer.exe
GPU miner → into explorer.exe, but only if a discrete GPU is present in the system. This is verified by enumerating all display adapters in the system.
2. The process is launched with standard privileges.
In this scenario, the miner begins repeatedly triggering User Account Control (UAC) prompts until it is successfully executed with elevated privileges. The workflow is as follows:
Upon initial execution, a copy is made to the %USERPROFILE%\AppData\Roaming\Sandboxie directory and relaunched from there. Simultaneously, an attempt is made to launch it with elevated privileges via UAC.
If execution occurs from the Sandboxie folder:
Persistence is configured for the miner copy in this folder by adding an entry to HKEY_CURRENT_USER\Software\Microsoft\Windows\CurrentVersion\Run.
Every three minutes, an attempt is made to launch with elevated privileges via UAC until the GoogleUpdateTaskMachineQC service is successfully installed.
A successful installation requires all of the following conditions to be met:
The GoogleUpdateTaskMachineQC service exists in the system.
The Start value for this service is set to 2 (Automatic).
The ImagePath value points to a file in the C:\ProgramData\Google\Chrome folder.
This file exists on disk.
Watchdog
The purpose of this component is to ensure the uninterrupted operation of the miner. At the very beginning of its execution, it copies all files from the C:\ProgramData\Google\Chrome folder and encrypts the contents of each file using a cyclic XOR algorithm with the key AFeIboiOmImJS2ypJU0pTpAO61SELkUc. After that, the encrypted contents are written into the process memory, and the following structure is created in memory for each file:
class FileContainer{
	wchar_t* fullPath; // full path to file
	size_t* ptrSize;   // pointer to file size
	uint8_t* xorEncryptedFile; //pointer to buffer containing encrypted file contents
};
As soon as the contents of all files are saved in memory, Watchdog enters an infinite loop, where every five seconds, it checks the integrity of the installed GoogleUpdateTaskMachineQC service, just as the main module does. If the service is found to be incorrectly installed, the miner overwrites its files in the C:\ProgramData\Google\Chrome path with the contents acquired at startup.
To successfully remediate the miner, this module, which runs inside the explorer.exe process, must be terminated first.
RAT agent
This module provides remote control capabilities via four commands, which are described at the end of this section. The command-and-control addresses used to receive these commands follow this format:
http://{domain}.space/index.php?authorization=1
http://{domain}.site/index.php? backup version
The {domain} is calculated based on the current date. The process starts with the current year, then adds the zone identifier for the current month. All 12 months are divided into four zones. Finally, the word microsoft is appended to the resulting string. This final string is used as the input for subsequent double hashing using the MurmurHash64 algorithm. The hash output is the domain for the implant to communicate with.
At the time of writing this, the following domains were registered:
2025, April-July → 5d14vnfb[.]space
2025, August-November → r7mvjl67[.]space
2025, December → zgj1tam9[.]space
2026, January-March → jeaw520i[.]space
2026, April–July → qdmagva5[.]space
An example of a request to the C2 server is provided below:
As can be seen, the request contains an encrypted body consisting of data encrypted via AES-CBC with the key 0123456789abcdef0123456789abcdef and the initialization vector 000102030405060708090a0b0c0d0e0f. The data contains a list of installed programs on the system, along with processor information and the serial number of the C: drive.
This information is likely used by the backend to check for virtual or debugging environments.
The first 16 bytes of the server response body represent the initialization vector for the AES-CBC algorithm with the key 0123456789abcdef0123456789abcdef, while the remaining bytes are the data encrypted with this algorithm. The decrypted data contains a malicious payload, as well as its RSA-SHA256 signature (sign):
The authenticity of the message is verified via the sign signature using the server’s public key, which is embedded in the executable.
Inside the malicious payload is a 4-byte code that determines the subsequent behavior of the program, along with additional data whose meaning depends on the code.
The table below lists the four remote control commands for the RAT agent module.
Code
Purpose
1
Execution of an arbitrary command
2
Reflexive execution of the provided PE file within the explorer.exe process
3
Execution of the provided shellcode
4
Exit
The miners
Depending on whether a discrete GPU is present in the system, either the CPU miner alone or a combination of the CPU and GPU miners is launched. The CPU miner is based on XMRig, while the GPU miner supports multiple algorithms.
Upon initial execution, both miners attempt to retrieve their startup configuration from a remote server. The potential addresses are listed below:
“{domain}.strangled.net”
“{domain}.ignorelist.com”
“{domain}.ftp.sh”
“{domain}.zanity.net”
As with the RAT agent component, the server address is generated from the current date — in this case, the server address changes every week. This results in quite a large number of domains for the 2020–2030 period; however, all of them point to the same IP address: 107[.]172[.]212[.]235. The first available domain out of the four potential domains listed above will be used.
The algorithm for retrieving the configuration from the server is completely identical to that used by the RAT agent, with the sole exception that th1s1sth3key0f4n1ntere5t1ngw0rld is used as the AES-CBC key in this scenario, and the configuration resides within the payload. The retrieved configuration is encrypted via AES-CBC using the key UXUUXUUXUUCommandULineUUXUUXUUXU and the initialization vector UUCommandULineUU. The encrypted data is then converted into a base64 string, which is passed as a command-line parameter to launch the miner inside the explorer.exe process through process hollowing.
Conclusion
Our investigation focused on an ongoing campaign distributing miners via popular illegal content sites. The threat actors leverage a variety of sites, ranging from online libraries to movie and TV show streaming platforms. There is no telling what channels they will use to distribute the malicious archive in the future. However, the current case shows that users visiting pirated websites continue to take a serious risk.
Our products detect this malware with the following Generic verdicts:
The statistics in this report are based on detection verdicts returned by Kaspersky products unless otherwise stated. The information was provided by Kaspersky users who consented to sharing statistical data.
Quarterly figures
In Q1 2026:
Kaspersky products blocked more than 343 million attacks that originated with various online resources.
Web Anti-Virus responded to 50 million unique links.
File Anti-Virus blocked nearly 15 million malicious and potentially unwanted objects.
2938 new ransomware variants were detected.
More than 77,000 users experienced ransomware attacks.
14% of all ransomware victims whose data was published on threat actors’ data leak sites (DLS) were victims of Clop.
More than 260,000 users were targeted by miners.
Ransomware
Quarterly trends and highlights
Law enforcement success
In January 2026, it was reported that the FBI had seized the domains of the RAMP cybercrime forum, a major platform used extensively by ransomware developers to advertise their RaaS programs and to recruit affiliates. There has been no official statement from the FBI, nor is it clear if RAMP servers were seized. In a post on an external website, a RAMP moderator mentioned law enforcement agencies gaining control over the forum. The takedown disrupted a key element of the RaaS ecosystem, creating ripple effects for ransomware operators, affiliates, and initial access brokers.
A man suspected of links to the Phobos group was apprehended in Poland. He was charged with the creation, acquisition, and distribution of software designed for unlawfully obtaining information, including data that facilitates unauthorized access to information stored within a computer system.
In March, a Phobos ransomware administrator pleaded guilty to the creation and distribution of the Trojan, which had been used in international attacks dating back to at least November 2020.
In March, the U.S. Department of Justice charged a man who had acted as a negotiator for ransomware groups. The company he worked for specializes in cyberincident investigations. The prosecution alleges the suspect colluded with the BlackCat threat actor to share privileged insights into the ongoing progress of negotiations. Additionally, the suspect is alleged to have had a prior direct role in BlackCat attacks, serving as an affiliate for the RaaS operation.
In a separate development this March, a U.S. court sentenced an initial access broker associated with the Yanluowang ransomware group to 81 months of imprisonment. According to the U.S. Department of Justice, the convict facilitated dozens of ransomware attacks across the United States, resulting in over $9 million in actual loss and more than $24 million in intended loss.
Vulnerabilities and attacks
The Interlock group has been heavily exploiting the CVE-2026-20131 zero-day vulnerability in Cisco Secure FMC firewall management software since at least January 26, 2026. The vulnerability enabled arbitrary Java code execution with root privileges on the affected device. This campaign demonstrates the ongoing reliance on zero-day vulnerabilities for initial access, a focus on network appliances as high-value entry points, and the rapid weaponization of new vulnerabilities within the ransomware ecosystem.
The most prolific groups
This section highlights the most prolific ransomware gangs by number of victims added to each group’s DLS. This quarter, the Clop ransomware (14.42%) returned to the top of the rankings, displacing Qilin (12.34%), which had held the leading position in the previous reporting period. Following closely is a new threat actor, The Gentlemen (9.25%). Emerging no later than July 2025, the group had already surpassed the activity levels of mainstays such as Akira (7.25%) and INC Ransom (6.13%).
Number of each group’s victims according to its DLS as a percentage of all groups’ victims published on all the DLSs under review during the reporting period (download)
Number of new variants
In Q1 2026, Kaspersky solutions detected six new ransomware families and 2938 new modifications. Volumes have returned to Q3 2025 levels following a surge in Q4 2025.
Number of new ransomware modifications, Q1 2025 — Q1 2026 (download)
Number of users attacked by ransomware Trojans
Throughout Q1, our solutions protected 77,319 unique users from ransomware. Ransomware activity was highest in March, with 35,056 unique users encountering such attacks during the month.
Number of unique users attacked by ransomware Trojans, Q1 2026 (download)
Attack geography
TOP 10 countries and territories attacked by ransomware Trojans
Country/territory*
%**
1
Pakistan
0.79
2
South Korea
0.64
3
China
0.52
4
Tajikistan
0.40
5
Libya
0.38
6
Turkmenistan
0.36
7
Iraq
0.35
8
Bangladesh
0.33
9
Rwanda
0.30
10
Cameroon
0.28
* Excluded are countries and territories with relatively few (under 50,000) Kaspersky users.
** Unique users whose computers were attacked by ransomware Trojans as a percentage of all unique users of Kaspersky products in the country/territory.
TOP 10 most common families of ransomware Trojans
Name
Verdict
%*
1
(generic verdict)
Trojan-Ransom.Win32.Gen
33.90
2
(generic verdict)
Trojan-Ransom.Win32.Crypren
6.38
3
WannaCry
Trojan-Ransom.Win32.Wanna
5.87
4
(generic verdict)
Trojan-Ransom.Win32.Encoder
4.68
5
(generic verdict)
Trojan-Ransom.Win32.Agent
3.80
6
LockBit
Trojan-Ransom.Win32.Lockbit
2.80
7
(generic verdict)
Trojan-Ransom.Win32.Phny
1.99
8
(generic verdict)
Trojan-Ransom.MSIL.Agent
1.96
9
(generic verdict)
Trojan-Ransom.Python.Agent
1.93
10
(generic verdict)
Trojan-Ransom.Win32.Crypmod
1.89
* Unique Kaspersky users attacked by the specific ransomware Trojan family as a percentage of all unique users attacked by this type of threat.
Miners
Number of new variants
In Q1 2026, Kaspersky solutions detected 3485 new modifications of miners.
Number of new miner modifications, Q1 2026 (download)
Number of users attacked by miners
In Q1, we detected attacks using miner programs on the computers of 260,588 unique Kaspersky users worldwide.
Number of unique users attacked by miners, Q1 2026 (download)
Attack geography
TOP 10 countries and territories attacked by miners
Country/territory*
%**
1
Senegal
3.19
2
Turkmenistan
3.06
3
Mali
2.63
4
Tanzania
1.62
5
Bangladesh
1.06
6
Ethiopia
0.95
7
Panama
0.88
8
Afghanistan
0.79
9
Kazakhstan
0.77
10
Bolivia
0.75
* Excluded are countries and territories with relatively few (under 50,000) Kaspersky users.
** Unique users whose computers were attacked by miners as a percentage of all unique users of Kaspersky products in the country/territory.
Attacks on macOS
In Q1 2026, Google uncovered a new cryptocurrency theft campaign. The scammers directed victims to a fraudulent video call, prompting them to execute malicious scripts under the guise of technical support fixes for connection problems.
In March, researchers with GTIG and iVerify reported the discovery of an in-the-wild exploit chain targeting both iOS and macOS devices. The exploit kit was apparently marketed on the dark web, providing threat actors with a suite of spyware capabilities alongside specialized cryptocurrency exfiltration modules. The exploit was delivered via drive-by downloads when victims visited various compromised websites. Our analysis confirmed that the toolkit included an updated version of a component previously identified in the Operation Triangulation attack chain.
Devices running macOS were similarly impacted by the high-profile supply chain attack targeting the Axios npm package, a widely used HTTP client for JavaScript. The installation of the infected package led to the deployment of a backdoor on macOS devices.
TOP 20 threats to macOS
Unique users* who encountered this malware as a percentage of all attacked users of Kaspersky security solutions for macOS (download)
* Data for the previous quarter may differ slightly from previously published data due to some verdicts being retrospectively revised.
The share of PasivRobber spyware attacks is beginning to decline, giving way to more traditional adware and Monitor-class software capable of tracking user activity. The popular Amos stealer also maintains its presence within the TOP 20.
Geography of threats to macOS
TOP 10 countries and territories by share of attacked users
Country/territory
%* Q4 2025
%* Q1 2026
China
1.28
1.97
France
1.18
1.07
Brazil
1.13
0.98
Mexico
0.72
0.52
Germany
0.71
0.45
The Netherlands
0.62
0.75
Hong Kong
0.49
0.53
India
0.42
0.48
Russian Federation
0.34
0.37
Thailand
0.24
0.27
* Unique users who encountered threats to macOS as a percentage of all unique Kaspersky users in the country/territory.
IoT threat statistics
This section presents statistics on attacks targeting Kaspersky IoT honeypots. The geographic data on attack sources is based on the IP addresses of attacking devices.
In Q1 2026, the share of devices attacking Kaspersky honeypots via the SSH protocol saw a significant increase compared to the previous reporting period.
Distribution of attacked services by number of unique IP addresses of attacking devices (download)
The distribution of attacks between Telnet and SSH maintained the ratio observed in Q4 2025.
Distribution of attackers’ sessions in Kaspersky honeypots (download)
TOP 10 threats delivered to IoT devices
Share of each threat delivered to an infected device as a result of a successful attack, out of the total number of threats delivered (download)
The primary shifts in the IoT threat distribution are linked to the activity of various Mirai botnet variants, although members of this family continue to account for the majority of the list. Furthermore, a new variant, Mirai.kl, surfaced in the rankings. We also observed a significant decline in NyaDrop botnet activity during Q1.
Attacks on IoT honeypots
The United States, the Netherlands, and Germany accounted for the highest proportions of SSH-based attacks during this period.
Country/territory
Q4 2025
Q1 2026
United States
16.10%
23.74%
The Netherlands
15.78%
17.57%
Germany
12.07%
10.34%
Panama
7.72%
6.34%
India
5.32%
6.05%
Romania
4.05%
5.82%
Australia
1.62%
4.61%
Vietnam
4.21%
3.50%
Russian Federation
3.79%
2.35%
Sweden
2.25%
2.09%
China continues to account for the largest proportion of Telnet attacks, though there was a marked increase in activity originating from Pakistan.
Country/territory
Q4 2025
Q1 2026
China
53.64%
39.54%
Pakistan
14.27%
27.31%
Russian Federation
8.20%
8.25%
Indonesia
8.58%
6.71%
India
4.85%
4.66%
Brazil
0.06%
3.30%
Argentina
0.02%
2.51%
Nigeria
1.22%
1.38%
Thailand
0.01%
0.55%
Sweden
0.54%
0.55%
Attacks via web resources
The statistics in this section are based on detection verdicts by Web Anti-Virus, which protects users when suspicious objects are downloaded from malicious or infected web pages. These malicious pages are purposefully created by cybercriminals. Websites that host user-generated content, such as message boards, as well as compromised legitimate sites, can become infected.
TOP 10 countries and territories that served as sources of web-based attacks
The following statistics show the distribution by country/territory of the sources of internet attacks blocked by Kaspersky products on user computers (web pages redirecting to exploits, sites containing exploits and other malicious programs, botnet C&C centers, and so on). One or more web-based attacks could originate from each unique host.
To determine the geographic source of web attacks, we matched the domain name with the real IP address where the domain is hosted, then identified the geographic location of that IP address (GeoIP).
In Q1 2026, Kaspersky solutions blocked 343,823,407 attacks launched from internet resources worldwide. Web Anti-Virus was triggered by 49,983,611 unique URLs.
Web-based attacks by country/territory, Q1 2026 (download)
Countries and territories where users faced the greatest risk of online infection
To assess the risk of malware infection via the internet for users’ computers in different countries and territories, we calculated the share of Kaspersky users in each location on whose computers Web Anti-Virus was triggered during the reporting period. The resulting data provides an indication of the aggressiveness of the environment in which computers operate in different countries and territories.
This ranked list includes only attacks by malicious objects classified as Malware. Our calculations leave out Web Anti-Virus detections of potentially dangerous or unwanted programs, such as RiskTool or adware.
Country/territory*
%**
1
Venezuela
9.33
2
Hungary
8.16
3
Italy
7.58
4
Tajikistan
7.48
5
India
7.21
6
Greece
7.13
7
Portugal
7.10
8
France
7.05
9
Belgium
6.83
10
Slovakia
6.80
11
Vietnam
6.62
12
Bosnia and Herzegovina
6.57
13
Canada
6.56
14
Serbia
6.50
15
Tunisia
6.36
16
Qatar
6.01
17
Spain
5.95
18
Germany
5.95
19
Sri Lanka
5.89
20
Brazil
5.88
* Excluded are countries and territories with relatively few (under 10,000) Kaspersky users.
** Unique users targeted by web-based Malware attacks as a percentage of all unique users of Kaspersky products in the country/territory.
On average during the quarter, 4.73% of users’ computers worldwide were subjected to at least one Malware web attack.
Local threats
Statistics on local infections of user computers are an important indicator. They include objects that penetrated the target computer by infecting files or removable media, or initially made their way onto the computer in non-open form. Examples of the latter are programs in complex installers and encrypted files.
Data in this section is based on analyzing statistics produced by anti-virus scans of files on the hard drive at the moment they were created or accessed, and the results of scanning removable storage media. The statistics are based on detection verdicts from the On-Access Scan (OAS) and On-Demand Scan (ODS) modules of File Anti-Virus and include detections of malicious programs located on user computers or removable media connected to the computers, such as flash drives, camera memory cards, phones, or external hard drives.
In Q1 2026, our File Anti-Virus detected 15,831,319 malicious and potentially unwanted objects.
Countries and territories where users faced the highest risk of local infection
For each country and territory, we calculated the percentage of Kaspersky users whose computers had the File Anti-Virus triggered at least once during the reporting period. This statistic reflects the level of personal computer infection in different countries and territories around the world.
Note that this ranked list includes only attacks by malicious objects classified as Malware. Our calculations leave out File Anti-Virus detections of potentially dangerous or unwanted programs, such as RiskTool or adware.
Country/territory*
%**
1
Turkmenistan
47.96
2
Tajikistan
31.48
3
Cuba
31.03
4
Yemen
29.59
5
Afghanistan
28.47
6
Burundi
26.93
7
Uzbekistan
24.81
8
Syria
23.08
9
Nicaragua
21.97
10
Cameroon
21.60
11
China
21.09
12
Mozambique
21.02
13
Algeria
20.64
14
Democratic Republic of the Congo
20.63
15
Bangladesh
20.44
16
Mali
20.35
17
Republic of the Congo
20.23
18
Madagascar
20.00
19
Belarus
19.78
20
Tanzania
19.52
* Excluded are countries and territories with relatively few (under 10,000) Kaspersky users.
** Unique users on whose computers local Malware threats were blocked, as a percentage of all unique users of Kaspersky products in the country/territory.
On average worldwide, Malware local threats were detected at least once on 11.55% of users’ computers during Q1.
The percentage of ICS computers on which malicious objects were blocked has been decreasing since the beginning of 2024. In Q4 2025, it was 19.7%. Over the past three years, the percentage has decreased by 1.36 times, and by 1.25 times since Q4 2023.
Percentage of ICS computers on which malicious objects were blocked, Q1 2023–Q4 2025
Regionally, in Q4 2025, the percentage of ICS computers on which malicious objects were blocked ranged from 8.5% in Northern Europe to 27.3% in Africa.
Regions ranked by percentage of ICS computers on which malicious objects were blocked
Four regions saw an increase in the percentage of ICS computers on which malicious objects were blocked. The most notable increases occurred in Southern Europe and South Asia. In Q3 2025, East Asia experienced a sharp increase triggered by the local spread of malicious scripts, but the figure has since returned to normal.
Changes in percentage of ICS computers on which malicious objects were blocked, Q4 2025
Feature of the quarter: worms in email
In Q4 2025, the percentage of ICS computers on which wormsinemailattachments were blocked increasedinallregions of the world.
Many of the blocked threats were related to the worm Backdoor.MSIL.XWorm. This malware is designed to persist on the system and then remotely control it.
Interestingly, this threat was not detected on ICS computers in the previous quarter, yet it appeared in all regions in Q4 2025.
A study found that the active spread of Backdoor.MSIL.XWorm via phishing emails was likely linked to the use by hackers of another malware obfuscation technique that was actively used during massive phishing campaigns in Q4 2025. These campaigns have been known since 2024 as “Curriculum-vitae-catalina”.
The attackers distributed phishing emails to HR managers, recruiters, and employees responsible for hiring. The messages were disguised as responses from job applicants with subjects such as “Resume” or “Attached Resume” and contained a malicious executable file under the guise of a curriculum vitae. Typically, the file was named Curriculum Vitae-Catalina.exe. When executed, it infected the system.
In Q4 2025, the threat spread across regions in two waves — one in October and another in November. Russia, Western Europe, South America, and North America (Canada) were attacked in October. A spike in Backdoor.MSIL.XWorm blocking was observed in other regions in November. The attack subsided in all regions in December.
The highest percentage of ICS computers on which Backdoor.MSIL.XWorm was blocked was observed in regions where threats from email clients had been historically blocked at high rates on ICS computers: Southern Europe, South America, and the Middle East.
At the same time, in Africa, where USB storage media are still actively used, the threat was also detected when removable devices were connected to ICS computers.
Selected industries
The biometrics sector has historically led the rankings of industries and OT infrastructures surveyed in this report in terms of the percentage of ICS computers on which malicious objects were blocked.
These systems are characterized by accessibility to and from the internet, as well as minimal cybersecurity controls by the consumer organization.
Rankings of industries and OT infrastructure by percentage of ICS computers on which malicious objects were blocked
In Q4 2025, the percentage of ICS computers on which malicious objects were blocked increased only in one sector: oil and gas. The corresponding figures increased in two regions: Russia, and Central Asia and the South Caucasus.
However, if we look at a broader time span, there is a downward trend in all the surveyed industries.
Percentage of ICS computers on which malicious objects were blocked in selected industries
Diversity of detected malicious objects
In Q4 2025, Kaspersky protection solutions blocked malware from 10,142 different malware families of various categories on industrial automation systems.
Percentage of ICS computers on which the activity of malicious objects from various categories was blocked
In Q4 2025, there was an increase in the percentage of ICS computers on which worms, and miners in the form of executable files for Windows were blocked. These were the only categories that exhibited an increase.
Main threat sources
Depending on the threat detection and blocking scenario, it is not always possible to reliably identify the source. The circumstantial evidence for a specific source can be the blocked threat’s type (category).
The internet (visiting malicious or compromised internet resources; malicious content distributed via messengers; cloud data storage and processing services and CDNs), email clients (phishing emails), and removable storage devices remain the primary sources of threats to computers in an organization’s technology infrastructure.
In Q4 2025, the percentage of ICS computers on which malicious objects from various sources were blocked decreased. All sources except email clients saw their lowest levels in three years.
Percentage of ICS computers on which malicious objects from various sources were blocked
The same computer can be attacked by several categories of malware from the same source during a quarter. That computer is counted when calculating the percentage of attacked computers for each threat category, but is only counted once for the threat source (we count unique attacked computers). In addition, it is not always possible to accurately determine the initial infection attempt. Therefore, the total percentage of ICS computers on which various categories of threats from a certain source were blocked can exceed the percentage of computers affected by the source itself.
In Q4 2025, the percentage of ICS computers on which threats from the internet were blocked decreased to 7.67% and reached its lowest level since the beginning of 2023. The main categories of internet threats are malicious scripts and phishing pages, and denylisted internet resources. The percentage ranged from 3.96% in Northern Europe to 11.33% in South Asia.
The main categories of threats from email clients blocked on ICS computers were malicious scripts and phishing pages, spyware, and malicious documents. Most of the spyware detected in phishing emails was delivered as a password archive or a multi-layered script embedded in office document files. The percentage of ICS computers on which threats from email clients were blocked ranged from 0.64% in Northern Europe to 6.34% in Southern Europe.
The main categories of threats that were blocked when removable media was connected to ICS computers were worms, viruses, and spyware. The percentage of ICS computers on which threats from removable media were blocked ranged from 0.05% in Australia and New Zealand to 1.41% in Africa.
The main categories of threats that spread through network folders in Q4 2025 were viruses, AutoCAD malware, worms, and spyware. The percentage of ICS computers on which threats from network folders were blocked ranged from 0.01% in Northern Europe to 0.18% in East Asia.
Threat categories
Typical attacks blocked within an OT network are multi-step sequences of malicious activities, where each subsequent step of the attackers is aimed at increasing privileges and/or gaining access to other systems by exploiting the security problems of industrial enterprises, including OT infrastructures.
Malicious objects used for initial infection
In Q4 2025, the percentage of ICS computers on which denylisted internet resources were blocked decreased to 3.26%. This is the lowest quarterly figure since the beginning of 2022, and it has decreased by 1.8 times since Q2 2025.
Percentage of ICS computers on which denylisted internet resources were blocked, Q1 2023–Q4 2025
Regionally, the percentage of ICS computers on which denylisted internet resources were blocked ranged from 1.74% in Northern Europe to 3.93% in Southeast Asia, which displaced Africa from first place. Russia rounded out the top three regions for this indicator.
The percentage of ICS computers on which malicious documents were blocked increased for three consecutive quarters. However, in Q4 2025 it decreased by 0.22 pp to 1.76%.
Percentage of ICS computers on which malicious documents were blocked, Q1 2023–Q4 2025
Regionally, the percentage ranged from 0.46% in Northern Europe to 3.82% in Southern Europe. In Q4 2025, the indicator increased in Eastern Europe, Russia, and Western Europe.
The percentage of ICS computers on which malicious scripts and phishing pages were blocked decreased to 6.58%. Despite the decline, this category led the rankings of threat categories in terms of the percentage of ICS computers on which they were blocked.
Percentage of ICS computers on which malicious scripts and phishing pages were blocked, Q1 2023–Q4 2025
Regionally, the percentage ranged from 2.52% in Northern Europe to 10.50% in South Asia. The indicator increased in South Asia, South America, Southern Europe, and Africa. South Asia saw the most notable increase, at 3.47 pp.
Next-stage malware
Malicious objects used to initially infect computers deliver next-stage malware — spyware, ransomware, and miners — to victims’ computers. As a rule, the higher the percentage of ICS computers on which the initial infection malware is blocked, the higher the percentage for next-stage malware.
In Q4 2025, the percentage of ICS computers on which spyware, ransomware and web miners were blocked decreased. The rates were:
Spyware: 3.80% (down 0.24 pp). For the second quarter in a row, spyware took second place in the rankings of threat categories in terms of the percentage of ICS computers on which it was blocked.
Ransomware: 0.16% (down 0.01 pp).
Web miners: 0.24% (down 0.01 pp), this is the lowest level observed thus far in the period under review.
The percentage of ICS computers on which miners in the form of executable files for Windows were blocked increased to 0.60% (up 0.03 pp).
Self-propagating malware
Self-propagating malware (worms and viruses) is a category unto itself. Worms and virus-infected files were originally used for initial infection, but as botnet functionality evolved, they took on next-stage characteristics.
To spread across ICS networks, viruses and worms rely on removable media and network folders and are distributed in the form of infected files, such as archives with backups, office documents, pirated games and hacked applications. In rarer and more dangerous cases, web pages with network equipment settings, as well as files stored in internal document management systems, product lifecycle management (PLM) systems, resource management (ERP) systems and other web services are infected.
In Q4 2025, the percentage of ICS computers on which worms were blocked increased by 1.6 times to 1.60%. As mentioned above, this increase is related to a global phishing attack that spread the Backdoor.MSIL.XWorm backdoor worm across all regions of the world. The percentage increased in all regions. The biggest increase (up by 2.16 times) was in Southern Europe. The malware was primary distributed through email clients, and Southern Europe led the way in terms of the percentage of ICS computers on which threats from email clients were blocked.
The percentage of ICS computers on which viruses were blocked decreased to 1.33%.
AutoCAD malware
This category of malware can spread in a variety of ways, so it does not belong to a specific group.
After an increase in the previous quarter, the percentage of ICS computers on which AutoCAD malware was blocked decreased to 0.29% in Q4 2025.
Description. analysis of ASEC’s ASD logs for Q1 2026 showed a consistent trend of attacks against MS-SQL and MySQL. the number of attacks tended to decrease temporarily in February before increasing again in March. Purpose and Scope. this report summarizes the statistics of attacks targeting MS-SQL and MySQL servers installed on Windows and the malware […]
A hacktivist group with links to Iran’s intelligence agencies is claiming responsibility for a data-wiping attack against Stryker, a global medical technology company based in Michigan. News reports out of Ireland, Stryker’s largest hub outside of the United States, said the company sent home more than 5,000 workers there today. Meanwhile, a voicemail message at Stryker’s main U.S. headquarters says the company is currently experiencing a building emergency.
Based in Kalamazoo, Michigan, Stryker [NYSE:SYK] is a medical and surgical equipment maker that reported $25 billion in global sales last year. In a lengthy statement posted to Telegram, a hacktivist group known as Handala (a.k.a. Handala Hack Team) claimed that Stryker’s offices in 79 countries have been forced to shut down after the group erased data from more than 200,000 systems, servers and mobile devices.
A manifesto posted by the Iran-backed hacktivist group Handala, claiming a mass data-wiping attack against medical technology maker Stryker.
“All the acquired data is now in the hands of the free people of the world, ready to be used for the true advancement of humanity and the exposure of injustice and corruption,” a portion of the Handala statement reads.
The group said the wiper attack was in retaliation for a Feb. 28 missile strike that hit an Iranian school and killed at least 175 people, most of them children. The New York Timesreports today that an ongoing military investigation has determined the United States is responsible for the deadly Tomahawk missile strike.
Handala was one of several hacker groups recently profiled by Palo Alto Networks, which links it to Iran’s Ministry of Intelligence and Security (MOIS). Palo Alto says Handala surfaced in late 2023 and is assessed as one of several online personas maintained by Void Manticore, a MOIS-affiliated actor.
Stryker’s website says the company has 56,000 employees in 61 countries. A phone call placed Wednesday morning to the media line at Stryker’s Michigan headquarters sent this author to a voicemail message that stated, “We are currently experiencing a building emergency. Please try your call again later.”
A report Wednesday morning from the Irish Examiner said Stryker staff are now communicating via WhatsApp for any updates on when they can return to work. The story quoted an unnamed employee saying anything connected to the network is down, and that “anyone with Microsoft Outlook on their personal phones had their devices wiped.”
“Multiple sources have said that systems in the Cork headquarters have been ‘shut down’ and that Stryker devices held by employees have been wiped out,” the Examiner reported. “The login pages coming up on these devices have been defaced with the Handala logo.”
Wiper attacks usually involve malicious software designed to overwrite any existing data on infected devices. But a trusted source with knowledge of the attack who spoke on condition of anonymity told KrebsOnSecurity the perpetrators in this case appear to have used a Microsoft service called Microsoft Intune to issue a ‘remote wipe’ command against all connected devices.
Intune is a cloud-based solution built for IT teams to enforce security and data compliance policies, and it provides a single, web-based administrative console to monitor and control devices regardless of location. The Intune connection is supported by this Reddit discussion on the Stryker outage, where several users who claimed to be Stryker employees said they were told to uninstall Intune urgently.
Palo Alto says Handala’s hack-and-leak activity is primarily focused on Israel, with occasional targeting outside that scope when it serves a specific agenda. The security firm said Handala also has taken credit for recent attacks against fuel systems in Jordan and an Israeli energy exploration company.
“Recent observed activities are opportunistic and ‘quick and dirty,’ with a noticeable focus on supply-chain footholds (e.g., IT/service providers) to reach downstream victims, followed by ‘proof’ posts to amplify credibility and intimidate targets,” Palo Alto researchers wrote.
The Handala manifesto posted to Telegram referred to Stryker as a “Zionist-rooted corporation,” which may be a reference to the company’s 2019 acquisition of the Israeli company OrthoSpace.
Stryker is a major supplier of medical devices, and the ongoing attack is already affecting healthcare providers. One healthcare professional at a major university medical system in the United States told KrebsOnSecurity they are currently unable to order surgical supplies that they normally source through Stryker.
“This is a real-world supply chain attack,” the expert said, who asked to remain anonymous because they were not authorized to speak to the press. “Pretty much every hospital in the U.S. that performs surgeries uses their supplies.”
John Riggi, national advisor for the American Hospital Association (AHA), said the AHA is not aware of any supply-chain disruptions as of yet.
“We are aware of reports of the cyber attack against Stryker and are actively exchanging information with the hospital field and the federal government to understand the nature of the threat and assess any impact to hospital operations,” Riggi said in an email. “As of this time, we are not aware of any direct impacts or disruptions to U.S. hospitals as a result of this attack. That may change as hospitals evaluate services, technology and supply chain related to Stryker and if the duration of the attack extends.”
According to a March 11 memo from the state of Maryland’s Institute for Emergency Medical Services Systems, Stryker indicated that some of their computer systems have been impacted by a “global network disruption.” The memo indicates that in response to the attack, a number of hospitals have opted to disconnect from Stryker’s various online services, including LifeNet, which allows paramedics to transmit EKGs to emergency physicians so that heart attack patients can expedite their treatment when they arrive at the hospital.
“As a precaution, some hospitals have temporarily suspended their connection to Stryker systems, including LIFENET, while others have maintained the connection,” wrote Timothy Chizmar, the state’s EMS medical director. “The Maryland Medical Protocols for EMS requires ECG transmission for patients with acute coronary syndrome (or STEMI). However, if you are unable to transmit a 12 Lead ECG to a receiving hospital, you should initiate radio consultation and describe the findings on the ECG.”
This is a developing story. Updates will be noted with a timestamp.
Update, 2:54 p.m. ET: Added comment from Riggi and perspectives on this attack’s potential to turn into a supply-chain problem for the healthcare system.
Update, Mar. 12, 7:59 a.m. ET: Added information about the outage affecting Stryker’s online services.
Recently, we uncovered BeatBanker, an Android‑based malware campaign targeting Brazil. It spreads primarily through phishing attacks via a website disguised as the Google Play Store. To achieve their goals, the malicious APKs carry multiple components, including a cryptocurrency miner and a banking Trojan capable of completely hijacking the device and spoofing screens, among other things. In a more recent campaign, the attackers switched from the banker to a known RAT.
This blog post outlines each phase of the malware’s activity on the victim’s handset, explains how it ensures long‑term persistence, and describes its communication with mining pools.
Key findings:
To maintain persistence, the Trojan employs a creative mechanism: it plays an almost inaudible audio file on a loop so it cannot be terminated. This inspired us to name it BeatBanker.
It monitors battery temperature and percentage, and checks whether the user is using the device.
At various stages of the attack, BeatBanker disguises itself as a legitimate application on the Google Play Store and as the Play Store itself.
It deploys a banker in addition to a cryptocurrency miner.
When the user tries to make a USDT transaction, BeatBanker creates overlay pages for Binance and Trust Wallet, covertly replacing the destination address with the threat actor’s transfer address.
New samples now drop BTMOB RAT instead of the banking module.
Initial infection vector
The campaign begins with a counterfeit website, cupomgratisfood[.]shop, that looks exactly like the Google Play Store. This fake app store contains the “INSS Reembolso” app, which is in fact a Trojan. There are also other apps that are most likely Trojans too, but we haven’t obtained them.
The INSS Reembolso app poses as the official mobile portal of Brazil’s Instituto Nacional do Seguro Social (INSS), a government service that citizens can use to perform more than 90 social security tasks, from retirement applications and medical exam scheduling to viewing CNIS (National Registry of Social Information), tax, and payment statements, as well as tracking request statuses. By masquerading as this trusted platform, the fake page tricks users into downloading the malicious APK.
Packing
The initial APK file is packed and makes use of a native shared library (ELF) named libludwwiuh.so that is included in the application. Its main task is to decrypt another ELF file that will ultimately load the original DEX file.
First, libludwwiuh.so decrypts an embedded encrypted ELF file and drops it to a temporary location on the device under the name l.so. The same code that loaded the libludwwiuh.so library then loads this file, which uses the Java Native Interface (JNI) to continue execution.
l.so – the DEX loader
The library does not have calls to its functions; instead, it directly calls the Java methods whose names are encrypted in the stack using XOR (stack strings technique) and restored at runtime:
Initially, the loader makes a request to collect some network information using https://ipapi.is to determine whether the infected device is a mobile device, if a VPN is being used, and to obtain the IP address and other details.
This loader is engineered to bypass mobile antivirus products by utilizing dalvik.system.InMemoryDexClassLoader. It loads malicious DEX code directly into memory, avoiding the creation of any files on the device’s file system. The necessary DEX files can be extracted using dynamic analysis tools like Frida.
Furthermore, the sample incorporates anti-analysis techniques, including runtime checks for emulated or analysis environments. When such an environment is detected (or when specific checks fail, such as verification of the supported CPU_ABI), the malware can immediately terminate its own process by invoking android.os.Process.killProcess(android.os.Process.myPid()), effectively self-destructing to hinder dynamic analysis.
After execution, the malware displays a user interface that mimics the Google Play Store page, showing an update available for the INSS Reembolso app. This is intended to trick victims into granting installation permissions by tapping the “Update” button, which allows the download of additional hidden malicious payloads.
The payload delivery process mimics the application update. The malware uses the REQUEST_INSTALL_PACKAGES permission to install APK files directly into its memory, bypassing Google Play. To ensure persistence, the malware keeps a notification about a system update pinned to the foreground and activates a foreground service with silent media playback, a tactic designed to prevent the operating system from terminating the malicious process.
Crypto mining
When UPDATE is clicked on a fake Play Store screen, the malicious application downloads and executes an ELF file containing a cryptomining payload. It starts by issuing a GET request to the C2 server at either hxxps://accessor.fud2026.com/libmine-<arch>.so or hxxps://fud2026.com/libmine-<arch>.so. The downloaded file is then decrypted using CipherInputStream(), with the decryption key being derived from the SHA-1 hash of the downloaded file’s name, ensuring that each version of the file is encrypted with a unique key. The resulting file is renamed d-miner.
The decrypted payload is an ARM-compiled XMRig 6.17.0 binary. At runtime, it attempts to create a direct TCP connection to pool.fud2026[.]com:9000. If successful, it uses this endpoint; otherwise, it automatically switches to the proxy endpoint pool-proxy.fud2026[.]com:9000. The final command-line arguments passed to XMRig are as follows:
-o pool.fud2026[.]com:9000 or pool-proxy.fud2026[.]com:9000 (selected dynamically)
-k (keepalive)
--tls (encrypted connection)
--no-color (disable colored output)
--nicehash (NiceHash protocol support)
C2 telemetry
The malware uses Google’s legitimate Firebase Cloud Messaging (FCM) as its primary command‑and‑control (C2) channel. In the analyzed sample, each FCM message received triggers a check of the battery status, temperature, installation date, and user presence. A hidden cryptocurrency miner is then started or stopped as needed. These mechanisms ensure that infected devices remain permanently accessible and responsive to the attacker’s instructions, which are sent through the FCM infrastructure. The attacker monitors the following information:
isCharging: indicates whether the phone is charging;
batteryLevel: the exact battery percentage;
isRecentInstallation: indicates whether the application was recently installed (if so, the implant delays malicious actions);
isUserAway: indicates whether the user is away from the device (screen off and inactive);
overheat: indicates whether the device is overheating;
temp: the current battery temperature.
Persistence
The KeepAliveServiceMediaPlayback component ensures continuous operation by initiating uninterrupted playback via MediaPlayer. It keeps the service active in the foreground using a notification and loads a small, continuous audio file. This constant activity prevents the system from suspending or terminating the process due to inactivity.
The identified audio output8.mp3 is five seconds long and plays on a loop. It contains some Chinese words.
Banking module
BeatBanker compromises the machine with a cryptocurrency miner and introduces another malicious APK that acts as a banking Trojan. This Trojan uses previously obtained permission to install an additional APK called INSS Reebolso, which is associated with the package com.destination.cosmetics.
Similar to the initial malicious APK, it establishes persistence by creating and displaying a fixed notification in the foreground to hinder removal. Furthermore, BeatBanker attempts to trick the user into granting accessibility permissions to the package.
Leveraging the acquired accessibility permissions, the malware establishes comprehensive control over the device’s user interface.
The Trojan constantly monitors the foreground application. It targets the official Binance application (com.binance.dev) and the Trust Wallet application (com.wallet.crypto.trustapp), focusing on USDT transactions. When a user tries to withdraw USDT, the Trojan instantly overlays the target app’s transaction confirmation screen with a highly realistic page sourced from Base64-encoded HTML stored in the banking module.
The module captures the original withdrawal address and amount, then surreptitiously substitutes the destination address with an attacker-controlled one using AccessibilityNodeInfo.ACTION_SET_TEXT. The overlay page shows the victim the address they copied (for Binance) or just shows a loading icon (for Trust Wallet), leading them to believe they are remitting funds to the intended wallet when, in fact, the cryptocurrency is transferred to the attacker’s designated address.
Fake overlay pages: Binance (left) and Trust Wallet (right)
Target browsers
BeatBanker’s banking module monitors the following browsers installed on the victim’s device:
Chrome
Firefox
sBrowser
Brave
Opera
DuckDuckGo
Dolphin Browser
Edge
Its aim is to collect the URLs accessed by the victim using the regular expression ^(?:https?://)?(?:[^:/\\\\]+\\\\.)?([^:/\\\\]+\\\\.[^:/\\\\]+). It also offers management functionalities (add, edit, delete, list) for links saved in the device’s default browser, as well as the ability to open links provided by the attacker.
C2 communication
BeatBanker is also designed to receive commands from the C2. These commands aim to collect the victim’s personal information and gain complete control of the device.
Command
Description
0
Starts dynamic loading of the DEX class
Update
Simulates software update and locks the screen
msg:
Displays a Toast message with the provided text
goauth<*>
Opens Google Authenticator (if installed) and enables the AccessService.SendGoogleAuth flag used to monitor and retrieve authentication codes
kill<*>
Sets the protection bypass flag AccessService.bypass to “True”
and sets the initializeService.uninstall flag to “Off”
srec<*>
Starts or stops audio recording (microphone), storing the recorded data in a file with an automatically generated filename. The following path format is used to store the recording: /Config/sys/apps/rc/<timestamp>_0REC<last5digits>.wav
pst<*>
Pastes text from the clipboard (via Accessibility Services)
GRC<*>
Lists all existing audio recording files
gtrc<*>
Sends a specific audio recording file to the C2
lcm<*>
Lists supported front camera resolutions
usdtress<*>
Sets a USDT cryptocurrency address when a transaction is detected
lnk<*>
Opens a link in the browser
EHP<*>
Updates login credentials (host, port, name) and restarts the application
ssms<*>
Sends an SMS message (individually or to all contacts)
CRD<*>
Adds (E>) or removes (D>) packages from the list of blocked/disabled applications
SFD<*>
Deletes files (logs, recordings, tones) or uninstalls itself
adm<>lck<>
Immediately locks the screen using Device Administrator permissions
adm<>wip<>
Performs a complete device data wipe (factory reset)
Aclk<*>
Executes a sequence of automatic taps (auto-clicker) or lists existing macros
KBO<*>lod
Checks the status of the keylogger and virtual keyboard
KBO<*>AKP/AKA
Requests permission to activate a custom virtual keyboard or activates one
Requests Draw Over Other Apps permission (overlay)
RPM<*>INST
Requests permission to install apps from unknown sources (Android 8+)
ussd<*>
Executes a USSD code (e.g., *#06# for IMEI)
Blkt<*>
Sets the text for the lock overlay
BLKV<*>
Enables or disables full-screen lock using WindowManager.LayoutParams.TYPE_APPLICATION_OVERLAY to display a black FrameLayout element over the entire screen
SCRD<> / SCRD2<>
Enables/disables real-time screen text submission to the C2 (screen reading)
Controls VPN and firewall (status, block/allow apps, enable/disable)
noti<*>
Creates persistent and custom notifications
sp<*>
Executes a sequence of swipes/taps (gesture macro)
lodp<*>
Manages saved links in the internal browser (add, edit, delete, list)
scc:
Starts screen capture/streaming
New BeatBanker samples dropping BTMOB
Our recent detection efforts uncovered a campaign leveraging a fraudulent StarLink application that we assess as being a new BeatBanker variant. The infection chain mirrored previous instances, employing identical persistence methods – specifically, looped audio and fixed notifications. Furthermore, this variant included a crypto miner similar to those seen previously. However, rather than deploying the banking module, it was observed distributing the BTMOB remote administration tool.
The BTMOB APK is highly obfuscated and contains a class responsible for configuration. Despite this, it’s possible to identify a parser used to define the application’s behavior on the device, as well as persistence features, such as protection against restart, deletion, lock reset, and the ability to perform real-time screen recording.
String decryption
The simple decryption routine uses repetitive XOR between the encrypted data and a short key. It iterates through the encrypted text byte by byte, repeating the key from the beginning whenever it reaches the end. At each position, the sample XORs the encrypted byte with the corresponding byte of the key, overwriting the original. Ultimately, the modified byte array contains the original text, which is then converted to UTF-8 and returned as a string.
Malware-as-a-Service
BTMOB is an Android remote administration tool that evolved from the CraxsRAT, CypherRAT, and SpySolr families. It provides full remote control of the victim’s device and is sold in a Malware-as-a-Service (MaaS) model. On July 26, 2025, a threat actor posted a screenshot of the BTMOB RAT in action on GitHub under the username “brmobrats”, along with a link to the website btmob[.]xyz. The website contains information about the BTMOB RAT, including its version history, features, and other relevant details. It also redirects to a Telegram contact. Cyfirma has already linked this account to CraxsRAT and CypherRAT.
Recently, a YouTube channel was created by a different threat actor that features videos demonstrating how to use the malware and facilitate its sale via Telegram.
We also saw the distribution and sale of leaked BTMOB source code on some dark web forums. This may suggest that the creator of BeatBanker acquired BTMOB from its original author or the source of the leak and is utilizing it as the final payload, replacing the banking module observed in the INSS Reebolso incident.
In terms of functionality, BTMOB maintains a set of intrusive capabilities, including: automatic granting of permissions, especially on Android 13–15 devices; use of a black FrameLayout overlay to hide system notifications similar to the one observed in the banking module; silent installation; persistent background execution; and mechanisms designed to capture screen lock credentials, including PINs, patterns, and passwords. The malware also provides access to front and rear cameras, captures keystrokes in real time, monitors GPS location, and constantly collects sensitive data. Together, these functionalities provide the operator with comprehensive remote control, persistent access, and extensive surveillance capabilities over compromised devices.
Victims
All variants of BeatBanker – those with the banking module and those with the BTMOB RAT – were detected on victims in Brazil. Some of the samples that deliver BTMOB appear to use WhatsApp to spread, as well as phishing pages.
Conclusion
BeatBanker is an excellent example of how mobile threats are becoming more sophisticated and multi-layered. Initially focused in Brazil, this Trojan operates a dual campaign, acting as a Monero cryptocurrency miner, discreetly draining your device’s battery life while also stealing banking credentials and tampering with cryptocurrency transactions. Moreover, the most recent version goes even further, substituting the banking module with a full-fledged BTMOB RAT.
The attackers have devised inventive tricks to maintain persistence. They keep the process alive by looping an almost inaudible audio track, which prevents the operating system from terminating it and allows BeatBanker to remain active for extended periods.
Furthermore, the threat demonstrates an obsession with staying hidden. It monitors device usage, battery level and temperature. It even uses Google’s legitimate system (FCM) to receive commands. The threat’s banking module is capable of overlaying Binance and Trust Wallet screens and diverting USDT funds to the criminals’ wallets before the victim even notices.
The lesson here is clear: distrust is your best defense. BeatBanker spreads through fake websites that mimic Google Play, disguising itself as trustworthy government applications. To protect yourself against threats like this, it is essential to:
Download apps only from official sources. Always use the Google Play Store or the device vendor’s official app store. Make sure you use the correct app store app, and verify the developer.
Check permissions. Pay attention to the permissions that applications request, especially those related to accessibility and installation of third-party packages.
Keep the system updated. Security updates for Android and your mobile antivirus are essential.
Our solutions detect this threat as HEUR:Trojan-Dropper.AndroidOS.BeatBanker and HEUR:Trojan-Dropper.AndroidOS.Banker.*

 Entrar