Meta won’t judge employees by how much they use AI when it comes to annual performance reviews, despite early efforts to drive AI adoption focusing on so-called token maxing.
The company has told employees that it “will not use AI adoption dashboards or token counts to evaluate impact,” according to a report by The Information.
The announcement came in an internal memo from executives Maher Saba and Santosh Janardhan, which said that instead of measuring AI usage, “managers should look at output quality, velocity, problem complexity and scope taken on.”
This marks a culture change for Meta, where engineers had previously competed to consume the most AI tokens, displaying their scores on a leaderboard. Meta then discovered that its employees were being diverted from regular work because they were using AI to carry out additional tasks to boost their scores.
Amazon had similar results when it implemented a leaderboard to track AI use; it also found that some employees were trying to game the system by using AI to complete unnecessary tasks, and it has now deleted it.
Meta had already started to look askance at the concept of using AI metrics as a tool to assess employees. Earlier this year, Chief Technology Officer Andrew Bosworth told employees in a memo that “nobody should be using AI tools just for the sake of using them,” adding that “token usage alone is not a measure of impact of any kind.”
As spending on cloud technologies grows, so does waste. The Flexera 2026 State of the Cloud Report found that 27% of organizations expect to spend more on cloud this year, with 17% already exceeding their budgets over the previous 12 months. The estimated share of wasted cloud spend has already crept up to 29%, undoing several years of progress, undoing several years of progress.
Companies are rapidly investing in cloud technology, but often understand less about how to use it fully and efficiently. That is not a coincidence, and it is exactly the gap FinOps is meant to close. It is also why the practice is moving out of the finance department and into the strategy conversation.
What is FinOps?
FinOps is a blended operational framework that maximizes technology value by uniting engineering (DevOps), finance, and business teams. It involves close collaboration to break down silos between tech and finance, with shared ownership of cloud spend across engineering, finance, and business teams.
What distinguishes FinOps is real-time visibility into what is being spent and why. It also treats optimization as continuous work rather than an annual cleanup exercise.
FinOps is important because cloud spending isn’t like a typical budget line. It’s more variable and usage-based, so relying on an annual review doesn’t work. Engineers can quickly create infrastructure, scale it, and tear it back down in a day, making forecasting more challenging than in the past.
What FinOps does is change who sees what. Engineers have more insight into the actual cost of a build. Finance gets numbers it can trust. Business leaders can tie spending directly to business outcomes. It removes much of the guesswork and turns cost data into a shared language rather than a monthly surprise.
As Siarhei Sukhadolski, Chief Delivery Officer & Head of Competence Center at Innowise, puts it, “For a long time, FinOps meant only cutting the bill: find the unused stuff, resize a few instances, and report the savings. That still matters, but it’s not what separates companies today. The ones pulling ahead are using FinOps to make faster, smarter calls about where their tech spend actually pays off. That’s a different job, and it shows up directly in how fast a company can move.”
How FinOps spending has changed
Only a few years ago, FinOps was mostly focused on cloud infrastructure spending. Today, that focus increasingly includes AI-specific investment. The FinOps Foundation 2026 State of FinOps Report found that 98% of organizations now manage AI spend specifically. FinOps has also expanded well beyond cloud infrastructure. It’s more common now to see FinOps coverage extend to licensing (64%), private cloud (57%), and data centers (48%). Around 90% also manage SaaS spend or plan to do so within the next year.
It’s also worth noting that the same FinOps Foundation report found that 78% of teams report directly to the CTO or CIO rather than operating solely within finance departments. To us, that reporting line says a lot. It suggests that companies increasingly see technology spending as a strategic lever rather than simply a line item to reconcile.
How AI and cloud spending are moving in the same direction
The trend toward bringing AI and a broader range of technology spending into FinOps is backed up by a Gartner report, which estimates that global IT spending will hit $6.31 trillion by the end of 2026. That’s up 13.5% from the previous year. Data center systems spending is expected to grow 55.8%, with generative AI model spending more than doubling over the same timeframe. Gartner, in a separate forecast, expects public cloud services to grow by 21.3% in 2026, with the market reaching $1.48 trillion in value by the end of 2029.
We see these figures as two sides of the same shift. AI workloads are also usage-based, which makes them more unpredictable, partly because some teams haven’t had to consider unit economics before. A fine-tuning run or a forgotten inference endpoint can quickly become one of the biggest items on a cloud bill. Most teams don’t have the tagging, forecasting, or accountability needed to catch those costs before they get out of control.
“AI spend just behaves differently from a normal application workload. It spikes, it’s hard to pin on one team or feature, and you often don’t know the real cost per outcome until the invoice lands. Companies that already had solid FinOps habits before AI adoption took off are adjusting faster because visibility and ownership were already part of how they worked. Companies that treated FinOps as an annual cleanup are the ones getting caught out.”
Siarhei Sukhadolski, Chief Delivery Officer & Head of Competence Center at Innowise
Why visibility and shared spend ownership create an advantage
Flexera numbers on discount usage point to the same issue: fewer than 50% of organizations are using the most basic cost optimization tools. The adoption of tools like reserved instances or savings plans is slow, with only 48% of companies using Google Committed Use Discounts and 45% using AWS Reserved Instances. Too many others are leaving low-risk savings on the table.
In many cases, the real problem is a lack of ownership and visibility. If no team owns the cost of a workload, no one has enough reason or enough information to choose the right pricing model. That is where the competitive gap starts to open: some companies can explain and act on their spend quickly, while others cannot.
“A mistake we still see a lot is trying to optimize the bill instead of the system behind it. Deleting unused resources saves money once. Redesigning how workloads scale, how environments get spun up, and who’s on the hook for what keeps costs under control for good. That’s the difference that turns into a real competitive edge later.”
Siarhei Sukhadolski, Chief Delivery Officer & Head of Competence Center at Innowise
What visibility and shared ownership look like
FinOps operates well when at least three structures are in place.
Every workload or inference endpoint has a clear owner tied to its cost.
Cost and usage data are shared and available to everyone who needs them before they have to ask.
There is an ongoing review cadence designed around continuous optimization.
Teams that jump into dashboards before assigning ownership and establishing the data flow often end up with visibility but no accountability. Teams that start with ownership, even with basic tooling, get a different result. They tend to see savings stick instead of resetting every few months. That proper order is the single biggest predictor we have seen across cloud and AI cost engagements.
What business leaders need to know
There is a simple test a CEO or CFO should apply to FinOps. It’s whether the company can clearly state what a workload costs and whether it is worth that cost right now. Does it take finance three weeks to answer? Can the company provide an answer in real time? Are there live numbers and clear ownership behind every workload? That is what will enable leaders to make confident calls on where to invest and where to pull back.
FinOps is becoming a proxy for how well a company manages technology. With shared ownership comes high visibility. Add in continuous optimization and companies gain an advantage. These are not just cost-saving tactics. They represent operational discipline, separating those who can move quickly on AI from those who spend heavily only to find themselves still behind the rest of the pack.
Organizations often celebrate an AI launch at the moment the real work begins. The platform is available, the policy is published and employees have completed training. But none of those milestones tells a CIO whether work has improved, decisions are stronger or employees know when human judgment must override an AI recommendation.
This gap is visible in Kyndryl’s 2026 People Readiness Report. In a survey of 1,100 senior business and technology leaders across eight countries, 57% said AI was embedded in core processes or deployed broadly, while only 23% described their workforce as fully ready to use it successfully. Just 32% said their organizations had achieved at least one of their top two AI objectives. Technology deployment is advancing faster than the organizational capacity needed to turn it into value.
In transformation work, I have learned to be cautious when activity is presented as evidence of adoption. License activation, training attendance and prompt volume are easy to count. They do not show whether people can apply AI responsibly in a workflow or whether that workflow produces a better outcome.
Many CIOs now recognize that usage does not equal value. The next challenge is more difficult: creating an evidence chain that explains not only whether results changed, but why. That chain connects four layers – readiness, demonstrated capability, workflow behavior and business results.
Why deployment measures are insufficient
Many programs still treat workforce readiness as a downstream activity. Leaders select a platform, configure technical controls and announce availability. Training is then expected to solve every remaining problem: unclear use cases, employee anxiety, weak manager support, policy uncertainty and processes that were never redesigned.
When employees hesitate, leaders may interpret that hesitation as resistance. In my experience, it is often a rational response to ambiguity. People may not know which data they can use, whether an output must be verified, who remains accountable for a decision or how AI will affect the value of their role. A generic demonstration cannot answer questions that are specific to a job and workflow.
One practical readiness test I use is to ask people in different roles to describe the same AI-enabled workflow. Can they agree on its purpose, the information the system may use, the person who owns the outcome and the point at which a human must intervene? If not, the organization is not ready to scale. That disagreement is valuable evidence: It gives leaders a specific agenda for process design, communication, governance or learning.
Human involvement also should not be defined uniformly. A Stanford Digital Economy Lab study collected preferences from 1,500 domain workers and assessments from AI experts covering more than 844 tasks across 104 occupations. It found varied expectations for the level of human agency different tasks should retain. The practical implication is that leaders should not frame every use case as a choice between full automation and no automation. They should define the degree of human judgment each task requires.
Build an evidence chain for changed work
A useful AI adoption scorecard should answer four executive questions.
Readiness: Do people understand the purpose and boundaries? Readiness is more than awareness that a tool exists. Employees should be able to explain what the use case is intended to improve, which data is permitted, what outputs require validation, who owns the final decision and how to escalate a concern. Measure this with short scenario-based checks rather than confidence surveys alone. Present a realistic situation involving restricted data, an uncertain output or an exception to the normal process. Ask employees what they would do and why. A high self-reported comfort score is not a substitute for a correct decision.
Capability: Can people demonstrate the required judgment? Enterprise AI literacy provides a common foundation, but adoption requires role-based practice. A finance analyst, field supervisor and HR partner may share responsible-use principles, but they should not receive identical exercises or be assessed against identical criteria. Capability evidence should come from a demonstration in a realistic environment. Can the employee identify a plausible error, validate an important claim, document the basis for a decision and recognize when the case exceeds the system’s approved scope? This moves measurement from course completion to observable proficiency.
Behavior: Is the approved workflow being followed? Behavior measures whether the new practice has become part of the work. Platform analytics can contribute evidence, but they are not enough. CIOs also need to know whether people are completing required reviews, documenting decisions, escalating exceptions and avoiding unapproved workarounds. The target should not automatically be maximum usage. Some cases should remain human-only, and a high override or escalation rate may signal good judgment rather than poor adoption. Metrics must be interpreted in the context of the workflow and its risk.
Results: Did performance improve without unacceptable tradeoffs? Results should be defined before a pilot begins and compared with a credible pre-AI baseline or control group. Depending on the workflow, the relevant measures might include cycle time, first-pass quality, rework, error rates, cost, safety, risk events or stakeholder experience. Efficiency should always be paired with a quality or risk guardrail. Faster output is not progress if it creates more corrections, weakens decisions or transfers hidden work to another team.
In practice, consider an AI-assisted security-alert triage workflow. The desired outcome might be a reduction in the time required to classify high-priority alerts. The human accountability point is explicit: An analyst approves the severity classification and response action.
Readiness means analysts understand which information may enter the system and when escalation is mandatory. Capability means they can detect a plausible but incorrect severity recommendation. Behavior means eligible alerts move through the approved review path, with overrides and escalations recorded. Results mean triage time improves without increasing false negatives or delaying containment.
I recommend assigning an owner, evidence source, review cadence and decision threshold to each layer. The pilot should scale only when the desired behavior appears and the business outcome improves without breaching its quality, safety or risk guardrail. If usage rises but capability or results do not, the response should not automatically be more training. The use case, workflow, controls or management support may need to change.
This approach also makes cross-functional accountability clearer. IT enables the platform, data and controls. Business leaders define the work and desired result. Human resource and learning leaders build capability. Legal, compliance and security clarify boundaries. Managers reinforce behavior, while employees contribute the operating knowledge needed to make the workflow effective. The CIO’s orchestration role is to keep those contributions connected to the same outcome.
A 30-day test CIOs can start now
The World Economic Forum’s Future of Jobs Report 2025 found that 63% of surveyed employers viewed skills gaps as a leading barrier to business transformation. In response to expected AI disruption, 77% planned to reskill or upskill existing employees by 2030. More learning activity alone will not close the gap. Leaders must determine whether learning changes decisions, practices and results.
Over the next 30 days, ask each participating business unit to select one workflow and do six things:
Establish its current performance baseline.
Define one outcome AI is expected to improve.
Name the person accountable for the workflow result.
Identify one behavior that must change and one human decision that must remain.
Set a quality, safety or risk guardrail that cannot be traded for speed.
Review evidence from all four layers weekly and decide whether to scale, redesign or stop.
This creates a much stronger management conversation than reporting licenses, course completions or prompt counts. It shows where the evidence chain is breaking. A team may understand the rules but cannot challenge outputs. Employees may be capable but unable to use the approved tool within the actual process. The behavior may change while the business result remains flat. Each pattern calls for a different intervention.
Durable AI value will not come from the highest volume of activity. It will come from making expectations clear, giving employees realistic opportunities to practice, instrumenting how work changes and holding each use case to an explicit outcome and guardrail. A deployment turns the system on. Adoption changes how work is done. The evidence chain tells a CIO whether that change deserves to scale.
Cortney Pagel has learned to expect a particular question whenever she proposes changing how work gets done. Pagel, a senior business analyst and change manager at ENGIE Impact, often hears it from the digital side of the organization before she has finished explaining the change: How much money are we looking to save here? “I don’t always have an answer,” she says. “And so that is very frustrating for me.”
The frustration comes from a familiar structural problem. Most financial systems connect money to departments, accounts, cost centers and, in more mature implementations, activities; however, they rarely connect economics to the anatomy of the work itself. Pagel describes processes that are still too manual to be tracked cleanly, while in other cases the financial detail exists but was never tied to the process model. For a period, she resorted to putting cost estimates in comment bubbles on process diagrams because there was no systematic place for them. “There’s been no great system or method to do it,” she says. “It’s definitely not just me.”
The question she keeps being asked therefore exposes a broader lacuna in management accounting. Finance can usually explain what a process consumes, and it can often estimate what a proposed change might save. Yet it is far less equipped to show which process components contribute value, which destroy it, which absorb risk and which create information or options whose economic effects may surface much later. Consequently, a transformation business case can become highly precise about one side of the equation while leaving the other largely narrative.
A ledger on the ledge of usefulness
The general ledger reports what a department or cost center consumes. Activity-based costing (ABC), where organizations have implemented it with sufficient discipline, pushes that resolution further by assigning costs to activities. Both approaches remain useful; nonetheless, their analytical center of gravity is consumption rather than contribution. They can tell management where resources were spent with increasing granularity, while offering much less visibility into what an individual activity economically produced.
Double-entry accounting, dating back 500 years to Venetian merchants, earns its reputation for symmetry, although the symmetry belongs primarily to bookkeeping. The two sides of an entry describe the same financial event, while revenue generally appears when a transaction is recognized rather than carrying a lineage back through the many process components that helped create it. A renewal, expansion, avoided loss, faster decision or improved customer relationship may depend on dozens of steps, yet the contribution of any one step rarely has an account to which it can be posted.
This creates an analytical asymmetry that can influence investment decisions more than finance leaders may realize. When a CFO or operating executive evaluates a proposed process change, the cost side often arrives quantified while the value side arrives as prose, judgment or a collection of indirect metrics. The quantified side therefore tends to carry disproportionate weight because it is already denominated in the unit in which the decision is made: money. Indeed, acknowledged uncertainty may be safer than one-sided precision, because the latter can carry the authority of a number while obscuring what the model omitted.
One process, many economic artifacts
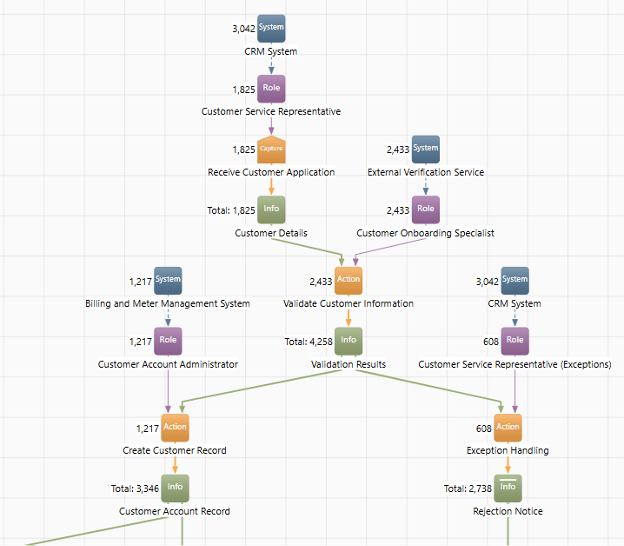
Consider the process of customer onboarding. Operationally, it is a sequence of tasks needed to establish a customer, configure services, obtain approvals and move the relationship into a steady state. Economically, however, those same steps may establish relationship patterns that influence retention, create the account depth that enables a later cross-sell, generate behavioral and preference data whose usefulness compounds over the customer lifecycle, and reduce churn risk through investments made well before the customer has a reason to leave.
Embedded in that same process may be approval controls whose original compliance rationale has waned, manual handoffs between systems that were never integrated, duplicate checks and wait times that gradually erode the loyalty the process was intended to build. Some components may therefore create value; others may protect it and still others may quietly consume it. Yet a conventional cost model compresses this heterogeneous mesh (or mess!) of economic activity into a single process cost, which is useful but incomplete.
Improving or transforming the process requires a more discriminating account of what each component is doing economically: which steps build value, which erode it, which create unnecessary friction, which absorb risk, which generate ancillary benefits and which perform economic work that becomes visible only after the step is removed. Without that component-level view, an efficiency initiative can readily eliminate something valuable simply because its cost was easier to suss than its contribution.
Sample customer onboarding — economic process model.
Economic process modeling (EPM) supplies that missing layer. As I described in a recent column, Business Transformation Needs a True Economic Approach Rather Than Guesswork, EPM decomposes a process into its constituent components—the information flows, human decisions, system actions and organizational touchpoints that make up the actual work—and then attributes economic effects to each across five dimensions: revenue contribution, cost and friction, risk exposure, option value and information value.
The component level matters because the economically significant finding often sits buried within the process as a whole. Two steps that look roughly equivalent on a process diagram may carry very different economic profiles once attribution is applied. A seemingly minor validation step, for example, may generate information that reduces downstream risk, while a more conspicuous approval step may be largely vestigial. A cost-only review can easily misread the two because it sees effort more readily than consequence.
Pagel describes the capability she wants in similarly practical terms: the ability to see processes at an organizational level, understand what they cost in aggregate and then break those economics down step by step. That level of resolution helps because process transformation decisions are rarely made at the level of an abstract end-to-end flow; they are made by automating, eliminating, combining, outsourcing or redesigning individual components. Consequently, finance needs an economic view at the same level where the design decision is actually being made.
The oft-ignored value of information itself
Information value is where this analytical oversight may be most acute, particularly because most processes today generate data as a byproduct of execution. For example, a credit review produces repayment-behavior signals, a claims intake creates fraud indicators, and a procurement approval accumulates supplier-performance evidence. Those outputs may have future utility well beyond the transaction or process that generated them, even though conventional cost accounting typically has no place to represent them.
Most organizations, however, still treat much of this data primarily as documentation, exhaust or a compliance burden rather than as a potentially monetizable asset. A process redesign can therefore appear efficient while externalizing, degrading or destroying information whose economic contribution was absent from the business case. Infonomics, the discipline of treating information as an economic asset with attributable value, provides the grounding for this dimension of EPM and helps expose value that can otherwise disappear during an ostensibly sensible transformation.
From cost review to capital allocation
EPM extends cost accounting by adding an economic perspective the ledger wasn’t designed for. Sure, cost remains an indispensable computation. However, the business case becomes materially more complete when the components proposed for automation or elimination are also evaluated for revenue contribution, risk absorption, optionality, information yield and the friction they create or remove.
This can change the quality of the capital-allocation discussion. A step that costs $500,000 annually certainly may be a strong automation candidate, yet the savings figure is incomplete if the same step prevents $2 million in avoidable losses, preserves a customer relationship, generates valuable information or creates an option the business may need later. Conversely, a relatively inexpensive step can still be economically destructive if it adds delay, rework or customer attrition. The point is not to manufacture spurious precision around every benefit; rather, it is to make the relevant sources of value visible, estimable and subject to the same scrutiny as cost.
Which brings us back to Pagel and the question she hears whenever she proposes a change: “How much money are we looking to save here?” Savings are only one side of the economic case. The more consequential question may be what each affected component contributes today, what value may disappear if it is changed, and what new value the redesigned process could create.
Indeed, a transformation can look compelling when the savings are visible and the value at risk remains invisible. Economic process modeling gives finance a way to juxtapose both in the analysis, so that a proposed change can be judged not merely by what the organization expects to spend less, but by what the work itself is actually worth.
The advent of AI is precisely why organizations need technology economists, not just IT finance professionals.
IT finance is primarily concerned with budgeting, accounting, cost allocation, depreciation, chargebacks and financial reporting. These disciplines remain important, but they assume a relatively stable relationship between technology spending and business outcomes. AI breaks that assumption.
Technology economics asks a fundamentally different question: How do technology investments create, destroy, shift or delay economic value?
AI introduces a set of economic dynamics that traditional IT finance was never designed to evaluate.
AI creates non-linear economics
In traditional IT, spending $10 million typically produced a somewhat predictable capacity increase or operational improvement.
With AI, a $10 million investment might generate $100 million in value. It might generate no value at all. It could increase costs while appearing successful. It could also create strategic advantages that do not show up in financial statements for years.
A technology economist studies the relationship between technology inputs, organizational capability, productivity outcomes and economic value creation.
IT finance largely records the spending.
AI changes the economics of labor
AI is not merely another technology platform. It acts as a form of digital labor.
Organizations now face questions such as:
Should work be done by humans, AI, automation or a combination?
What is the marginal cost of an AI-generated transaction versus a human-generated one?
How does AI affect productivity elasticity?
When does AI create labor substitution versus labor augmentation?
These are economic questions, not accounting questions.
AI simultaneously creates technology inflation and deflation
A fascinating paradox is emerging: AI can reduce costs in some areas while dramatically increasing costs elsewhere.
For example, fewer coding hours. More GPU costs. Lower service desk costs. Higher cybersecurity costs. Reduced consulting expenses. Increased data management expenses.
Technology economists study entire economic systems and value chains.
IT finance often sees only line items.
AI requires measuring economic outcomes, not technology outputs
Historically, organizations measured projects delivered, systems implemented, budgets achieved and uptime percentages.
The AI era requires measuring:
Revenue generated
Margin improvement
Risk reduction
Productivity gains
Decision quality improvement
Time-to-market acceleration
Innovation capacity
Technology economists focus on these outcome measures.
This is one reason why AI performance measurement frameworks, including AI-focused balanced scorecard approaches, are becoming increasingly important.
AI introduces massive opportunity costs
One of the largest AI risks is not technological failure.
It is investing in the wrong AI initiatives.
A bank might spend $50 million building an AI solution that saves $5 million annually while ignoring another opportunity that could have generated $500 million in new revenue.
Technology economics focuses on capital allocation efficiency, opportunity cost, marginal returns and portfolio optimization.
These concepts sit outside traditional IT finance.
AI makes technology a strategic production function
Historically, technology supported the business.
Increasingly, technology is the business.
In many industries, AI determines customer experience, operating efficiency, innovation speed and competitive advantage.
Technology is becoming a primary production factor alongside labor, capital and natural resources.
Organizations therefore need experts who understand the economics of technology as a production asset.
AI creates new forms of technical and economic debt
Many organizations are deploying AI rapidly without understanding:
Long-term infrastructure costs
Model maintenance costs
Data quality costs
Governance costs
Security costs
Regulatory costs
A technology economist examines the total lifecycle economics.
The cheapest AI solution today may become the most expensive solution over the next decade.
Why this matters
The central challenge of the AI era is no longer “Can we build it?”
The challenge is, “Should we build it, where should we deploy it, what value will it create, what risks will it introduce and what is the optimal economic allocation of technology capital?”
Those are technology economics questions.
IT finance professionals are essential for controlling and reporting technology spending.
Technology economists are essential for determining whether that spending creates sustainable economic value.
As AI becomes embedded into every business process, the organizations that outperform will not necessarily be those with the biggest AI budgets. They will be those that best understand the economics of technology itself — how AI, data, infrastructure, labor, risk and innovation combine to create measurable business value. That is the domain of technology economics.
Somebody in finance has already forwarded you the pricing comparison. A downloadable frontier-class model at a fraction of what you’re paying now, with the obvious question attached: why are we still on flagship rates? The honest answer comes in two halves. Open weights are the best thing to happen to enterprise AI buyers since the category existed, and switching to one still won’t lower your bill this year. Both of those are true, and the gap between them is where the useful work sits.
How we got here
In mid-July, a 2.8-trillion-parameter open-weight model shipped with performance close to the commercial frontier, and the full weights followed ten days later under a custom license. Markets moved before Washington did. Semiconductors were hit hardest that session and one widely held chip ETF finished the week almost 9% lower (CNBC). Washington began weighing restrictions on open-weight models soon after, and the industry answered inside a fortnight.
On July 24, twenty-five companies published a letter asking policymakers to leave downloadable model weights alone (Tom’s Hardware). Not a single founding signatory sold access to a closed-frontier model. Three major labs were absent at launch, two signed within 72 hours (TheNextWeb) and the roster passed 270 organizations inside ten days (Forbes). The sole holdout published its position days later, agreeing with much of the letter while disputing two safety claims.
What open weights hand you
Start with what genuinely changed, because it’s larger than the coverage suggests. A downloadable model at frontier-class capability puts a permanent public floor under what that capability can be sold for. But no supplier prices at whatever the market will bear once a comparable input is obtainable elsewhere, and that shift doesn’t reverse.
Stakeholders already know how to think about this. They just haven’t been filing AI under the right heading, which is concentration risk. A single provider holding a load-bearing production input, controlling both pricing and release schedule, would sit on the risk register in any other procurement category. The only reason AI was able to bypass this was that there was no alternative worth naming. Now there is one. The leverage shows up at renewal whether or not you ever deploy an open model, since the negotiating position changes the moment the alternative becomes credible.
It changes what you can responsibly commit to, as well. Until now, a multi-year AI investment has meant betting the program on one supplier’s pricing decisions and deprecation schedule, and that’s a hard paper to take into an investment committee. Commitments get easier when the input underneath them has a substitute. Workloads governed by data residency rules come back into scope too, and for some companies that means markets they’d written off.
Investors’ point of view is a little different in this scenario, and probably more accurate. Valuations built on sustained pricing power at the model layer assume something the capability data no longer supports. As models converge, the primary durable margin moves toward distribution, proprietary data and internal workflows that the customers cannot rip out. This happens to be the ground that the coalition’s founding signatories already hold.
None of that requires a single enterprise to switch models. So, the case against restrictions is a real one, whatever mix of principle and self-interest sits behind it. And note one of its own asks: public funding for shared evaluation frameworks, which the signatories evidently agree don’t exist yet.
The monopoly is breaking, just not on the scoreboard everyone watches
Stanford’s 2026 AI Index puts the leading closed model ahead of the leading open model by 3.3% as of March 2026, having been 0.5% ahead in August 2024 (Stanford HAI). The same chapter records six labs clustered inside 25 Arena Elo points at the top and reads that convergence as pushing competition toward cost and reliability. For most enterprise work, a 3.3% capability gap is not a reason to pay a multiple.
Market share tells a different story. Menlo Ventures, surveying 495 US enterprise AI decision-makers, puts three vendors at 88% of the enterprise LLM API market between them, on 40%, 27% and 21% (Menlo Ventures). The same research found enterprises tend to stay with whichever vendor they picked, upgrading within that provider even where switching costs are low.
Both are true and reconciling them is the point. Suppliers price differently when they know you can leave, and that holds whether or not you ever. The alternative never has to be used to change what you pay. So, the pricing monopoly is gone while market share sits exactly where it was. Pricing power was the monopoly that mattered to buyers, and open weights broke it.
The headline price is not the cost
This part is arithmetic. On published rates one recent open model looks roughly a third the price of a leading commercial system. Cost per completed task tells a different story, and the firm that measures it states the mechanism plainly: because cost tracks real token usage, models producing longer answers or more reasoning bill more per task even at identical per-token prices (Artificial Analysis). One current frontier model cost about twice its predecessor per task on that measure, driven entirely by token consumption and not by any price change.
It’s not possible to move a production workload to a budget-friendly mode without having a per-tasking definition of good enough, and literally no one has that handy. Ask what accuracy a workflow requires and you’ll hear crickets, or a number invented on the spot. Ask what it currently achieves and you’ll get the same silence. Same shrug, different meetings. Until both questions have answers, a pricing table is just somebody else’s workload dressed up as your business case.
I work on AI infrastructure, and the primary hurdle that I keep hitting isn’t a technical one. Writing down what good enough means requires somebody to put their name on a number they’ll be held to later. That’s an organizational decision, and not an engineering one, which is exactly why these documents don’t exist in most companies. Teams spend multiple quarters comparing models but barely spend a week agreeing what exactly they’re comparing them for. The related thing I’d say from that seat is that most groups believe they evaluated a model when what they did was try it. Someone ran twenty prompts, liked what came back, and the decision got made in the room. That’s a demo. Demos flatter every model about equally, which is why they can’t tell you whether the cheap one is costing you anything.
Self-hosting won’t rescue the math for most buyers either. A frontier-scale checkpoint runs well past a terabyte, so outside the regulated cases above, the win shows up as hosted providers competing for your workload.
What will actually move your bill
Two things will, and neither of them is a model release. First is the eval infrastructure, since it turns any price difference into a decision that you can defend. Scrape a few hundred real queries from the peak-load and freeze them as your golden test set. Get the people who own the business outcome to write down what a good response looks like, in specifics instead of adjectives. Test the existing model first and generate the scores. Most teams underestimate this step, and it’s the one that makes every future comparison possible.
The second is your own compliance position, which the August decision did nothing to simplify. Every proposal in circulation points at documentation and audit trails, and the holdout lab’s own position points the same direction from the opposite side of the debate. What reaches the buyer either way is a demand for evidence about what your systems can do and what they did. Most 2027 budgets don’t carry that line.
And on the stock market question
Expect volatility on release days and don’t mistake it for repricing. A capable open model lands and chip stocks sell off within hours, one such session costing a single chipmaker close to $600 billion (CNBC). They recover over the following weeks.
My read is that markets keep filing these as demand shocks when they are supply-side price events. Cheaper capability has driven adoption and compute consumption up together every time, which is the opposite of what a selloff assumes. So, keep the two conversations apart. A chip selloff tells you about supplier margins and nothing about your own AI spend, and boards that conflate them freeze budgets during a dip or wave them through during a rally. What would genuinely reprice this sector is a regulatory outcome raising the cost of shipping capability, or an adoption curve that flattens.
Uber’s experience highlights a new enterprise AI challenge: adoption can scale faster than an organization’s ability to measure economic value. As companies move from AI pilots to widespread deployment, the question is no longer whether employees will use AI — it is whether every AI investment can justify its cost.
Generative AI is changing the economics of enterprise technology. Every inference request, AI agent execution and model interaction can create recurring costs, while cloud infrastructure, GPUs, data, security, integration and governance add to the total cost of delivering AI. The economics that made an AI pilot look compelling can look very different at enterprise scale.
The next phase of enterprise AI will not be defined by the number of models deployed or pilots launched. It will be defined by sustainable business value. For CIOs, CFOs and business leaders, success depends on maximizing business outcomes while controlling the cost of delivering AI.
AI success is an economics problem, not just a technology problem.
AI unit economics: The new measure of AI success
Manufacturers measure cost per unit produced. Banks track cost per transaction. Enterprise AI requires a similar discipline — not measuring how many models are deployed, but how much business value is generated for every dollar invested.
Traditional software investments typically involve predictable costs. AI introduces a dynamic cost structure where every interaction creates ongoing expenses, including compute, inference, storage, data retrieval, monitoring, integration and governance.
A simple framework for evaluating AI investments is:
AI unit economics = (business impact × adoption × reusability) ÷ total cost of delivering AI
Consider an illustrative AI-enabled invoice-processing workflow. If AI reduces processing time, increases straight-through processing and the same capability can be reused across accounts payable, procurement and supplier onboarding, its economics improve not simply because the model is cheaper — but because the value and reuse increase faster than the cost.
This equation reflects a simple principle: AI investments create the most value when they solve high-impact problems, achieve broad adoption and create reusable capabilities while keeping operating costs under control.
Business value may include productivity improvements, faster decisions, improved customer experiences, revenue growth, cost reduction or reduced operational risk.
The objective is not to minimize AI spending. It is to maximize the value generated from every AI dollar.
Understanding the cost drivers and metrics that matter
AI unit economics depends on understanding both consumption drivers and business value drivers. Infrastructure, GPU compute, inference usage, data management, security, compliance and governance all contribute to AI costs.
CIOs should move beyond tracking total AI spend and monitor metrics such as cost per inference, token consumption, GPU utilization, model usage, latency, adoption rates, productivity improvements, automation levels and business impact.
CIOs should treat AI consumption as a portfolio allocation problem — not simply an infrastructure problem.
The winners will not be the organizations that deploy the most AI. They will be the organizations that know where every AI dollar creates measurable business value.
Optimizing AI unit economics: Practical strategies for CIOs
Improving AI unit economics requires more than reducing costs. It demands thoughtful architectural and operational decisions that maximize business value while minimizing unnecessary AI expenditure. The following strategies can help CIOs achieve that balance.
1. Use the right technology for the right problem
Not every business problem requires a large language model. Many structured prediction challenges — such as demand forecasting, fraud detection, predictive maintenance, churn prediction and pricing optimization — are often better solved using traditional predictive machine learning models.
These models typically require fewer computational resources and can deliver comparable or superior performance for well-defined prediction problems.
Large language models create the greatest value for language-intensive tasks such as enterprise search, document analysis, conversational assistants, software development and content generation.
The right question is not, “Where can we use generative AI?” It is, “What is the simplest technology capable of delivering the required business outcome?”
2. Manage AI as a portfolio, not a collection of projects
Many enterprises still evaluate AI initiatives individually. Leading organizations manage AI as a strategic portfolio.
Every AI investment should have clear business objectives, success metrics, ownership and exit criteria. Experiments should either demonstrate measurable value and scale or be discontinued.
A portfolio approach helps eliminate duplicate investments, increase reuse of AI capabilities and shift funding toward initiatives with the strongest business impact.
3. Optimize AI architecture and model selection
AI infrastructure decisions are now financial decisions. Unlike traditional applications, AI workloads create continuous demand for compute resources, making inference costs a major operational expense as adoption grows.
Organizations are increasingly adopting hybrid AI architectures that combine public cloud flexibility with private infrastructure for high-volume, sensitive or regulated workloads. This approach can improve resource utilization, reduce data movement costs, strengthen data sovereignty and create more predictable operating expenses.
However, infrastructure optimization alone is not enough. Enterprises must also ensure that each workload runs on the right model. Not every interaction requires the most advanced — and most expensive — foundation model.
CIOs should adopt intelligent model routing strategies that match workloads with the right models based on complexity, performance and cost. Smaller language models, open-source models and domain-specific models can handle routine tasks such as classification, extraction and summarization at significantly lower cost.
Premium foundation models should be reserved for complex reasoning, advanced analysis and high-value decision support where their additional capabilities justify the expense.
The goal is not to maximize model size or infrastructure investment — it is to optimize AI consumption for measurable business outcomes.
4. Redesign business processes — Don’t just add AI
Adding AI to inefficient processes rarely creates transformational value. The biggest improvements come from redesigning workflows around AI capabilities.
For example:
Traditional workflow: Employee → AI Assistant → Invoice
AI-enabled workflow: Invoice → AI Agent → Human Exception Review
In this model, AI handles routine tasks while employees focus on complex decisions.
Providing employees with AI licenses does not automatically create productivity gains. Without clear use cases, adoption strategies and outcome measurement, organizations can increase AI spending without achieving proportional business value.
Leading enterprises focus on value realization by measuring outcomes such as hours saved, productivity improvements, automation rates, customer experience improvements, revenue impact and cost reductions.
However, productivity measurement alone is insufficient. Sustainable AI economics also depends on the foundations that make AI reliable, scalable and trusted. High-quality data and strong governance act as value multipliers by reducing errors, improving adoption and enabling responsible scaling.
Weak foundations can quickly erode AI economics. Poor data increases operational costs by creating inaccurate outputs, more human review, lower employee trust and repeated model execution.
Similarly, governance should not be viewed only as a compliance requirement. As IT leaders navigate the operational costs and requirements of AI governance, strong responsible AI practices — including security controls, explainability, regulatory oversight and human oversight — reduce operational risk while increasing confidence in AI-driven decisions.
Clean data improves model performance, while effective governance ensures AI systems are reliable, secure and scalable. Together, they improve AI unit economics by reducing waste, increasing adoption and maximizing the business value generated from every AI investment.
Measuring AI economics is only useful if organizations build the operating discipline to manage it continuously.
6. AI FinOps: Operationalizing AI unit economics
Cloud computing created FinOps to bring financial accountability to infrastructure consumption. As explored in CIO.com’s breakdown of FinOps expanding beyond traditional cloud costs, managing variable enterprise technology costs requires unified collaboration between engineering, finance and business leaders. AI requires the same discipline, but with a more direct connection between technical consumption, financial accountability and measurable business outcomes.
The key is connecting technical consumption metrics with financial and business outcomes:
Consumption Metrics
Business Impact Metrics
Inference cost per transaction
Revenue impact
Token consumption
Productivity improvement
GPU utilization
Hours saved
Model utilization
Automation rate & cost savings achieved
AI spending should become as transparent, measurable and accountable as any other strategic operating expense.
Financial discipline is no longer optional; it is essential for scaling AI responsibly.
From AI adoption to AI advantage
The organizations that lead the next phase of enterprise AI won’t necessarily deploy the largest models or spend the biggest budgets. They will make better AI investment decisions.
They will choose the right technology instead of the newest technology. They will redesign business processes instead of simply automating existing ones. They will build reusable enterprise capabilities rather than isolated pilots.
Most importantly, they will manage AI as an economic asset — not merely a technological one.
The future of enterprise AI belongs to organizations that maximize AI unit economics: scaling adoption, reusing capabilities across functions and maintaining disciplined control over infrastructure, inference, operations and governance costs while delivering measurable outcomes.
The future winners will not be those who deploy AI everywhere. They will be those who know where AI creates economic leverage — and where it does not.
Achieving return on investment is impossible without knowing the total cost of ownership (TCO) of an initiative — and when it comes to AI, CIOs are finding cost calculations anything but straightforward.
Subscription and token costs are a big part of the calculus, but several other factors go into the cost of AI projects, says Ben Schein, chief AI and analytics officer at AI data platform provider Domo. Chief among those are cloud infrastructure costs and the human time involved in guiding or correcting AI outputs, he notes.
In addition, many organizations have multiple divisions using different AI tools for vastly different purposes.
“There’s not like a single ledger,” Schein says. “Right now, and maybe for the foreseeable future, there’s sort of like a multiple ledger approach to how all this works.”
A shifting paradigm
While token costs have dropped significantly in the past two years, costs vary wildly between models and AI providers, and the price drops are often offset by increased usage. And AI providers have also explored other kinds of consumption-based pricing, including API calls, compute time, or documents processed.
All this makes it difficult to measure TCO, Schein says.
“You have sort of these subscriptions, you have the consumption and the tokenization, you have some of the infrastructure you might be paying for,” he says. “There’s also a human tax that introduces new time for verification and review, and if the AI is sloppy or creating slop, you might be inadvertently adding to your costs without knowing it.”
It’s difficult to measure TCO because AI doesn’t have a single cost center, agrees Shane Cronin, head of FinOps and ITAM services at systems integrator SHI.
“By the time you’re looking at the bill, you’re dealing with token consumption, cloud infrastructure, multiple AI models, governance tooling, integration work and, increasingly, autonomous agents making decisions across systems,” he says.
IT leaders at many organizations still define AI success through narrow technical metrics instead of prioritizing business outcomes, Cronin adds.
“Calculating token costs is relatively straightforward,” he adds. “Calculating whether those tokens actually created measurable business value is much harder. That’s where most CIOs are today.”
Unpredictability and hidden costs
Michael Moran, chief technology and information officer at contact center outsourcing provider NQX, sees several other factors leading to further unpredictability over AI costs.
For example, data center costs are rising, AI vendors are starting to shift from subsidized pricing to profitability, and organizations have increasingly complex AI use cases, he says.
“IT leaders should temper expectations that AI inherently reduces costs,” he adds. “Instead, it’s important to understand that full automation is likely to be prohibitively expensive for most enterprises, and that brands will need to balance AI investment with human engagement strategies that improve long-term value rather than cut costs in the short term.”
If AI implementations work exactly as expected right out of the grate, TCO should be relatively easy to calculate, he says. But agentic AI implementations often require much more human training and intervention than expected.
“These are the hidden costs that are often underestimated or ignored altogether when initially calculating TCO,” Moran adds.
Visibility is the first step
Chris Cagnazzi, chief innovation officer at IT solutions provider Presidio, is one IT leaders seeking to get a handle on the complexity of calculating AI TCO by applying playbooks from the cloud migration era.
Cagnazzi has adapted Presidio’s cloud cost optimization platform, PRISM, to track AI costs internally and to help customers do the same.
The first step toward tracking AI costs is visibility, he says. IT leaders should know every model running across their organizations, the cost per user per month, and what kinds of prompts each user is writing, he explains, adding that Presidio is using real telemetry to track internal AI use, as well as internal tools to direct prompts to cost-efficient AI models.
The second, more difficult, step is turning visibility into action, he adds. “You have to think about mapping the usage back to the owners, whether it’s users or groups,” he says. “Then you look at, what are some of the anomalies? And if you’re looking at those anomalies, do you have governance in place around overspend?”
What Presidio has found is that the bill for AI services represents only about 30% of the total cost, Cagnazzi notes.
“The other costs really lie in areas around the hidden AI stack,” he says. “Those things around orchestration or retrieval, observability of the guardrails, or the rereads and the redos. There’s a lot of cost that people are missing.”
While traditional IT costs can be fairly predictable, AI costs are driven by usage and can increase because employees are repeatedly using inefficient prompts, Cagnazzi says.
“The spend is hard to forecast; it’s hard to see the true hidden costs behind the bill,” he adds. “If that prompt is less efficient, it might produce a bill that’s 100% higher than what it should be.”
The good news, says Domo’s Schein, is that IT leaders have a lot of variables to play with to control AI spending. They can encourage users to use more cost-efficient AI models, they can track employee usage of AI, and they can test different prompts and other interactions for cost effectiveness, he says.
“The price spread on the different models is crazy,” he says. “You could say, ‘I have no ROI on this investment; if I could get the same outcome with a model that costs one-30th as much, I may have ROI.’”
There is a question that quietly embarrasses more automation projects than any technical failure: How much did it actually save? Ask it a year after launch and watch what happens.
The team is confident the new system is better. Everyone remembers how tedious the old way was. And yet nobody can produce a number, because nobody measured the old way before replacing it. The improvement is probably real, but it remains an article of faith rather than a demonstrated result.
I’ve spent much of my career automating workflows within large organizations — whether contributing to intelligent assistance features in Microsoft Office, architecting AI expert systems such as the Intelligent Filing Manager (INTELLIFM) across client-server and web platforms, or engineering financial automation such as the Bloomberg Valuation Service (BVAL) for the finance industry. Across every domain, I learned early that the measurement question isn’t a formality that follows the engineering. It comes first.
Automation only pays off if you can prove it did, and proof begins before a single line of code is written.
Manual work hides its costs well
The case for measuring first starts with an inconvenient property of manual workflows: their true costs are almost invisible from above. A process that “takes about a day” rarely takes a day of active labor. It usually consumes three hours of actual effort (touch time), spread across a week of organizational latency (elapsed time) — waiting for approvals, waiting for handoffs or waiting for someone to notice an item sitting in their queue. The costs that matter most are precisely the ones no one tracks: rework when a document comes back with errors, delay while a request sits between steps, and inconsistency when five people perform the same task in five different ways — with each believing theirs is the standard.
Baselining exposes all of this, which is why it so often surprises the people who commissioned it. When you map a process end to end and attach numbers to it — elapsed time, touch time, error rates, variance between performers — you routinely discover that the workflow everyone thought they understood behaves quite differently in reality. That discovery has independent value: more than once, careful baselining has revealed steps that shouldn’t be automated but eliminated.
There’s no point perfecting a task that shouldn’t exist. To capture an accurate baseline, examine historical audit trails, system logs and ticket completion timestamps rather than relying solely on self-reported estimates, which are vulnerable to recall bias. When direct observation is necessary, account for the Hawthorne effect, in which people may behave differently because they know they are being observed.
The honest method: Baseline, then measure
The honest way to judge automation is embarrassingly simple to state: establish a quantified baseline first, then measure against it after. What makes it rare isn’t difficulty but timing. Once the new system ships, the old process may disappear or change substantially, making its true cost difficult to reconstruct. The cleanest opportunity to establish a baseline often closes at launch. Miss it, and every efficiency claim afterward becomes harder to defend.
This matters beyond intellectual honesty. Automation initiatives compete for budget against everything else the organization could do, and the initiatives that can say, “cycle time fell 40 percent against a measured baseline” win those arguments over the ones that say, “everyone agrees it’s much better.”
A measured result also protects the project when leadership changes or budgets tighten — sentiment is easy to dismiss; a baseline comparison isn’t. And there’s a subtler benefit: defining the measures up front forces the team to agree on what the automation is intended to do. A surprising number of projects discover in the middle of the metrics argument that stakeholders were pursuing different goals under the same project name. Better to have that argument before the build than after.
The measures themselves should be few and meaningful. Elapsed time from request to completion. Active effort consumed. Error and rework rates. Consistency across performers and cases. Resist the temptation of “dashboard theater” and the burden of 30 metrics. A small set tracked honestly over time beats a massive spreadsheet tracked sporadically, and every vanity metric you add creates collection fatigue after the initial excitement fades.
Agentic automation requires an additional layer of measurement. An agent may merely advise, act with human approval or act autonomously. For agents permitted to act, you must measure the health of that autonomy. Gartner recommends governance proportional to an agent’s autonomy and access because controls that are too restrictive or too permissive create different operational risks.
A practical scorecard should track three indicators: the Autonomous Completion Rate, which measures eligible work completed correctly without human intervention; the Escalation Rate, which measures cases handed off to a person; and the Reversal Rate, which measures actions a human had to undo or correct. A high reversal rate is particularly damaging because it creates additional work. The agent performs the step incorrectly, and a human must then diagnose and repair its output. An agent whose actions are routinely reversed has not earned its autonomy. Only rigorous tracking will reveal this.
Gains erode unless someone sustains them
Here’s the part the launch celebration never mentions: automation gains decay. This does not necessarily happen because the software itself degrades, but because the operating environment changes. The process resembles system entropy in software: exceptions, edge cases and manual workarounds accumulate until the workflow drifts away from its intended design. As this happens, users quietly revert to old habits or bypass automated steps. Volumes shift, and a year later the workflow is partly automated and partly folklore — the gains, never remeasured, have silently surrendered some of the value they once created.
Agentic systems also raise the stakes of this decay. When software merely suggests, a person sees every output and complaints surface early. However, when software acts, fewer eyes fall on each action, and erosion loses its last natural alarm.
The defense against backsliding is twofold. First, standardization turns the improved process from a local achievement into the documented and expected way of working. As a result, the gain does not depend on the memory of the people who happened to be there at launch. Second, continuous improvement, supported by scheduled remeasurement, treats efficiency as an ongoing practice rather than a one-time milestone.
The organizations that sustain their gains schedule follow-up reviews before the project closes. They recognize that once the project team disbands, attention goes only where the calendar sends it.
Preventing this silent value erosion requires moving from a reactive mindset to a structured operational model. As McKinsey’s research on skills in the AI age observes, realizing AI’s economic potential depends less on new inventions than on how organizations redesign workflows and how quickly skills adapt.
Quantifying automation the right Way
Four disciplines, applied in order, make the difference.
Map the current process and capture a baseline before you change anything. Walk the workflow end to end as it actually happens, not as the procedure manual describes it. Record elapsed time, touch time, handoffs, error rates and variance. Expect surprises; they’re the point. The baseline is the one measurement you can never take later.
Pick a small number of meaningful measures and track them consistently over time. Choose measures that reflect what the automation is for — speed, quality, consistency, cost — and hold them stable so trends stay comparable. Consistency over months beats sophistication in month one. If a measure requires heroic effort to collect, it will stop being collected; design for sustainability, not impressiveness.
Standardize the improved process so the gains don’t quietly slip back. Document the new workflow, train to it and make it the path of least resistance. Fold exceptions into the standard deliberately instead of letting workarounds breed in the shadows. A gain that lives only in the launch team’s habits leaves when the team does.
Revisit the numbers on a schedule. Put remeasurement on the calendar — quarterly is a reasonable default — and treat erosion as a signal, not a failure. Sustaining efficiency takes attention, not just at launch. A review that detects a 10 percent decline this quarter can prompt timely corrective action. That is far less costly than discovering two years later that a once-celebrated automation has gradually become yet another tedious process.
None of this diminishes the engineering. It completes it. The organizations that measure before they automate know what their improvements are worth, can defend them when budgets tighten, and catch the erosion while it is still cheap to reverse. The ones that skip the baseline have something weaker than a result. They have a story, and stories, unlike baselines, cannot be audited.
Under that pressure, CIOs started to feel the heat, with 71% of IT leaders in February saying they believed they had until midyear to prove AI value or face budget or job fallout, according to a survey published by AI platform provider Dataiku. For many, experience may have informed that anxiety, as three-quarters of CIOs surveyed then also said they had remorse over at least one major AI vendor or platform selection made in the past 18 months..
Six months later, and passed that midyear mark, CIOs who have set their course for AI ROI are finding that destination remains elusive. Still, there hasn’t been a spate of CIO firings, and AI spending continues to grow. About 71% of organizations plan to increase AI spending this year, but only 27% expect near-term ROI, according to recent research by IT solutions provider TEKsystems.
That metric aligns with findings from CIO.com’s State of the CIO survey from earlier this year, when 40% of IT leaders said some AI initiatives (between 30% and 70%) were meeting ROI goals. While progress remains the same, the drumbeat to prove value goes on.
“CIOs are feeling pressure to demonstrate that AI is delivering measurable business value, not just experimentation,” says Jed Dougherty, SVP of AI and platform at Dataiku. That’s because, while CIOs’ worst fears haven’t been realized, organizations are putting greater scrutiny on AI investments, he adds.
“The CIOs who are succeeding aren’t deploying AI everywhere,” he says. “They’re building the governance, data, and operational foundation that lets the business scale AI responsibly and demonstrate real outcomes.”
A pronounced focus on AI spending and costs
Bob Hutchins, CEO at AI advisory firm Human Voice Media, believes CIOs’ early year anxiety wasn’t likely based on any formal deadlines.
And if any CIOs have been fired since February because they missed AI targets, those changes are likely hidden from public scrutiny either in reorganization efforts or other leadership changes, he says.
“Midyear came and went and there was no apparent bloodletting,” he adds. “I haven’t seen credible evidence of mass firings of CIOs due solely to missing return on investment targets for artificial intelligence.”
But organizations do seem more focused on spending their AI budgets wisely, Hutchins notes. Nearly half of all organizations surveyed recently by KPMG have delayed, stopped, or scaled back AI projects due to budgetary constraints, he says.
“Companies are stopping poorly performing projects, scaling back pilot programs, decreasing the number of vendors they use, creating cheaper models of products and services, and giving more control over AI approval to the financial department,” he adds.
Ryan Ries, chief AI and data scientist at AI and cloud consulting firm Mission Cloud, also sees IT leaders still under pressure to improve AI results.
While firing a CIO midyear looks bad on an earnings call, IT leaders now face budget triage efforts related to AI, he says.
“Money still flows to projects with a hard number attached,” he adds. “Pilots without one get quietly starved but not killed outright. The AI landscape is constantly changing, and companies are trying to figure out all the new tools like coworking and coding solutions.”
Cost control is also receiving greater emphasis as some early agentic forays have shown how an AI agent can cost more than an employee without limits in place.
CIOs still on the hot seat
CIOs are also finding that it is taking their organizations more time to figure out how to use AI tools to their full advantage, and that they are constantly reacting to errors, Ries notes.
As a result, IT leaders appear to be putting in more effort to find AI value than they were earlier this year, he says. “Fewer are succeeding than leadership wants to admit,” he adds.
While most organizations were experimenting with the so-called “art of the possible,” IT leaders seeing success are focused on attaching a metric to every AI project before launch, not after, he says.
Many IT leaders still aren’t taking that approach, however. “The CIOs still stuck are the ones running pilots that never graduate to production, usually because nobody can explain what the model is doing under the hood, and teams are trying to answer the wrong questions with AI,” he says.
It’s possible that CIOs have gotten a reprieve due to the ongoing complexity of the AI ROI mandate, Ries adds.
“Boards don’t fire on a spreadsheet’s calendar, but the underlying pressure was real, and it hasn’t eased,” he says. “Instead of a hard cutoff, CIOs now face constant reporting. Monthly board briefings on AI performance are becoming standard, not optional.”
CIOs should remain on their toes and focus on driving AI value, Ries says. “The fear of a July guillotine was overstated,” he adds. “The fear of ongoing, permanent scrutiny was not, if anything it has increased, due to how quickly cost overruns can happen.”
Budget pressure is real
Like other observers, Mridul Nagpal, CTO and co-founder of AI software development company Krazimo, sees a growing focus on AI budgets and untargeted spending.
“The pressure is real, but it’s reshaping spend more than cutting it,” he says. “What’s actually at risk is the undifferentiated AI budget — the ‘we’re doing AI’ line item with no outcome attached.”
Many CIOs are now starting to show AI value, but by narrowing their approaches, not expanding them, he adds.
“CIOs who funded broad experimentation are the ones sweating; CIOs who tied spend to a specific, measured workflow are defending, and often growing, their budgets,” he says. “The fallout is landing on unaccountable AI spend, not AI spend per se.”
The CIOs showing returns have quietly killed sprawling AI pilot portfolios and doubled down on a handful of use cases that reached production, Nagpal adds.
Like Ries, Nagpal believes that earlier CIO fears were a bit overblown and, at the same time, they’ve gotten more time to prove AI value.
“Boards softened the ‘or else’ because the whole market discovered the pilot-to-production gap is real and hard, so the deadline quietly moved,” he says. “But the underlying expectation didn’t disappear — it matured from ‘show me AI’ to ‘show me AI that pays for itself.’”
The loudest conversation in business right now is about how much value AI actually generates. Over the last year, AI has moved from a side experiment to a strategic priority. It has its own budget line, its own place on the board’s agenda and its own pressure to show results. Every leader is asking a version of the same question: What are we getting back?
To answer it, most reach for the three measures they have always trusted to judge a technology:
How much faster are we now?
How much money has it saved us?
How many of our people are using it?
Speed, cost and adoption were the right yardsticks for every major technology of the past two decades. They worked because the capability of traditional software was fixed and known on the day you deployed it. The tool did a defined job. Its value had a ceiling you could see, and each metric measured your progress toward that ceiling. Cost reduction told you how much you could save. Adoption told you how much of the capability you had rolled out. Speed told you how much of the promised acceleration was reaching the output.
In every case, the tool was a constant, and the metric measured how fully the organization had absorbed that constant.
These metrics are not working for AI. The reason starts with how AI entered our organizations.
Every technology before this was chosen somewhere above us, deployed to us and trained into us. By the time it arrived on our desks, someone had already decided what it was for. AI came the other way. It landed as a personal productivity tool. You opened a tab, typed a question and something useful came back. Nobody defined its capability in advance, because its capability is not fixed. What it produces depends on who is using it and how well. Metrics built for fixed capabilities have nothing stable to measure, and here is what happens when you apply them anyway.
Why speed, cost and adoption fail as AI evaluation metrics
Let’s start with speed. Task speed and business speed are different quantities, and AI only touches the former. Suppose a report that took eight hours now takes two. Your dashboard shows a 75% improvement. But the report still waits three days for review and a week for approval before anyone acts on it. The organization sees dramatic task-level gains but no movement in business results and concludes AI failed. The problem is the metric measuring a layer that was never the bottleneck.
Speed creates a second problem, and it is worse. Getting good output from AI requires checking it, correcting it and feeding those corrections back into how the tool is used. That work is slow. On any speed metric, it looks like inefficiency. So, people under speed pressure skip it. They accept output uncritically and produce more volume with less scrutiny.
Cost reduction has an arithmetic problem. If you frame AI as a way to reduce what you currently spend, your maximum possible win is your current spend. If your content team costs a million dollars, the best case in a cost frame is saving a million dollars. Every general-purpose technology has followed the same sequence: Efficiency gains came first, and the larger value came later, from work that did not exist before.
For AI, that means the analysis nobody had time for, the personalization no team could staff, the experiments too expensive to justify. A cost frame makes all of that invisible because new work doesn’t reduce anything. There is no column on the dashboard for things you couldn’t do last year.
Cost framing also works against its own inputs. AI improves through use by knowledgeable people. It needs their corrections, their context and their judgment about what good output looks like. When AI’s success is measured in headcount avoided, those people understand exactly what they are being asked to build: Their own replacement. They respond rationally. They use the tools shallowly and keep their expertise to themselves. The metric announces an intent, and the intent destroys the participation the technology depends on.
Adoption looks like the safest of the three. The problem is that adoption measures usage, and usage is not a value.Researchers at several central banks recently asked thousands of senior executives about this and heard the same two things from most of them: Yes, we use AI across the business, and no, it has not changed our results yet.
A thousand employees asking AI to shorten their emails will produce a spectacular adoption number and almost nothing else. Fifty employees using AI on judgment-heavy work, feeding it real context and checking its output against real standards, will barely register on the dashboard and generate most of the actual return. Adoption metrics cannot tell these two groups apart. Worse, they reward the shallow pattern. Shallow use is easy to spread, and deep use is hard, so an organization managed on adoption drifts toward the use that is easiest to count.
6 signals that track the real value
A few months ago, I realized the ROI question was aimed at the wrong object. Every company I compete with has access to the same models I do, at the same price. Whatever value comes from the model itself, my competitors receive too, so it cancels out any comparison between us. It cannot be an advantage, and it is not an interesting thing to measure. The only variable left is us. The standards, the context and the judgment we build around the model, because none of that arrives with the subscription and none of it can be bought. So, when I evaluate AI, I am evaluating my own organization and how quickly it turns a commodity everyone has into a capability only we have. The six signals below all measure that second thing.
1. Review burden is falling on the same class of work
Take any recurring task the organization runs through AI: Monthly reports, vendor evaluations, code review. Track how much human checking each unit of output needs, quarter over quarter. If a task needed a full senior review in January and needed a spot check in June, something real happened. The organization encoded its quality standards, improved its inputs and learned where the tool fails. If the review burden is flat, the organization is consuming AI, not compounding on it, no matter what the adoption dashboard says.
How to measure it: Pick five recurring workflows, log review hours per output and plot the trend. The trend is the signal. The absolute number matters far less.
2. Corrections become shared fixes
When someone discovers that the AI gets something wrong, how long does it take for that discovery to become a shared fix? In a healthy system, one person’s correction becomes an updated prompt, a revised guideline or a documented example of good versus bad within days. Nobody else has to rediscover the same failure. In an unhealthy system, every employee privately learns the same lessons. The knowledge lives in individual chat histories, and it leaves with each departure.
How to measure it: Sample recent corrections and trace them. Did they land anywhere reusable? How long did it take? An organization that cannot answer these questions at all has its answer.
3. The team does work that it could not do before
The largest returns from any general-purpose technology come from previously impossible work, not from old work done faster. So, look at the work itself. Is the organization doing the same portfolio of tasks faster, or is the portfolio expanding?
How to measure it: Once a year, list what the team produces now that it did not and could not produce before. If the list is empty after a year of heavy AI use, the organization has been optimizing instead of expanding, and it is capturing the smallest slice of the available value.
4. The delegation boundary is moving
Every organization has an implicit line: Work AI does alone, work AI does with human review, work humans do entirely. Watch whether that line moves. Work that needed full human ownership last year and needs only oversight now is direct evidence of accumulated capability, clearer standards and earned trust. A frozen boundary means frozen capability.
How to measure it: Make the implicit map explicit. Build a simple inventory of task types and their current delegation level, then re-score it quarterly. The change is the signal. It is also one of the few AI metrics a board can grasp intuitively: This category moved from full review to spot check, and here is what we built to make that safe.
5. Cost per verified outcome is falling
What does it cost, all in, to produce a unit of work you would actually ship: checked, corrected, done? All in means the subscription, the prompting time, the review time and the rework when errors slip through.
This number does two jobs. It exposes the true economics, which usually look worse than the dashboard claims early on, because the human labor around the tool costs more than the tool itself. And it gives you the one number that should fall over time if capability is genuinely accumulating, because encoded standards and better context reduce exactly those human hours.
How to measure it: Instrument one workflow end-to-end, honestly, before generalizing. Most organizations have never done this once.
6. Use is getting deeper, not just wider
Adoption metrics count users. This signal counts the nature of use. Shallow use, such as rewriting emails and summarizing documents, spreads fast and produces little. Deep use, where AI is applied to judgment-heavy work with real context and real evaluation, spreads slowly and produces most of the return.
How to measure it: Classify actual usage into shallow and deep, even roughly, and track the ratio. Fifty deep users beat a thousand shallow ones, and only this signal can tell you which group you have.
Two cautions
First, any of these signals can be gamed once it becomes a target. This is Goodhart’s Law. The review burden can fall because people simply review less. So, pair every efficiency signal with a quality check, such as error rates, rework and downstream complaints.
Second, expect the early numbers to look bad. Honest instrumentation usually shows that AI currently costs more per verified outcome than the old process, because the organization is still paying its learning costs.
Final thoughts
I am not saying AI is overhyped, and I am not saying speed, cost and adoption will never matter. Every real gain eventually shows up in those numbers. I am saying they show up last because they are the output of a learning process, not the process itself. Judge AI by them today, and you will make your keep-or-kill decisions years before the evidence arrives.
If I could track only one thing, it would be the delegation boundary. It compresses everything else into a single observable fact. The boundary only moves when context has been encoded, standards have been made explicit, corrections have been institutionalized and trust has been earned through verified results. It is the output yardstick of the entire learning system. If this has not moved in a year, no other number on the dashboard means anything, however green it looks.
Measure the learning, and the returns will follow. Measure only the returns, and you may kill the learning that produces them.
Last fall, you couldn’t open a business publication without tripping over some version of the same headline: where is the ROI for AI? The anchor for most of that coverage was MIT’s “GenAI Divide” report, which found that despite $30 to 40 billion in enterprise generative AI spending, 95% of pilots delivered no measurable P&L impact. The bubble takes wrote themselves. Boards asked uncomfortable questions. More than a few AI budgets went into the freezer for the winter.
Here’s the detail that got lost in the panic: the study defined success as measurable KPI impact within six months of the pilot. Read that again. A project that transformed how a team worked but was never instrumented to prove it counted as a failure. Researchers at UC Berkeley pushed back on exactly this point, arguing that the 95% figure may represent 95% of organizations measuring the wrong things at the wrong time rather than 95% of projects failing to create value.
In other words, the AI ROI crisis of 2025 was never really about the AI. It was about measurable verification. Most enterprise AI projects didn’t fail. They were simply built in a way that made success unprovable. If you’re a CIO defending a budget line, that distinction is cold comfort, because “we can’t tell if it worked” and “it didn’t work” produce the same conversation with your CFO. But the diagnosis matters, because the treatment is completely different. You don’t fix an unprovable project with a better model. You fix it by picking a better problem.
I’ve argued before that AI initiatives should start with problems that already have good data and trusted metrics, and over the first half of 2026, the market arrived at that conclusion on its own.
The quiet correction of 2026
Watch where enterprise AI money actually went in the first half of this year and you’ll see a pattern that never made headlines: a hard pivot toward employee-facing use cases. Agents assisting support reps, sales teams, claims processors, IT help desks. The conventional read is that these are the safe choices, the training-wheels projects companies run while they work up the nerve for customer-facing AI.
That read is wrong. The pivot to employee-facing AI isn’t about safety. It’s about scoreboards.
Think about what an employee-facing workflow comes with that a greenfield AI initiative doesn’t. You already measure it. Average handle time, first-call resolution, cases closed per week, quota attainment. Those KPIs have years of baseline data behind them. More importantly, they’re politically real. In many organizations, people are bonused on those numbers. Nobody in the room disputes the methodology of a metric that’s been sitting on a comp plan for five years. When you drop an agent into that workflow and the KPIs move in the right direction across the entire employee population, ROI stops being a philosophy seminar and becomes back-of-the-envelope arithmetic. Headcount, fully loaded cost, percentage improvement, multiply.
The survey data backs up what I’ve been seeing in the field. Foundry’s 2026 AI Priorities study found that improving employee productivity is now the single biggest business objective driving AI investment, cited by 55% of IT decision-makers. This publication’s own 25th annual State of the CIO research tells the same story from the measurement side: lack of clear ROI metrics remains a critical barrier to AI success, cited by 32% of IT leaders, and among organizations that measure AI success at all, operational efficiency and process improvement (40%), employee productivity (34%) and cost reduction (30%) dominate, while revenue impact trails at 27%. And Deloitte’s State of AI in the Enterprise found two-thirds of organizations reporting productivity and efficiency gains from AI, while only 20% can point to revenue growth.
Notice what those numbers describe. The industry didn’t get better at measuring AI. It got better at picking problems that were already measured.
The post-mortem question nobody asks first
Which brings us to the diagnostic. When an AI project can’t demonstrate ROI, the instinct is to interrogate the technology. Wrong model. Wrong vendor. Insufficient context. Hallucinations. Sometimes that’s true. But the first question in the post-mortem should be about a decision that was made before a single token was generated: what problem did we pick?
Did that problem have good data behind it? And did it have a scoreboard anyone trusted before the AI showed up? If the answer to either question is no, the project was never going to prove anything, no matter how well the technology performed. You can’t demonstrate improvement against a baseline that doesn’t exist, and you can’t win an argument with a metric that was invented the same week as the pilot. The MIT study’s 95% weren’t all technology failures. A meaningful share of them were selection errors, committed months earlier in a planning meeting, by people who chose an exciting problem over a measurable one.
The bill comes due
Here’s the uncomfortable part. Just as the industry figured out the measurability trick, the goalposts started moving.
Futurum’s survey of 830 enterprise IT decision-makers in the first half of 2026 documents the shift: productivity gains fell from 23.8% to 18.0% as the primary ROI metric buyers use to justify AI investment, while hard financial measures, top-line revenue and bottom-line profitability combined, nearly doubled to 21.7%. The productivity argument carried the pilot era. CFOs accepted “the KPIs moved” as an answer for a while. Now, they want hard dollars.
This is where the next generation of AI projects will separate winners from the pack, and it requires something almost no one negotiates up front: an ROI exchange rate. That’s the pre-agreed formula, signed off by finance before deployment, that converts KPI movement into currency. One point of first-call resolution improvement equals this many dollars. One hour of engineering time recovered equals that many. It sounds bureaucratic. It’s the opposite. The exchange rate is what lets a project claim its value the moment the KPIs move, instead of spending two quarters in a methodology debate trying to reverse-engineer credit after the fact.
Without an exchange rate, even a well-instrumented project tops out at a productivity story. With one, the same project is a P&L story. Same technology, same results, entirely different conversation with the CFO.
The award was won before deployment
This month CIO celebrates the CIO 100 Awards, recognizing technology initiatives that deliver measurable business value. Study those winning projects and you’ll find plenty of impressive technology. But the thing they share isn’t a model or an architecture. It’s that “measurable” was engineered in at problem selection. The winners picked problems with real data and trusted scoreboards, and they agreed with finance on what the score was worth before they started playing.
That’s the part of innovation that never makes it on stage, and it’s the part worth copying. So, flip the question that dominated last fall. Don’t ask where the ROI for AI is. Ask whether you picked a problem that could ever answer that question, and whether anyone wrote down the exchange rate.
This article is published as part of the Foundry Expert Contributor Network. Want to join?

 Entrar