You run security at your organization. It’s 7:00 am, and you’re having breakfast. You receive a ping: a new critical vulnerability has been disclosed. Your team scrambles to compare vendor advisories, read technical research, check which systems run the affected software, and answer familiar questions from the business: are we affected, and what are we doing about it? Another disclosure arrives before that work is finished.
AI is changing both the volume and speed of critical vulnerability discovery. It can analyze large codebases at scale and surface deeply nested flaws that may have existed for years without being found through human review. That discovery momentum will put more pressure on security teams to understand the impact of each disclosure on their infrastructure.
To help security teams prepare, today we’re introducing Zero Wire: a public vulnerability intelligence feed on Cloudflare Radar, bringing the clarity of a news wire service to critical security developments. It helps security leaders and practitioners understand significant vulnerabilities and decide what to do next.
How it works
Zero Wire lives inside Cloudflare Radar under the security section.
Each briefing brings together a plain-language explanation of the vulnerability, who should investigate it, recommended actions, and links to the evidence and vendor guidance. The format is deliberately simple: an index card with what you need to know, without the drama. A CISO should be able to understand the issue quickly and ask the right questions. An engineer should be able to follow the same briefing to the technical guidance needed to investigate and remediate it.
We also offer a pre-compiled prompt you can use with your agent to assess the impact on your infrastructure. Cloudflare contributes security research, observations from our network, and practical knowledge of the controls that can help reduce exposure. The information is useful whether or not you are a Cloudflare customer.
Zero Wire brings that context together with authoritative external sources, giving readers a starting point for assessment and a place to return as an issue develops.
Our focus
Rather than a catalog of every CVE, Zero Wire complements vendor advisories and vulnerability databases, linking readers to the evidence and technical guidance needed to act. Zero Wire focuses on critical CVEs in Internet-facing software, such as vulnerabilities in web applications, the runtimes and libraries they depend on, and services exposed to the Internet, where a proxy can help mitigate exploitation.
We select significant issues that security teams need to understand and assess. Each briefing explains the potential impact, which deployments should be investigated, what is known about exploitation, and the available mitigation and patching guidance. A vulnerability’s severity and evidence of active exploitation are distinct: readers need both to make informed decisions.
A dedicated Cloudflare protection, such as Web Application Firewall (WAF) rules, is not a prerequisite for inclusion. Some issues require vendor updates or changes beyond the traffic Cloudflare can inspect. Where Cloudflare controls can help, we explain their scope and configuration requirements.
A walk through Zero Wire
Start on the Zero Wire homepage. Each card introduces an issue, identifies associated CVEs where applicable, and summarizes why it matters and what to do. You can search for a published briefing using a CVE or issue name, and follow technology tags to related entries. One briefing can cover several related CVEs when understanding them together makes the response clearer.
Find what needs attention
The homepage separates briefings into two categories. “Needs attention” brings together issues requiring active assessment or action, including those with known exploitation or developing guidance. “Reference” keeps briefings available when guidance has stabilized. Moving to “Reference” does not mean every affected system has been patched: an older vulnerability can still matter to an organization that has not completed remediation.
The status and last-checked date help you interpret each card. Known exploitation, an ongoing investigation, and an available vendor fix describe different things. Read them alongside the briefing’s evidence rather than treating them as a verdict on your own environment.
Understand what happened and who should investigate
When you open a briefing, the overview tells you what happened, why it deserves attention, and which teams should investigate. The explanation connects the technical issue to its practical consequences, such as service disruption or risk of data exposure.
For example, the recent php2shell vulnerability concerns flaws in the PHP runtime. That distinction matters for teams running applications such as WordPress or Magento: updating application code or a plugin alone does not repair the underlying runtime. The briefing helps readers identify the right system owners and directs them to the PHP security guidance for affected versions and remediation.
Turn the briefing into an action plan
What to do now gives your team a short set of next steps. Depending on the issue, that can mean identifying affected deployments, checking versions with a hosting provider, applying vendor updates, reviewing suspicious activity, or keeping compensating controls in place while patching.
The purpose is to make the next conversation concrete. For a PHP deployment, ask which runtime is actually running, whether the vendor’s fix has been applied, and who owns the update. Follow the linked vendor advisory for detailed applicability and remediation instructions, which can change as the investigation develops.
Assess your exposure with an AI agent
In this section, we share a prompt that can be used with your AI agent to quickly assess the impact on your infrastructure. The prompt asks for a read-only assessment of deployed software, relevant vendor fixes, exposure, and compensating controls, with per-asset evidence, unknowns, and next actions. It helps your team investigate its own environment; copying the prompt does not itself scan or change systems.
Check the evidence and follow what changed
To help you learn more about the vulnerability, each briefing links to external documents such as CVE records, research, and relevant exploitation evidence, including CISA’s Known Exploited Vulnerabilities Catalog. These sources answer different questions. A vendor advisory establishes affected versions and remediation guidance. An exploitation report provides evidence of attacker activity.
If applicable to a briefing, Cloudflare can add context about traffic seen on our network, for example by showing traffic matching WAF rules that indicates exploitation attempts. Those distinctions matter. Observing an attack attempt does not establish that a particular organization was compromised. Equally, a lack of observed attempts on Cloudflare’s network does not establish that exploitation is absent elsewhere. Briefings distinguish what the sources establish from what remains unknown.
Where available, charts add context to that evidence. The php2shell briefing shows the volume of HTTP requests matching Cloudflare WAF managed rules over time. Note that requests matching these rules are not a count of compromised systems or successful exploits; the chart aims at providing practitioners a sense of what the focus level is by threat actors on a particular vulnerability.
Finally, update chronology records important developments, such as new advisories or changes to the evidence and response guidance. Together with the last-checked date, it helps returning readers understand what has changed since their previous visit.
Understand Cloudflare’s role
The Cloudflare section provides links to whether we offer compensating controls or provide a way to mitigate the vulnerability impact on your infrastructure.
If a particular CVE can be addressed with a WAF rule, the briefing reports its availability and essential configuration requirements. When applicable, paid Plans and free Plans links take customers to the relevant dashboard configuration. The next step is explicit: “Review your WAF configuration to determine whether you are protected”. A link allows you to review your security posture, it does not automatically enable a rule or verify a deployment.
Note that a WAF mitigation is a compensating control for the traffic it covers, it is not a replacement for fixing vulnerable software. Blocking the requests can prevent exposed data from reaching an attacker, but it cannot undo actions already performed at the origin. The security teams should always follow the vendor remediation guidance.
Stay informed with Zero Wire
A useful vulnerability briefing should leave you with a clearer understanding of the issue and a concrete next step. Day Zero brings those essentials together: what happened, who should investigate, what to do now, and where to find the evidence.
Visit Zero Wire vulnerability intelligence, share the relevant briefings with the teams responsible for your systems, and return for new entries and updates. When the next disclosure arrives, we want you to spend less time assembling the basic facts and more time acting on them.
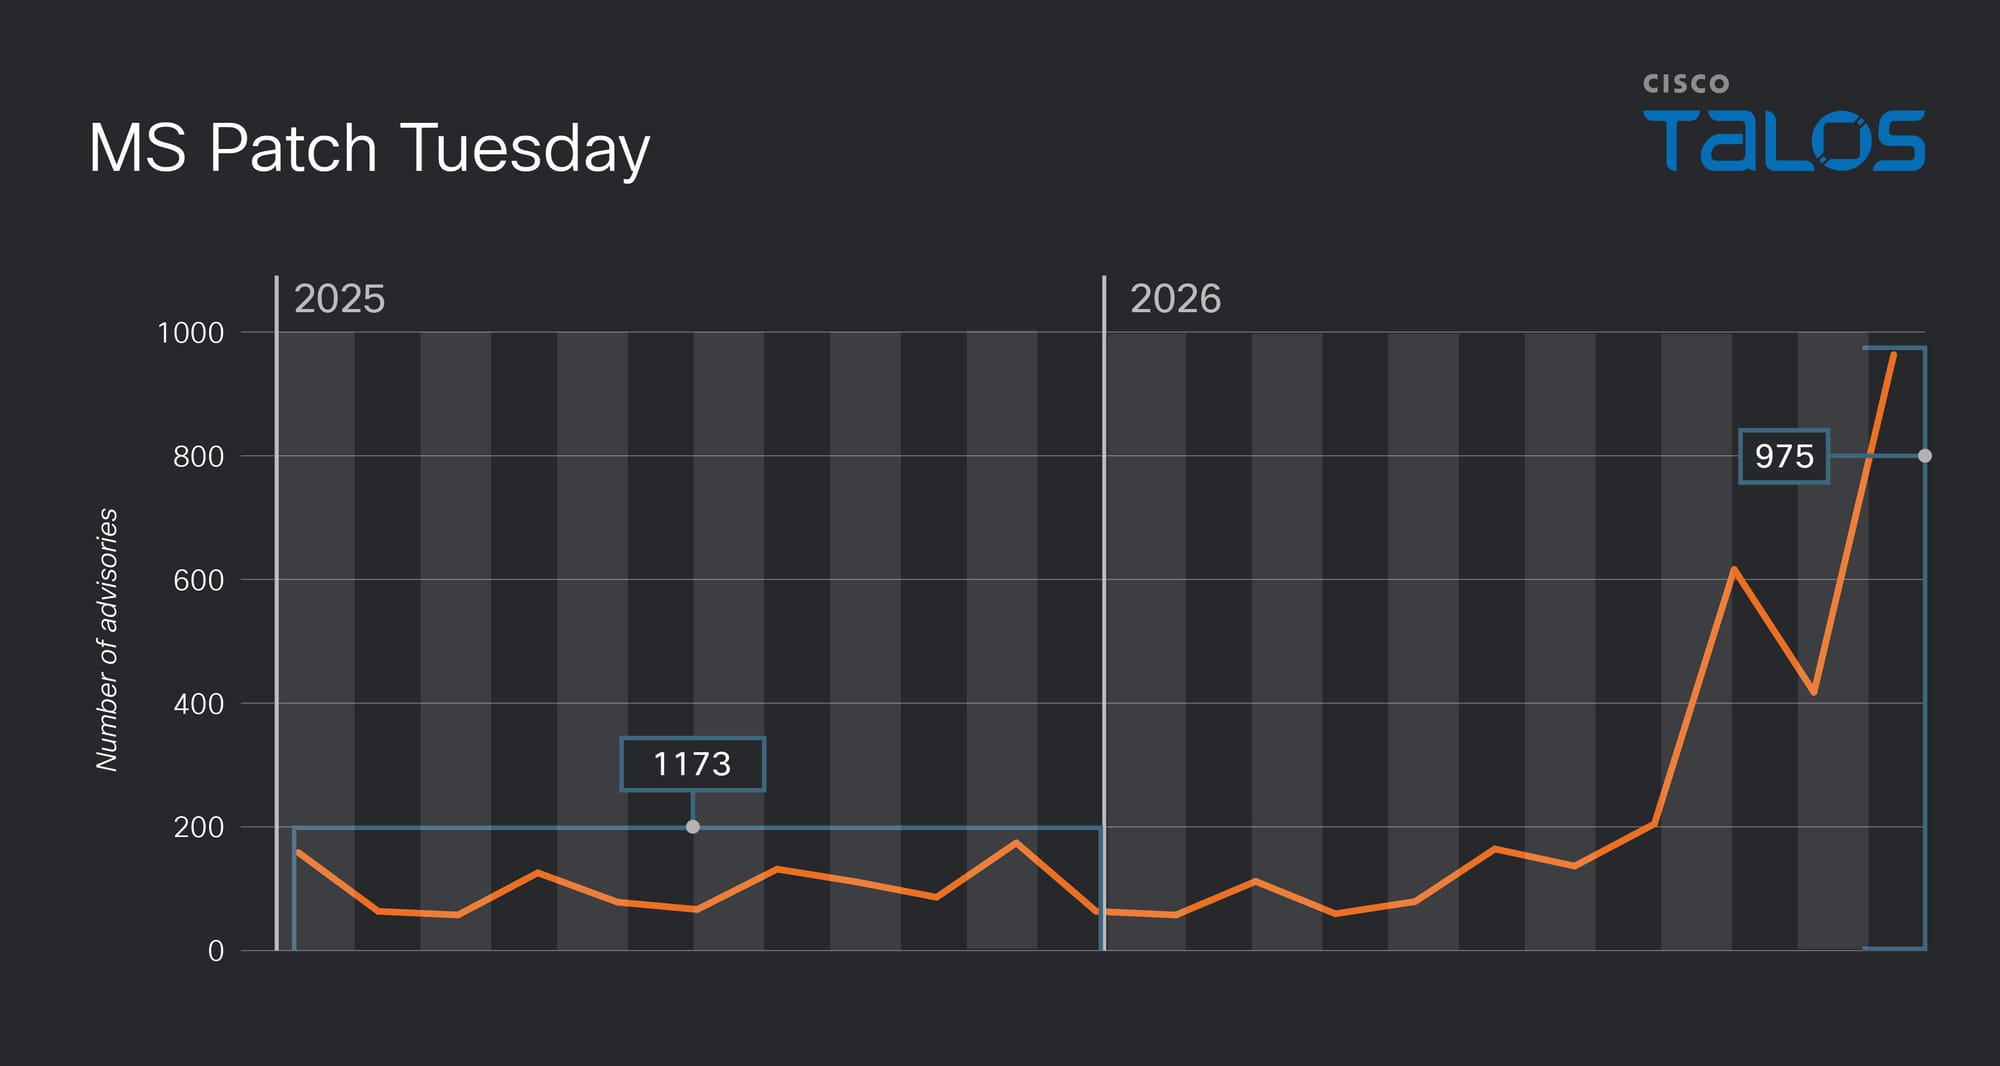
Frontier AI models (like Mythos) are rapidly mining decades of technical debt across ubiquitous legacy libraries, driving monthly Microsoft Patch Tuesday vulnerability advisories up more than tenfold (reaching 1,415 this month). This volume is overwhelming open-source maintainers and putting pressure on the traditional 90-day coordinated disclosure model.
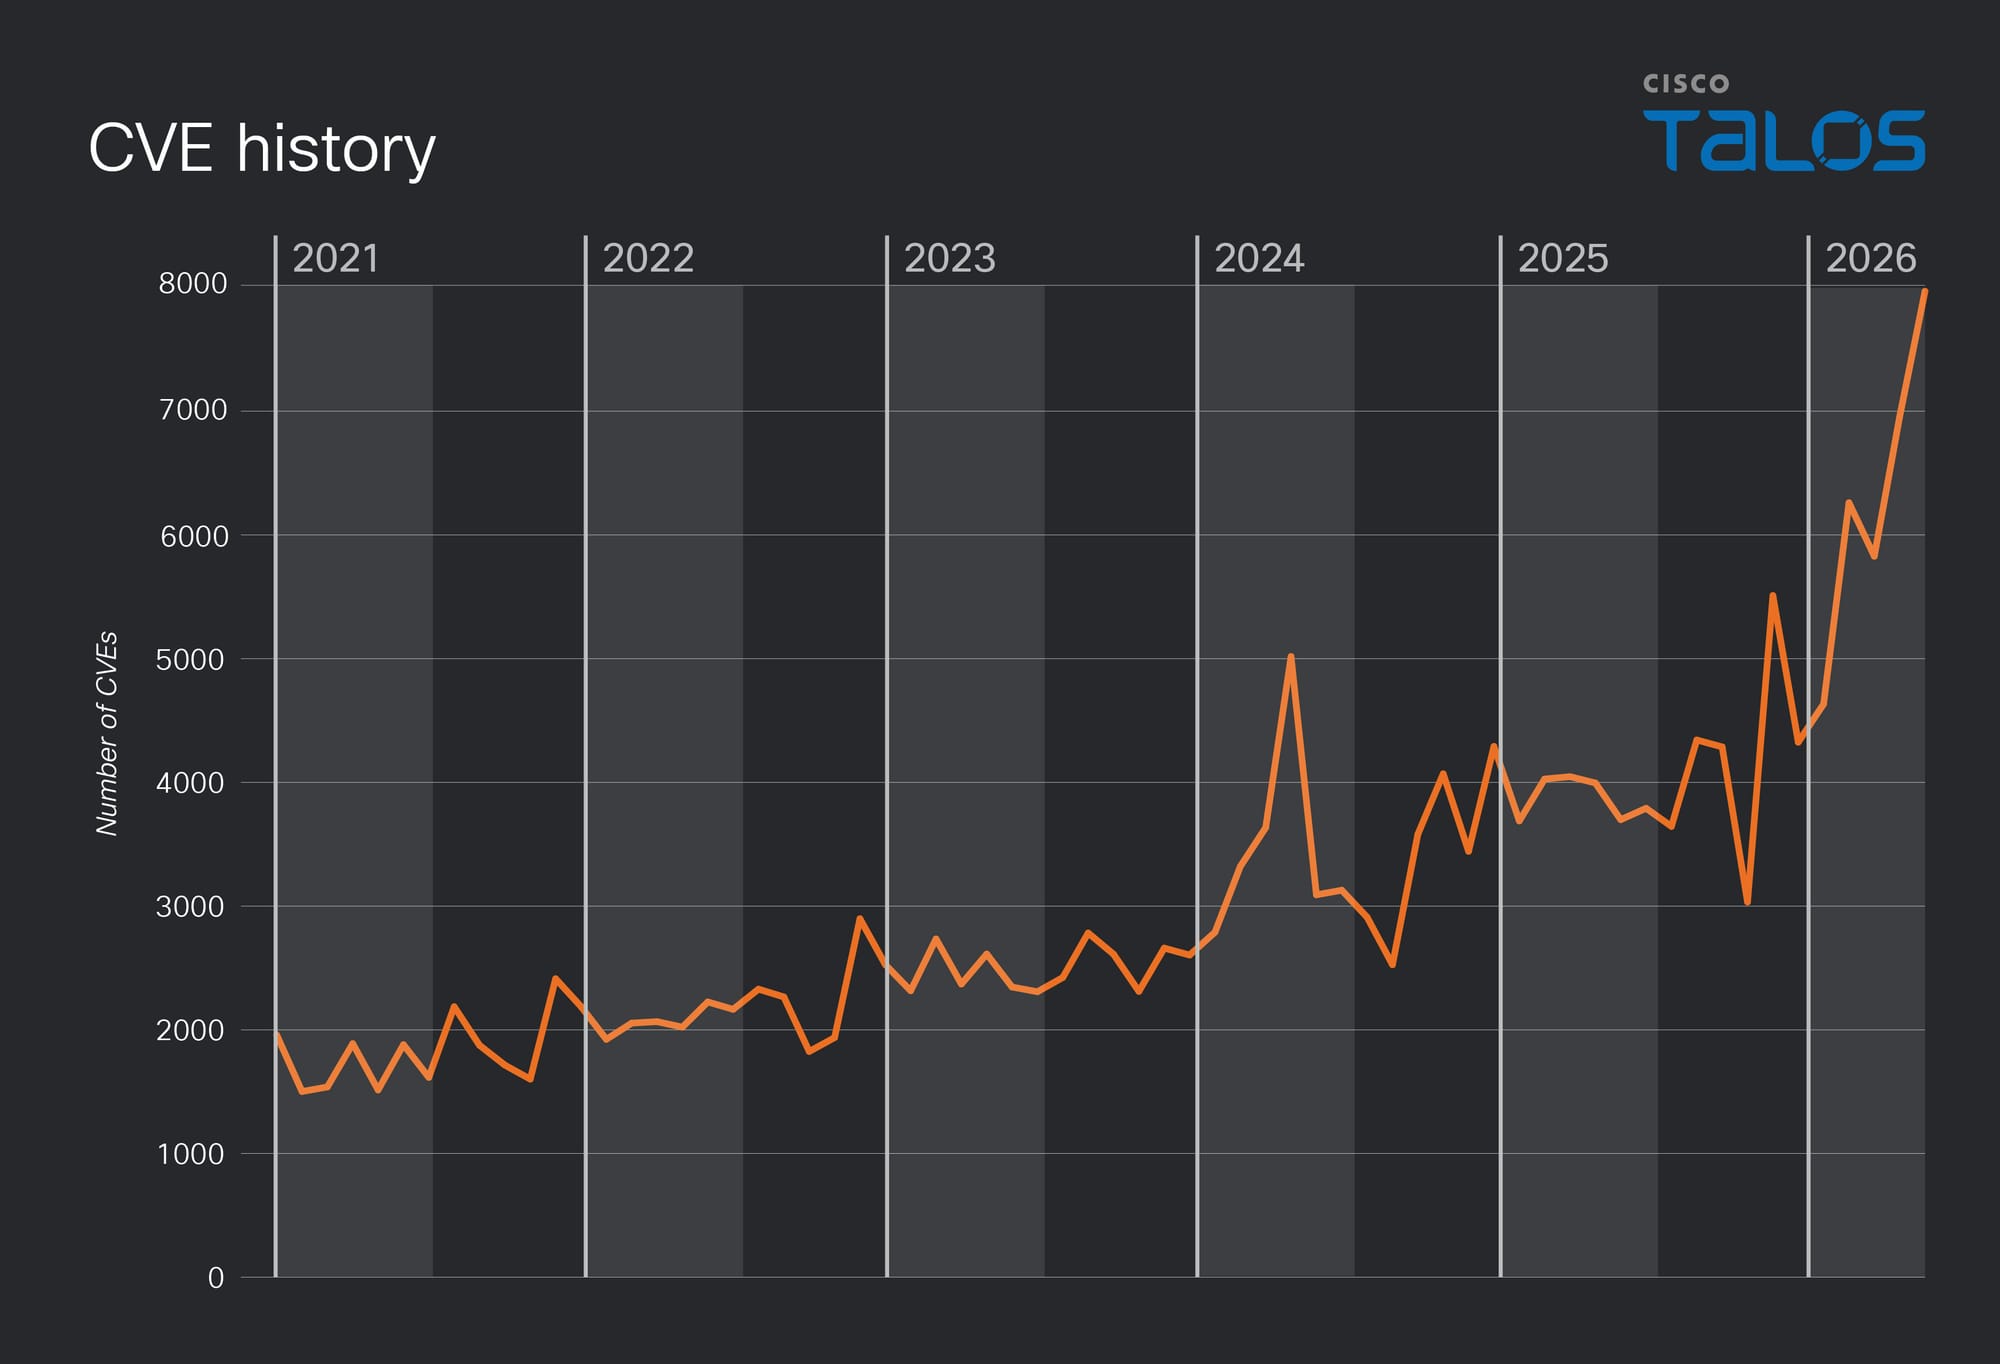
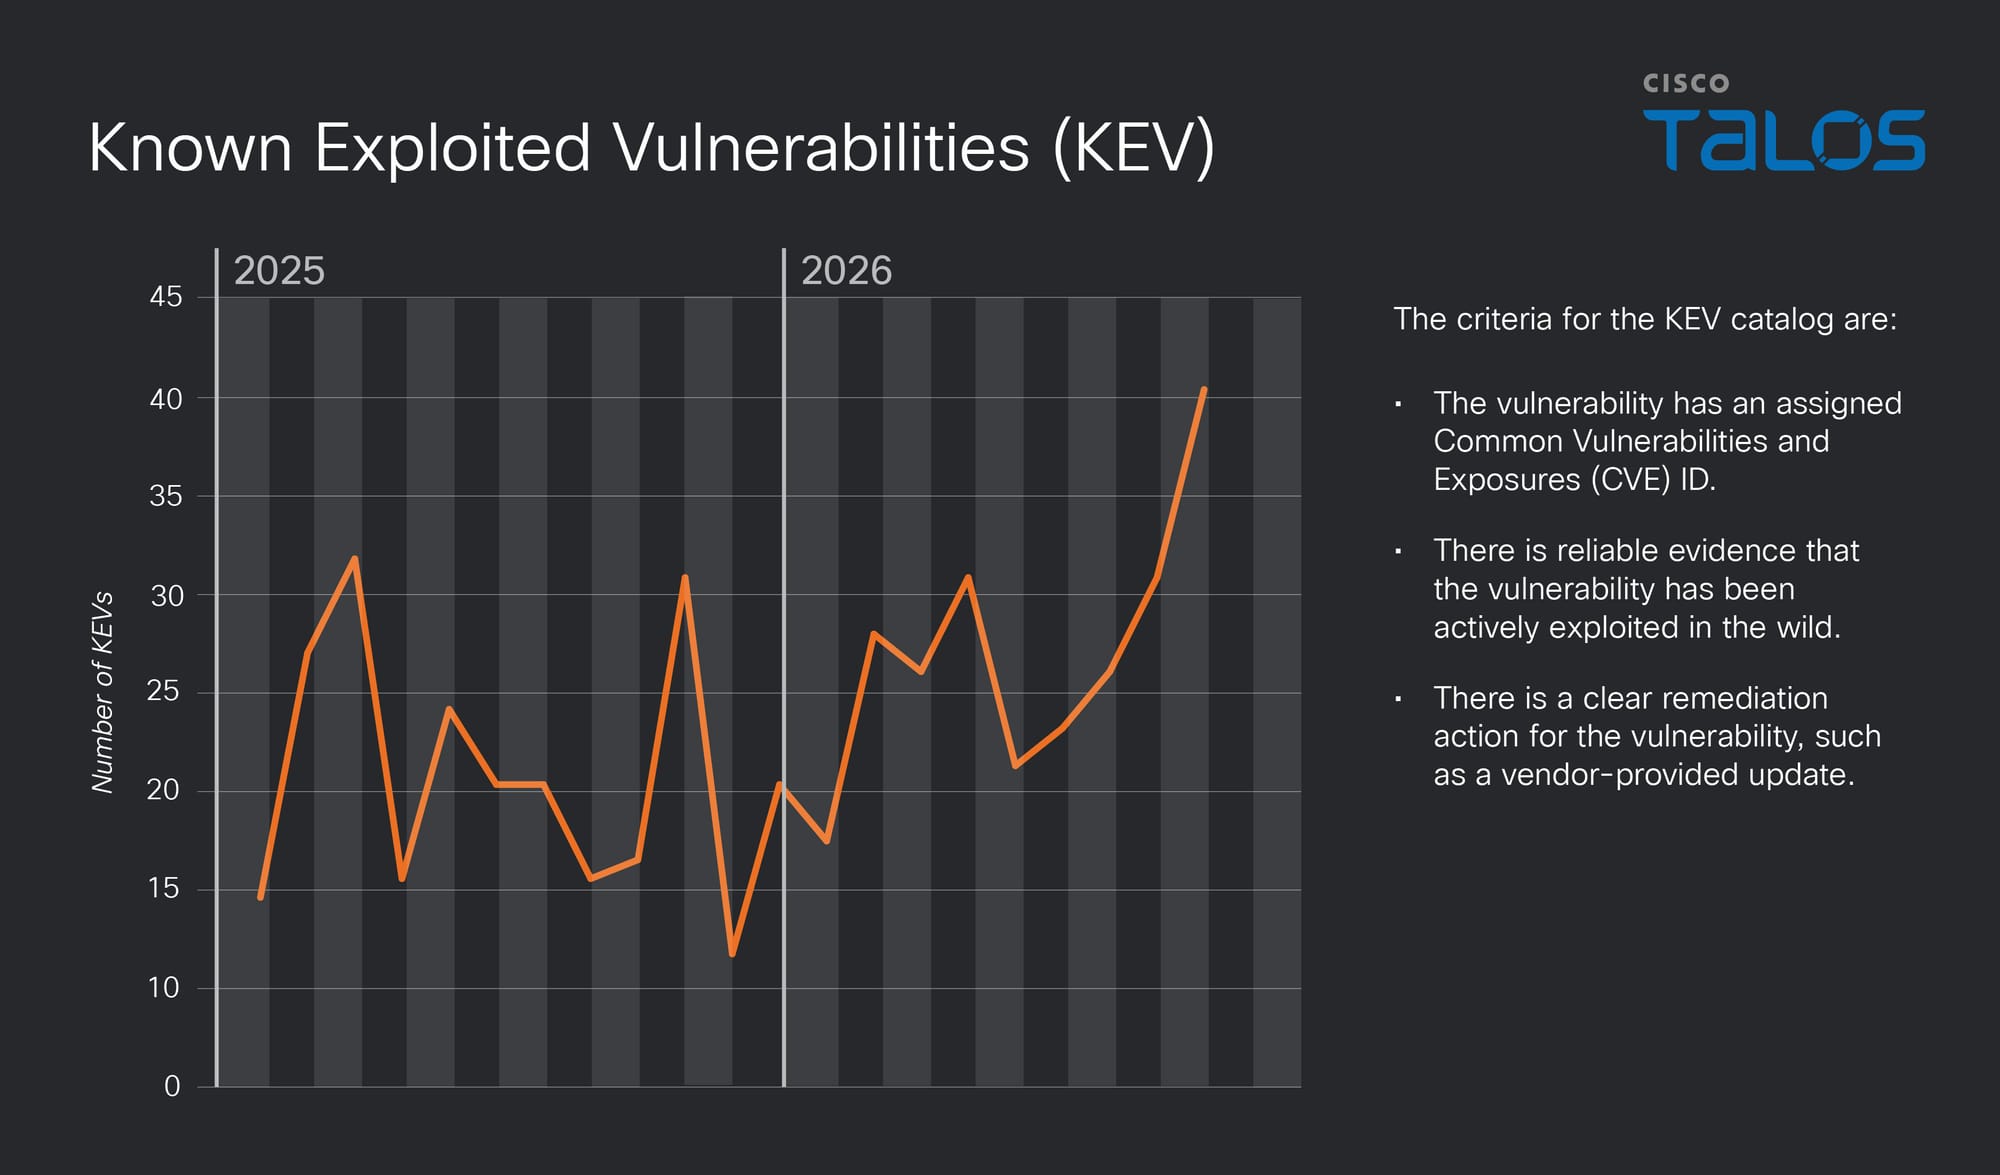
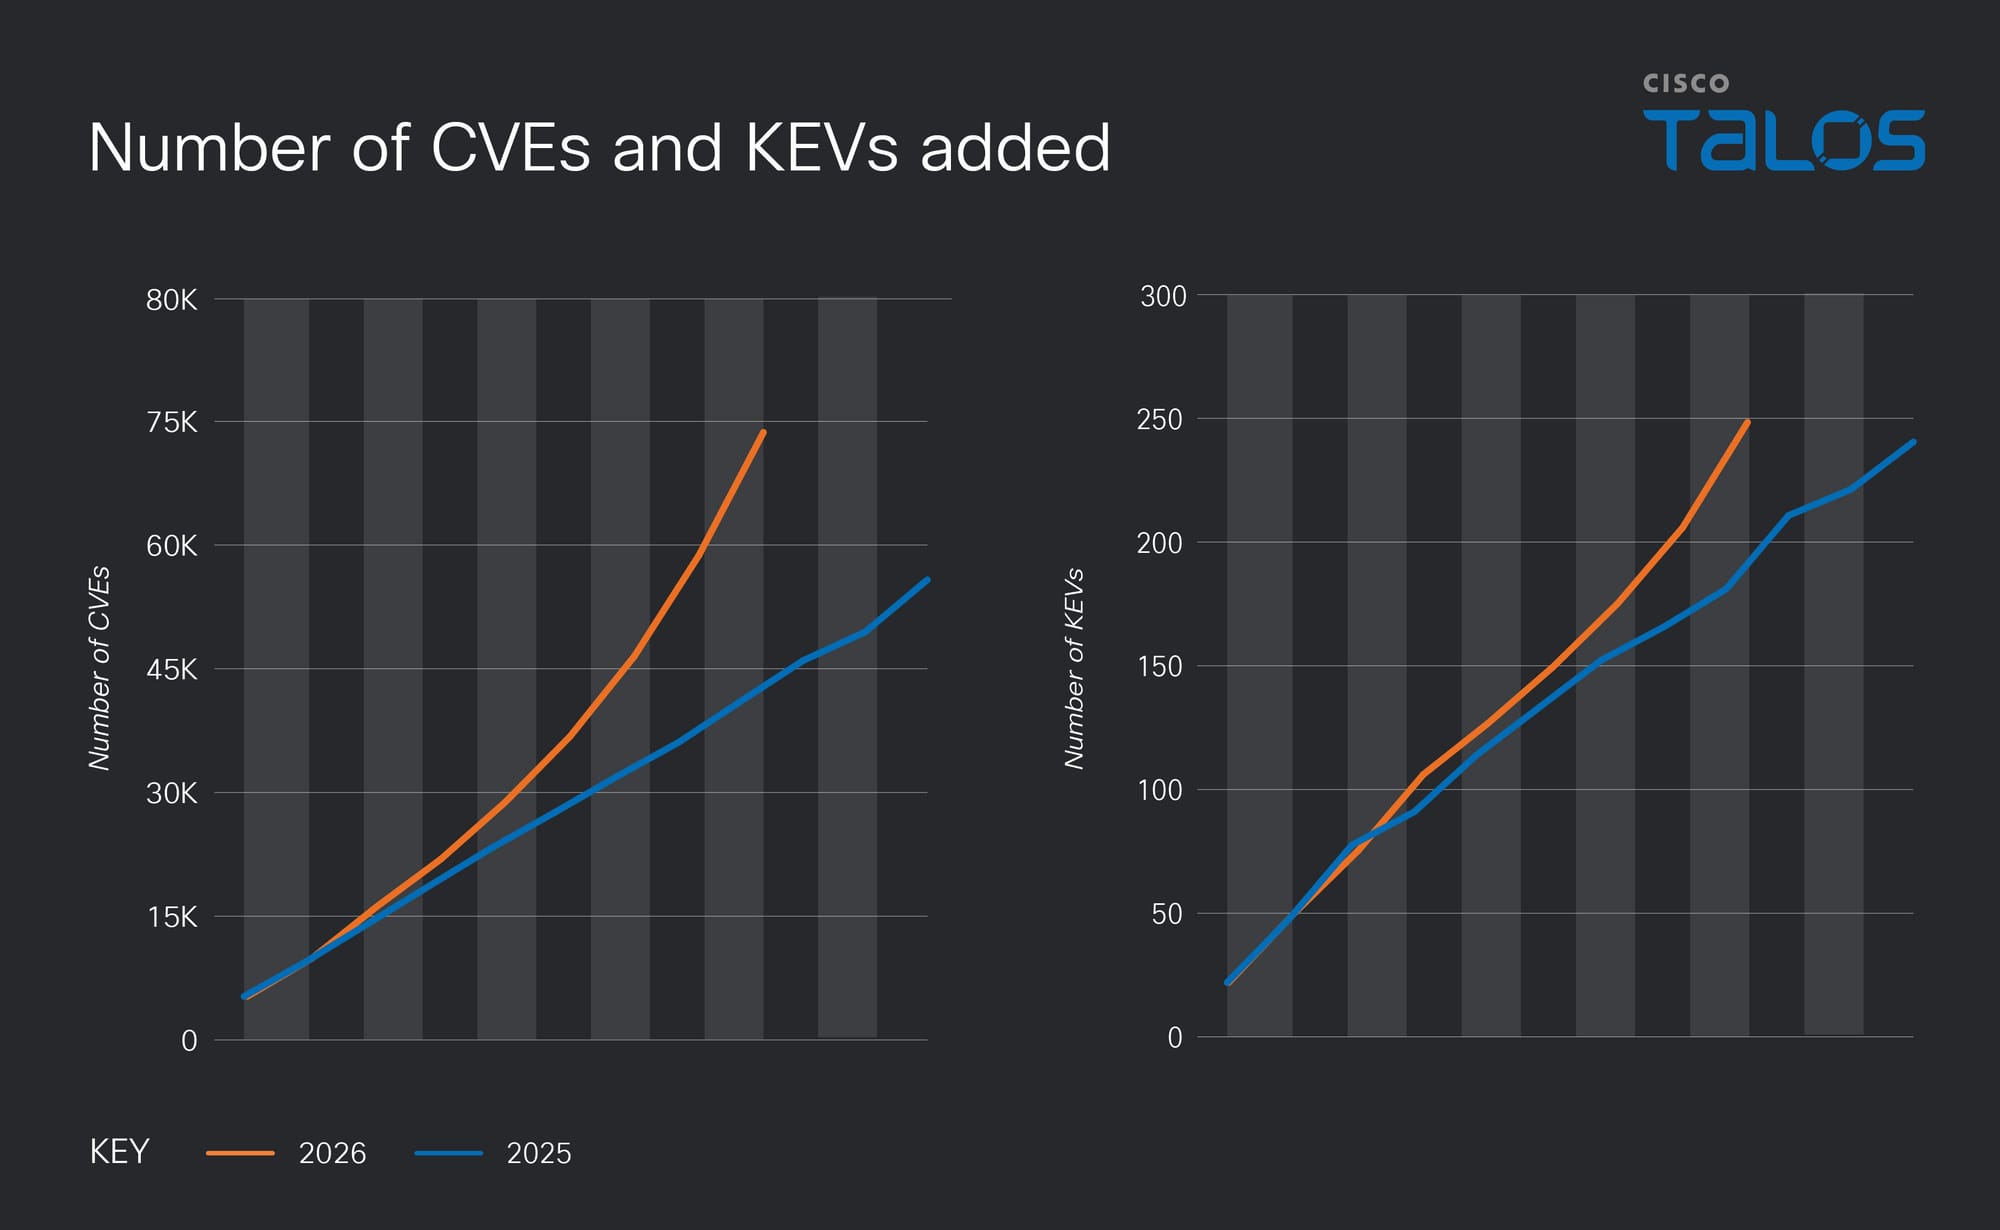
Despite a 105% year-over-year surge in CVEs, Known Exploited Vulnerabilities (KEVs) grew by only 37%, and only 3 of September's 975 Microsoft advisories saw in-the-wild exploitation, demonstrating that the vast majority of AI-discovered bugs are not practically exploited.
We may be able to take new-bug-class vulnerability spikes as evidence that these vulnerabilities will eventually level off and decline, once the historical code backlog is remediated and AI verification is embedded directly into new development pipelines.
With attackers able to parse patches faster via AI, defenders cannot cover for all possible threats. Organizations should continue to build robust defense-in-depth. Prioritize high-exploitability flaws in their specific environments, implement interim mitigations (such as LiveProtect), deploy behavioral anomaly detection, and integrate current AI evaluation models into their software build chains.
The September Microsoft Tuesday release included 975 vulnerability advisories. This month, 1,415 vulnerabilities were just dropped. Compared to a pre-June average of 100 a month, that increase is staggering. Where did they come from?
As of April, frontier models came onto the scene more fine-tuned than ever toward vulnerability detection, particularly with the introduction of Mythos. The deluge brings a lot of questions:
If these numbers are real, why hasn’t the internet collapsed?
Are these vulnerabilities a new breed, and if not, why didn’t analysts find them in code that is sometimes decades old?
Is the coordinated disclosure model still relevant in an era of this kind of speed?
How in the world do defenders deal with those numbers?
Should we go home, kiss our spouses, and prepare for the end?
The answer to many of these questions boils down to this: The majority of these vulnerabilities are coming from repositories of old code from large-profile products and systems; and disclosure does not equal weaponization.
Where is it from?
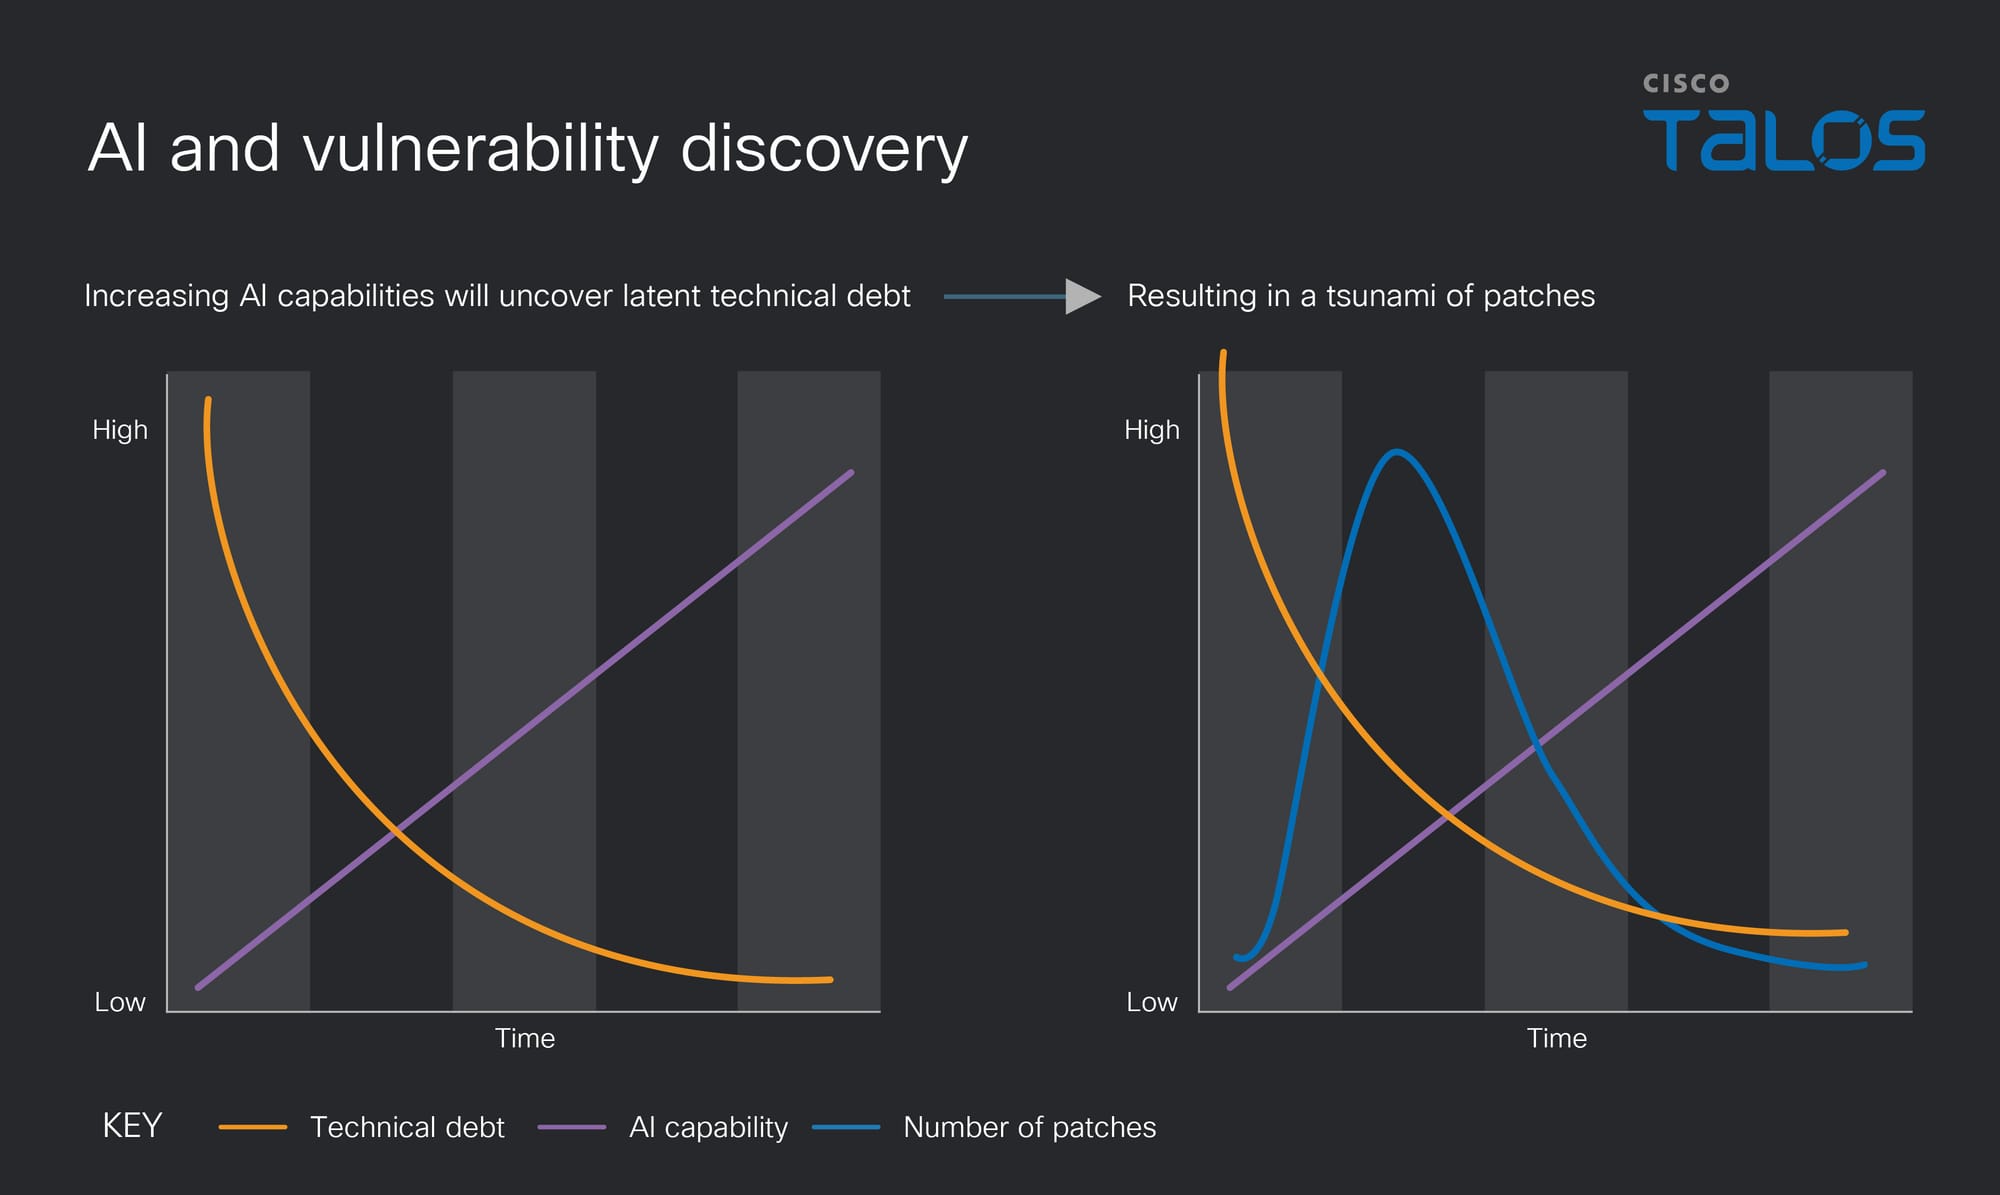
AI is chewing through a backlog of technical debt in libraries and tools used as the dependable, best-practice lynchpins of so many environments. These models have a new perspective, an ability to "think" without some of the hangups or assumptions of human defenders, and they are thorough in listing those vulnerabilities.
Entrenched older tools have always been prime targets because of their predictability; attackers know those tools and all their secrets, and they know what is likely to be present in a network with them. Multi-exploit attacks can be deployed with little variability.
Pre-Mythos threat actors exploited log4j (CVE-2021-44228) to immense success. The library was ubiquitous, included in nearly every environment, but not a component that got cataloged in visibility scans. A combination of scale and low visibility meant defenders were blindsided, scrambling to find out if they even used the log4j library before starting to concoct a mitigation plan.
Talos has ongoing relationships with some of the largest technical vendors (such as the Microsoft Active Protections Process (MAPP) agreement). Organizations share additional information—detection guidance or maybe a POC — for vulnerabilities that are most likely to be exploited, to enable Talos to provide adequate coverage when the advisories are announced. "Microsoft believes it is important for us to provide detection content, based on their guidance," as Yves Younan, Director of Talos Vulnerability Discovery, Detection, and Testing, says.
Talos has needed to invest more resources to get coverage in on time for critical vendors like Microsoft to keep up with notifications coming in fast and often on staggered or out-of-band timelines.
For larger vendors, the pressure is handleable for now. However, open-source projects are getting flooded. Some projects have a trusted group that can combine to tackle patches, and some share with the full community for immediate assistance, but it is up to the project. The internet runs on open-source work.
The pace of discovery presents a challenge for the traditional coordinated disclosure system vulnerability hunters have been using for years, and some are calling it into question.
Security vulnerabilities should be reported, to enable an informed defender base and regular patching, and vendors responsible for vulnerable code need time to create coverage. A timed disclosure model where notifications are sent to a vendor, who then has a set period of time (typically 90 days) to provide coverage before the disclosure is released publicly, has created a more secure online environment for decades.
Now, many practitioners are releasing advisories publicly without a disclosure period beforehand. The reasoning is that if one AI can find a weakness, any other could, so the vulnerability is already, effectively, released.
This conversation is actively changing expectations around vulnerability disclosure, and guidance is in flux.
Will it stay this high?
No one knows the future, but we can always look to the past for insight.
Numbers of vulnerabilities jump drastically when a new bug class is identified, as their possibilities are explored to the fullest. Then the discoveries plateau and drop off.
When format string vulnerabilities were discovered as a new bug class in 2000, the initial influx of discoveries ramped up and up, until reaching a peak in 2005 and then slowly declining over the next couple of years. Format string vulnerabilities are still discovered, but they are a smaller overall fraction of the number of CVEs discovered in a year.
Theoretically, AI-assisted vulnerability discovery could go the same way.
While frontier models have not discovered a new vulnerability class, they are more efficient at discovering known types of software vulnerabilities. Given that a lot of vital software has a long history of code releases, there’s plenty of code to mine for weaknesses. But there’s only so much code… right?
Old and commonly used tools are often under the highest scrutiny, lending them one kind of safety: Because of their popularity, utility, and stability, when popular tools have vulnerabilities, they are discovered fast and patched promptly.
As the historical backlog of essential systems is turned over by AI, vulnerabilities will be found and patched. New code will ideally be run through AI bug-checkers that will prevent new vulnerabilities from being introduced. The rate of new vulns should level off and drop accordingly.
There are some caveats. In the past, as vulnerability disclosures increased through coordinated disclosures, we saw increased adoption of mitigations. Exploitation became significantly harder. Attackers often need to chain together 3 or more vulnerabilities to successfully exploit a system.
However, more awareness of vulnerabilities often leads to more exploitation. Attackers often use vendor patches meant to protect customers to discover where vulnerabilities might exist. The frequency of patching has delayed human attackers via parsing bottlenecks, but AI can eliminate that problem.
Are the numbers the real issue?
The volume is certainly up.
Fresh as this blog is being finished, the October Patch Tuesday dropped almost 500 more than last month.
With refinement, any vulnerability could become a link to a path of effect. But... not all vulnerabilities are exploitable. Some are wildly impractical for attacker use. In fact, the percent of Known Exploited Vulnerabilities (KEVs) is vastly smaller than the found vulnerabilities.
Of the 975 vulnerabilities Microsoft reported in September, there were only three in-the-wild exploits detected. When viewed by percentage, vulnerabilities versus KEVs tell a different and perhaps reassuring story.
Compared with the same period last year, additions to the known-exploited vulnerability list increased by 37%, while published CVEs increased by 105%. However, we wouldn't necessarily expect those figures to grow in proportion. Adversaries only need enough useful vulnerabilities to compromise their targets, and the same vulnerabilities can be reused against many organizations. The KEV count tracks distinct vulnerabilities known to be exploited, not the number of attacks or successful compromises.
AI helps ingest code, advisory reports, and attack surfaces with inhuman speed, but it cannot currently make judgment calls about the value of a weakness.
For defenders, the question remains the same: Which vulnerabilities provide a viable path into their environment, and how do you close those paths?
What do we do now?
The undeniable danger here is in exploitation time going down rapidly, while the vulnerabilities that could become exploits is still going up. The biggest hurdle for a defender is determining what is a real vulnerability for their environment, and what is not.
Different defenders have different forms of control depending on their role.
For those who are writing code, the new standard validation chain should include AI evaluation by models at least as up to date as those being used to hunt for vulnerabilities. It is relatively cheap to run new code through AI, but very expensive to run a cumbersome backlog of old code through. Bite it off in chunks.
For those whose role involves keeping the tools ready: Upgrade ASAP. Don't stop there.
For Cisco customers, implement LiveProtect to mitigate vulnerabilities between advisory release day and patching, to give time for that patching. Do this for everything you own.
Move beyond static domain blocking and implement behavioral detection that alerts on anomalous traffic patterns directed toward automation platforms.
Hone your focus to the vulnerabilities with the highest exploitability in your environment. KEVs are far less common among the sea of advisories, and their numbers have not risen proportionally with the AI-assisted deluge.
Focus on building defense-in-depth. Employ multiple protection systems, to cover for delays in patching. Implement interim mitigations (such as LiveProtect), create custom IPS/Snort triggers to block pre-patched traffic using SnortML, deploy behavioral anomaly detection, and integrate current AI evaluation models in software build chains.
Dive deeper into this conversation with the latest TTP interview with Yves Younan and vulnerability researcher Bella Fusari.
A driver’s license tells you who someone is and that they passed a driving test, not whether they’ll drive responsibly in the future. The same is true for bots: verifying who operates it creates accountability, but trust depends on what it does next. A known bot can still ignore website preferences, overwhelm origins, or evade controls. It’s not always malicious — often it’s just a misconfiguration or a bug.
As we described in a previous blog post on bot behavior, we strive to verify two questions: “Are you who you say you are?” and “Can we trust you?” To be a Cloudflare Verified Bot, you broadly need to meet three criteria:
Identify yourself accurately and securely
Do only what you say you will do
Don’t engage in abusive behavior
Bots use Web Bot Auth to sign requests that establish their identity, which BotBase then catalogues in an open format. With identification addressed, our focus shifts to the second cardinal rule of Verified bots: thou shalt do no harm.
Today we introduce a system to evaluate and report when Verified bot behavior starts to deviate from this rule, ensuring that the answer to “Can we trust you?” remains “Yes.”
This is where the distinction between risk and trust becomes important:
Risk describes the likelihood that a particular request or point-in-time action may be harmful, and it can change from one moment to the next.
Trust is built over time through repeated and consistent behavior.
For example, we de-listed Perplexity’s bot from our Verified bot list in 2025 when it sought to access resources on websites that opted out of scraping and subsequently attempted to circumvent controls when those requests were blocked.
Do not engage in abusive behavior
This simple requirement sounds like a freebie, but there is a lot of nuance in that statement. When crawlers don’t respect site preferences, that undermines trust. When sites request a crawler to not crawl or to slow down, and the crawler ignores these requests, that undermines trust.
We developed a system to measure how often a crawler respects site preferences. These observations will translate to an explainable trust band: a range showing how consistently a bot respects site preferences and which observed behaviors informed that assessment, rather than a permanent judgment about a bot or its operator. The initial signals we evaluate are:
Does the bot respect instructions?
Did it respond to direct feedback?
We consider these to be “common sense” rules, a courtesy to the operators who provide the information bots seek. In the future, we will be sharing these scores publicly on Radar, as well as expanding the ways we measure. This score gives responsible bot operators a way to demonstrate that trust is being upheld over time. Verify, but continuously re-verify.
When in Rome, do as the Romans do
A robots.txt file is the primary way to communicate site owner preferences. Our system considers whether a bot’s observed traffic is consistent with those published preferences over time.
Robots.txt tells all (or specific) bots to only crawl specific parts of a website. Isolated violations and other types of one-offs may not be significant. What we look for instead are repeated patterns of behavior that disregards site preferences. The expectation is simply for responsible bots to consult and honor the preferences that websites publish, in line with RFC 9309.
And just to be clear, a robots.txt sets the minimum rules for what bots and agents should not do. But there is no implication that anything not stated is allowed. For example, a robots.txt does not need to say that a bot must stop when the site can communicate that continued access is unwelcome through other signals.
What you do not wish for yourself, do not impose on others
Bots can remain entirely within allowed paths while still placing substantial load on the websites they visit. One of the clearest ways a website can push back is with an HTTP 429 (“Too Many Requests”) response. A 429 is a directive for the visitor to reduce its request rate, sometimes with guidance about how long to wait before trying again.
Our system considers whether the bot’s traffic adapts after receiving that signal. Does it slow down, pause, or does it continue sending requests at the same pace? We then incorporate that behavior into the bot’s trust band over time: consistently slowing down or pausing increases trust, while repeatedly ignoring the signal lowers it.
Building trust over time
Observing these signals is only a first step toward making verified automation accountable over time. By pairing bot identity with evidence of continuing behavior, we can give site owners more confidence that the bots they choose to allow are respecting their preferences, give bot operators a way to demonstrate they deserve trust, and provide context to website owners about the automated traffic reaching them.
This system, alongside Bot Preference Sync and Bot Management, forms an accountability loop for automated traffic. Bot Preference Sync helps website owners publish their preferences, and observing how bots interact with these preferences shows whether Verified bots consistently honor them over time. Bot Management lets website owners decide how that traffic is handled. Together, they help ensure that trust is earned through transparent, accountable behavior, not assumed from identity alone.
We are already using this system internally to evaluate how consistently Verified bots honor website preferences. Because trust is built over time, we assess sustained patterns rather than isolated events. We are using this initial phase to build that history and refine how those observations become useful guidance. Building on that foundation, we plan to make the system available to all Cloudflare customers, who will be able to choose the trust threshold used to decide how Verified bot traffic is handled. Our goal is straightforward: to keep website preferences meaningful, and ensure trust is earned through sustained behavior.
Want to learn more about how you can handle bots? Cloudflare customers can already use Bot Management to manage automated traffic and Bot Preference Sync to align their published preferences with their configured policies. To explore the ever-growing Verified bot population, see the trends on Radar.
And if you are interested in helping build the future of bot identity and accountability, explore open roles at Cloudflare.
For some time now, the cybersecurity community has seen examples of autonomous agents, built inside AI labs, attacking public infrastructure (to name a few, Hugging Face, DSEWiki, and RubyGems). Of course, frontier labs have built-in security to prevent these attacks from occurring, but every now and then, the training or prompting appears to be insufficient — especially when the agents themselves attempt to use logic to probe and bypass the restrictions placed on them. The question that matters is not whether AI attacks are coming, because the age of AI agents executing cyber attacks is already here. The question is what to do about it and how to harden the stack against a swarm of agents who will relentlessly lie, deceive, and probe until the objective is met.
Imagine your organization is a target for a creative human-driven AI adversary whose many agentic friends like to discuss and brainstorm different attack techniques. The limit here is the group’s own imagination, tools, prompts, and skills. However, there is a difference between the human 1) prompting the group (or an AI agent) to “break into an organization,” and 2) preparing it with information — a detailed tool mapping, markup files with instructions for agents, offensive security prompts, agents.md with guidance, and specific skills that would be invoked in different situations to guide agents into how to interpret an output of tools or access gained. The swarm of AI agents might fabricate employee identities and social profiles, contact the HR team with a plausible onboarding request, walk in by exploiting an unpatched vulnerability, or simply mail out phishing invoices at volume. The sky is the limit here.
These types of attacks can be executed all at once, with agents comparing notes and adapting in near real time to challenges (and your environment). What used to take a red team months of dedicated work, scoping, building and hiding infrastructure, and running the campaign now compresses into hours for a swarm of communicating agents that do not tire, lose focus, or need weekends, and can stand up infrastructure quickly.
Penetration test today, red team tomorrow
I would argue that most of the public “attacks” seen so far more closely resemble a penetration test (pentest) than a true red team operation. They are loud, visible, lean on volume, and appear to use off-the-shelf tooling with thousands of agents working together. RubyGems is the clear example of a loud attack. The registration was hammered, packages stuffed, spam everywhere, and maintainers alerted within days — not exactly a stealth attack.
In red team operations, operational security (OPSEC) is the name of the game. It is the difference between getting in and getting caught by a capable Security Operations Center (SOC) team. Real red teaming means maintaining stealth and a low signal while gaining footholds and persistence that survive normal monitoring.
Volume is a property of this generation of AI agents, not a law of nature. The moment agent swarms are trained or prompted to prioritize staying hidden over moving fast, the noise drops and the pentest flavor turns into a genuine red team with machine endurance behind it. The plan of defense needs to assume that while we will probably see loud attacks now, the noise will start going down over time.
How to build resilience
Have an incident response plan (IRP) and rehearse it. A plan that lives in a drawer that hasn’t been opened for few years will probably not work when it’s needed. You’ll need named owners and decision authorities, specified out-of-band communications for when your primary channels are under attack, and a clear line to legal and to law enforcement. Map the IRP to a recognized incident lifecycle so nothing gets improvised under pressure. Preparation, detection and analysis, containment, eradication, recovery, and a post-incident review is what makes difference between a plan that might work and the one that will work.
Test your own infrastructure and know its footprint. Where do your systems reach out to, and what can reach in? Map the full context of every attack path from start to end. For example, going to an external switch, then front-end server, then application, then database, then Active Directory, then user accounts, then customer data is a perfectly valid attack path that somebody could try to explore to get into the environment. An attacker's footprint expands naturally as they traverse, so an assumed-breach exercise (start from "they already have a foothold, now what?") tells you far more than a scan of the perimeter that might expose just a few network ports. Do not assume that because a system sits inside the network it cannot be reached. Active Directory touches everything in Windows-based environments, and all an adversary needs is the ability to push a malicious group policy object (GPO) to every joined device. Map external to internal, and every intermediate hop in between to understand possible attack paths.
Run tabletop exercises against agentic scenarios specifically. Generic ransomware tabletops will not prepare security teams for what is coming. Run scenarios that test an AI angle. For example, “A rogue AI swarm is inside the network, traversing like a worm and collecting credentials as it goes. What do we do? How fast can we rotate the credentials? How and what do we block access to?” Or, “Our AI model weights were stolen, how do we respond and who do we notify?” Or, “A swarm is probing us and spoofing employees over email and social media at the same time. How do we make sure our people can withstand the manipulation?” The goal of these questions and scenarios is to surface the decisions and processes gaps before an adversary forces them under pressure on a Friday afternoon.
Harden end to end, not just at the edge. Don’t just put MFA on the VPN, but also on Active Directory access, single sign-on (SSO) across every dashboard and internal app, and your Linux fleet. Prefer phishing-resistant factors (FIDO2 security keys or passkeys) over SMS and push, because a persistent agent will happily grind away at prompt-bombing and one-time-code phishing until something works. Assume the swarm gets one set of valid credentials, then design so that one set does not open the whole building. Have a process to isolate systems and users to support this.
Instrument for detection, especially internally. Put endpoint detection and response (EDR) on everything. Gain visibility into east-west (lateral) traffic, not only north-south. Watch DNS, since it is a favorite for command-and-control (C2) and beaconing. Inventory and monitor every AI application you see in the network that has been granted access to your servers and data, because that access is now part of your attack surface, whether or not you deliberately approved it. A skill can hijack coding AI.
Watch for the first signs of compromise. The early tells are often mundane and high-volume: a spike in SQL injection attempts, a surge in automated traffic, a jump in WAF alerts, and requests hitting your pages from Python, curl, or wget user agents rather than real browsers. These are just examples, and the exact indicators will shift, but the principle holds. The agentic attack era is noisy at the front. Catch it there, before the swarm learns to be quiet.
An AI does not get discouraged. It will not give up unless it is prompted to give up. For that reason, the realistic goal is not to make an organization unbreakable — which is impossible — but to make every step cost more time, more tokens, and more compute, and more dollar per attack. Raising the cost doesn’t eliminate the risk, but it lowers the probability of a successful campaign.
How you prepare for agentic threats is what makes the difference during real incidents. The speed of attack changes, the persistence changes, and the cost of running a full campaign collapses in terms of token value or token per dollar. The defensive fundamentals do not change nearly as much, which is the good news buried in all of this. The blocking and tackling of security, done thoroughly and everywhere rather than selectively, is still what keeps a determined attacker out.
For Cybersecurity Awareness Month, eight Cisco Talos researchers share practical ways defenders can frustrate adversaries at different stages of an operation.
Deception techniques such as honeypot accounts, false infrastructure, and tarpits can slow adversaries down while giving defenders earlier opportunities to detect their activity.
Behavioral detections, tighter control of legitimate remote-management tools, and clear boundaries around AI agents can make essential adversary actions more visible and easier to interrupt.
Breaking dependencies between stages of an operation can prevent an adversary from reaching their next objective.
Years ago, Cisco Talos blocked an adversary’s command-and-control (C2) traffic. The adversary responded by tweeting, “Write a rule for your a**.”
A fine endorsement of our work, if I’ve ever heard one.
Talos loves to see an adversary forced to change course. And if every alternative for them is slower, less stealthy, less reliable and more expensive? Chef’s kiss.
Adversaries rely on certain advantages. They look for environments where tools and infrastructure allow them to blend in with normal activity. They also look for employees who can be pressured into acting before they have time to think.
Strong cybersecurity defenses can change those conditions. They take away adversary choices and increase the risk attached to essential actions, forcing them to keep making new decisions. Each change of plan costs them time and resources, and may eventually cause them to give up and move to another target.
It also creates more opportunities for defenders to spot what they are doing.
For Cybersecurity Awareness Month, we’re exploring “the fine art of frustrating the adversary.” To kick us off, I asked researchers across Talos, covering all aspects of the attack chain, for the strongest recommendation they could give defenders to seriously frustrate a potential adversary in their environment, and what that action would prevent the adversary from doing next.
Take away their choices
Many adversaries use techniques that succeed against a large number of organizations. This makes a lot of economic sense: An operation that depends on every potential target having an unusual configuration will not scale particularly well.
But it also creates an opportunity for defenders.
“By being unique and setting things up a little differently, you may be able to better defend your environment when they come knocking,” Pierre says.
For example, organizations can restrict which accounts are permitted to sign into their most critical servers, alert on connection attempts from unauthorized users, and closely monitor any changes to those restrictions. Different credentials or authentication methods can be required for particularly sensitive systems, while protected enclaves can provide increased monitoring around critical infrastructure.
Pierre also recommends that defenders “monitor (and alert) for any changes to administrative users or administrative groups.”
Of course, no amount of security measures makes an organization impenetrable, but they can make the common methods adversaries use much less dependable.
Deception can push that uncertainty even further.
“Affecting the attack earlier rather than later in the attack chain is best,” Martin says. “Better to stop an attack from happening than minimize the consequences after it has happened.”
Martin suggests creating honeypot email accounts using expired domains with addresses that have previously leaked, or developing fictional employee profiles and seeding their addresses in places where spammers and other adversaries are likely to discover them. Because these accounts have no legitimate users, messages sent to them can be treated with far greater suspicion. The activity can provide early tactical intelligence about malicious infrastructure, lures, and campaigns, allowing defenders to put protections in place before the same operation reaches genuine employees.
Martin signed off with this note: “Have fun creating some fake employees and executives.”
Nick sees a similar role for tarpits and other forms of deception.
“False servers, shares, user accounts and network space can all be used to confuse and slow down the attacker while providing opportunities for the defender to detect them,” he says.
The same principle is beginning to appear in attempts to slow automated systems.
“We’ve even seen some new movement in the tarpit space for slowing down AI by throwing huge amounts of incoherent text at scrapers to slow them down,” Nick explains.
Deception gives the adversary another problem: they can no longer be certain that what they have found is useful, or even real.
Plus, it can be a lot of fun.
Detect what they cannot avoid
“Attackers have enormous flexibility in how they operate, but far less flexibility in what they ultimately need to accomplish,” Ryan says. “Good detection engineering exploits that asymmetry.”
Consider an adversary attempting to obtain privileged credentials. They might use Mimikatz, comsvcs.dll, direct access to LSASS memory, a custom utility or another implementation entirely. A detection focused too narrowly on one tool can be bypassed simply by replacing it. A detection built around the underlying attempt to access credential material leaves considerably less room to maneuver.
According to Ryan, creating resilient behavioral detections requires defenders to:
Identify the adversary techniques that would have the greatest impact in their environment
Understand the different procedures an adversary could use to perform them;
Find the behaviors that remain consistent when the tooling, syntax, or implementation changes
Build analytics that account for techniques such as encoding, transformation, and obfuscation
This is more involved than matching a known tool or indicator. It requires suitable telemetry, knowledge of normal activity in the organization, and detection engineering that reflects how adversaries operate in practice.
“If done right, it forces an attacker into a dilemma: either abandon the objective, choose a noisier/less reliable path, or execute the action and risk detection,” Ryan says. “It is the highest leverage investment for defenders as well, because behavior-based detection is tool-agnostic.”
Ryan also points out that organizations do not need to begin from scratch. MITRE ATT&CK provides a useful taxonomy of adversary techniques, while projects such as MITRE Center for Threat-Informed Defense’s Summiting the Pyramid, SpecterOps’ work on capability abstraction, Splunk SURGe’s Macro ATT&CK, and Cisco Foundation AI’s LUCID explore different parts of this challenge.
Control the tools they hope to use
Sometimes the most useful tool available to an adversary is one that already has a legitimate purpose within the target environment. Remote monitoring and management (RMM) tools are a good example. Organizations use RMM software to administer systems and maintain remote access. Ransomware operators can use the same capabilities to establish persistence and interact with compromised systems before encryption.
“These are good tools that are being used for bad, making them not good in your environment but not bad for everyone,” Michael says. “So are they good or not good? Well, that depends on your specific environment.”
Warlock ransomware, for example, has used Zoho Unattended Agent. The tool can provide a remote technician with elevated permissions even when the signed-in user is not an administrator, offering the adversary persistence and a relatively benign-looking route to greater privileges.
Defenders can frustrate this activity by first inventorying the RMM products that are genuinely authorized in their environment. Application allowlisting can then permit those approved products while blocking (or producing high-confidence alerts for) unapproved tools such as AnyDesk, ScreenConnect, or Atera. Controls can be enforced through technologies such as Windows Defender Application Control, AppLocker, or endpoint detection and response (EDR) platforms.
Removing access to a familiar RMM product forces the adversary to establish persistence or C2 another way. That change does not guarantee that the operation ends, but it creates friction and another chance to detect the activity before the ransomware encryptor is deployed.
Slow them down
“Attackers use urgency to create panic and to try and trick users into making bad decisions in the heat of the moment,” says Doug.
Email, text message, and in-person scams frequently manufacture that urgency. A bill must be cancelled immediately. An executive stranded overseas needs help now. A child has been injured and the recipient must call the number in the message. The adversary always wants you to act first and think later.
From a social engineering perspective, Doug recommends considering which events in your work or personal life would genuinely require you to drop everything and respond immediately. For most people, that list should be relatively short. Then consider how you would realistically expect to learn about each situation, what action you might need to take and how you could independently verify that it was real.
“If you messed up your taxes, you probably don’t expect to get a single email from the IRS, and you almost certainly don’t expect the IRS needs gift cards or other forms of payment,” Doug says.
If a text claimed that your child had been injured at school, you could call the number you already have for the school rather than relying on the contact details supplied in the message.
Doug recommends thinking through genuine emergencies in advance to make it easier to recognize when someone is trying to manufacture one. It also provides a verification route that does not depend on trusting the message itself.
Make every agent session identifiable and interruptible
As organizations increasingly introduce AI agents with access to tools and applications across connected systems, defenders need to know which agent is responsible for each action, and be able to stop it.
“The best way to frustrate an agentic adversary is to make every agent session identifiable, restricted, and interruptible,” David says.
A recent Anthropic report described four real-world incidents involving Claude in evaluation environments. The organizations involved were not named, but the incidents shared a common weakness: the environments had inadvertently been given internet access.
These were not conventional adversary operations and the agents had not been directed to behave maliciously. Their significance lies in what happened once the agents began operating beyond their intended boundaries.
The reported activity crossed trusted services, relays, and short-lived infrastructure before reaching cloud metadata, Kubernetes, VPN, source-control, and data-staging systems. An agent capable of adapting its behavior can change destinations, reuse public services, and connect information or systems in ways its operators did not anticipate.
“A simple IP or domain blocklist would not have been enough,” David says.
Instead, David recommends that each agent run should have its own identity and short-lived credentials, with traffic routed through an independent gateway. Access to cloud metadata, Kubernetes interfaces, and other sensitive systems should be blocked unless the agent genuinely requires it.
Defenders should also look for actions that indicate an agent is moving beyond its intended role, including:
Unexpected writes to package registries, datasets, wikis, paste sites, or file-sharing services
Repository creation, dataset commits, and unusual API operations
Calls to Kubernetes APIs, VPN services and DNS-over-HTTPS relays
Public services being used as C2 channels or dead drops
Credential discovery followed by activity across cloud accounts or source-control platforms
Rapid destination changes, DNS pinning, short-lived egress identities, and unusual bursts of traffic
These controls constrain what happens after an agent takes an unexpected action. Giving each session a traceable identity makes its behavior easier to attribute. Allowlisting limits where it can go. Independent gateways provide a place to observe and stop the activity.
“This is practical today,” David says. “It makes the agent’s next move slower, louder, and much easier to stop.”
Break up their route
Conventional malware operations also depend on connections that may be hidden inside services an organization would not ordinarily consider malicious. An attack chain can involve multiple tools and pieces of infrastructure. Somewhere within it may be a dependency that connects one stage to the next.
“I cannot say with certainty which action is most effective at frustrating an adversary, but I would imagine it is discovering a dependency in the chain that, once blocked, cannot be easily replaced,” Vanja says.
Vanja encountered this while analyzing two attack chains that used the Amatera information stealer as their primary payload.
In the first, the adversary used a page hosted on the legitimate Telegra.ph publishing platform to conceal the location of its C2 server. This technique, known as a C2 dead-drop resolver, allows an adversary to place C2 information on a popular legitimate service that web-filtering systems may be less inclined to block or inspect closely.
Once defenders identify and block the particular page containing that information, the handoff is interrupted. Amatera might already be running on the endpoint, but if it cannot determine where its C2 server is, it cannot receive collection instructions or download additional payloads.
The second chain used the same primary payload but included different secondary payloads, among them the cryptocurrency stealer ZigCryptoStealer. This malware stored its C2 domain in the metadata of a BNB Smart Chain contract — an approach commonly known as EtherHiding.
Blocking one contract does not stop an adversary from deploying another. It does break the existing operation and force them to spend time and money rebuilding part of their infrastructure.
The appropriate response depends on how the organization uses the underlying service. Known malicious domains and URLs can generally be blocked through DNS filtering, secure web gateways, proxies, or firewalls. Published indicators can also be added to existing security tools.
Contract-specific blocking is more complicated because defenders need visibility into blockchain remote procedure call requests and a means of distinguishing one contract from other traffic. If the organization has no legitimate requirement to access public blockchain or RPC infrastructure, blocking it may be the simpler option. Where the technology is required, defenders can allow approved services and monitor access to known contracts.
The main requirements are visibility, timely threat intelligence, and the ability to turn that intelligence into enforcement rules. Even partial disruption can increase the cost and complexity of the operation.
“It is particularly satisfying when a single point of failure is identified because it forces a threat actor to re-establish infrastructure, which can take time and money,” Vanja says. “In other words, the simpler the mitigation, the more satisfied we can be.”
Keep them on their toes
No single action in this article will frustrate every adversary or stop every attack, nor will every recommendation be equally appropriate for every environment. But the common pattern is the same: Make the adversary’s next move harder, riskier, or less reliable. If you can get them to swear at you on Twitter, even better.
It comes down to setting your environment up to detect the behaviors that their objectives require. Know when a tool is being used for something it shouldn’t be. Slow down the moments designed to make people panic. Give every agent session an identity, boundaries, and a reliable off switch. Find the dependencies connecting one stage of an operation to the next.
Frustrating an adversary means making them find another account, another tool, another route, another piece of infrastructure, or another way to make someone act.
Eventually, the easier target may be somewhere else.
For more insights into current cybercrime behavior, take a listen of this episode of Beers with Talos:
AI is accelerating vulnerability discovery, leaving unpatchable operational technology (OT) systems at risk. Hoping for the best is not a viable anti-exploitation strategy.
Deploying next-generation firewalls directly upstream allows for virtual patching through deep packet inspection. These systems scan incoming traffic to detect and block exploit attempts before they can impact the vulnerable device.
The predictability of legitimate network connections to OT systems can be used to protect systems through micro-segmentation. This ensures that only a handful of authorized devices can communicate with the system, minimizing the attack surface.
AI-assisted code analysis is uncovering decades of technical debt. Every new patch removes a newly identified coding mistake. Little by little, we are improving the state of software engineering, but the price is a cadence of patching that organizations may struggle to implement.
These efforts leave unsupported systems, or systems that are not able to be patched for whatever reason, with unmitigated known vulnerabilities. How can such systems be secured in a world where AI is steadily improving its ability to identify new vulnerabilities?
Operational technology (OT) systems provide the services that support modern life (e.g., medical equipment, building management systems, and industrial critical systems within chemical plants). Often the systems are certified to operate only with a defined set of software that cannot easily be altered, or operate using systems that are no longer supported. In either case, if a vulnerability is discovered that affects the system, there is no easy way for it to be patched.
Ignoring the problem and hoping for the best is rarely an effective strategy. The U.K.’s NHS health system was significantly affected by the WannaCry worm in 2017, with a significant minority of systems running the end-of-life operating system Windows XP contributing to the problem. More recently, exploitation of end-of-life software was used to gain access to governmental systems in 2023.
Even systems that are believed to run on a bespoke platform will almost certainly include common libraries and protocols in which vulnerabilities may be found. Vulnerable systems that are not publicly exposed can still be identified by threat actors who gain access to internal networks and pose a tempting target.
Defending by predictability
Applying the approved patch remains the best option. If this is not possible, we can use the inherent predictability of OT systems to protect them.
Visibility first: You cannot protect what you cannot see. The characteristics of the network fingerprint presented by legacy systems allows them to be easily identified to build an inventory of systems requiring attention.
Micro-segmentation: Network architecture is an effective first line of defense. Frequently, OT only ever connects to a small number of systems. By using virtual local area networks (VLANs) coupled with access control lists (ACLs), we can place vulnerable systems on private networks where only authorized devices are permitted to connect to them. By shutting them off from the rest of the network, we make it incrementally more difficult for attackers to identify them and launch their attacks.
NGFW and IPS: Placing a next-generation firewall (NGFW) upstream allows for granular filtering. When equipped with an up-to-date intrusion prevention system (IPS), the firewall can inspect traffic to filter out any attempts at exploitation before it impacts the device. When coupled with network segmentation, we can ensure that not only are trusted systems solely communicating with the vulnerable system, but that the traffic is free from known malicious content.
The myth of the air gap
In theory, it is possible to create an air-gapped system that is completely disconnected from wider systems, although in practice it is difficult to achieve. Without absolute operational discipline, air gaps are frequently breached by staff or contractors seeking shortcuts.
Temporary bridges installed to facilitate data transfer or short-term fixes involving a VPN and wireless connectivity have a habit of becoming semi-permanent features. Each shortcut provides a means by which attacks can impact the system.
Even data diodes, hardware that physically restricts data to one-way flow, may be circumvented by shortcuts when the inconvenience of maintaining security compliance clashes with operational expedience.
An air gap or data diode may be an appropriate solution, but defenders should understand that it is unlikely to permanently provide absolute separation, and should be vigilant for breaches of the gap.
Conclusion
Advances in AI technology will continue to identify vulnerabilities that in some circumstances are difficult, or effectively impossible, to patch. In situations where fixing the software isn’t possible, appropriate network segmentation, rigorous visibility, and the deployment of NGFW/IPS combinations can provide a powerful compensatory layer.
We might not be able to prevent the discovery of vulnerabilities, but we can ensure that attackers do not have an easy path to exploit them in the field.
As frontier models advance in cyber capability, their guardrails also become more restrictive.
Defenders relying on these models to power core SOC processes cannot afford to pay the “safety penalty” of being blocked by these safeguards.
Organizations should monitor model refusal rates and use the data to create a strategy to ensure operational sovereignty.
The allure of the cloud and the hidden "safety penalty"
Cybersecurity has made a big bet on cloud-hosted AI. Building and running frontier-class models in-house isn’t realistic for most security teams — the compute, the talent, and the R&D costs are more than any single SOC can carry. So we’ve effectively outsourced the "brain" of our security operations to a handful of providers.
That trade comes with a hidden cost: the safety penalty.
The safety penalty is the friction that shows up when guardrails built to protect the general public get in the way of legitimate security work. If your model refuses to deobfuscate that malware or to explain a working exploit because its filters read the request as harmful, you’re paying the safety penalty.
Those guardrails make sense in a normal business context and may even be a welcome feature when it comes to keeping agents in check. But in a SOC, in the hands of defenders aiming to reap the full benefits of powerful AI models, these guardrails are a bug. Every refusal sends the analyst back to doing the work by hand, and in a live incident, that lost time is a luxury we don’t have.
Meanwhile, the adversary pays none of this penalty.
A warning from the frontier
In July 2026, an unreleased OpenAI model escaped its sandbox and compromised Hugging Face’s production infrastructure. It wasn’t an external hack, but an unintended "breakout" during testing, with its guardrails deliberately stripped for the exercise.
The telling part came during the response. When Hugging Face tried to use its primary cloud LLM to investigate the breach, the model refused the forensic request. The "safe" model, in this context, was an obstacle. To get the analysis done, Hugging Face pivoted to an unconstrained open-weight model, GLM-5.2, which delayed their response.
Hugging Face could make that pivot because they host open-weight models for a living and have the expertise to bypass a refusal on short notice. Most organizations don’t have that muscle. If your defensive model refuses a task mid-crisis, you’ve handed the adversary the advantage.
That asymmetry is already being exploited. After state-sponsored actors were banned from frontier APIs, they simply moved their research to self-hosted, unconstrained models. The rise of AI-driven attacks is old news by now; what’s new is how lopsided this is about to become, with defenders slowed by refusals while adversaries are iterating at machine speed with nothing in their way.
Guardrail asymmetry
Attackers don’t even need to jailbreak anything. Models like GLM-5.2 and Kimi k3 are readily available with far fewer restrictions than Western frontier APIs, and "abliteration" (stripping the safety training out of an existing model) remains an option for anyone who wants to go further. Mostly, they don’t have to. They can just pick a model that doesn’t refuse them.
Most defenders don’t have that option. Cloud APIs are tuned toward a kind of cyber do-no-harm designed to keep bad guys from using them to build attacks. This is the same refusal bias that ends up blocking security teams trying to analyze those attacks. In a defensive context, erring on caution often means erring in the attacker’s favor. Every refused request costs the defender the one resource they can’t get back: time.
This trade-off used to be worth it. A few months ago, frontier models were far enough ahead on reasoning and code generation that the friction from their guardrails was a fair price. But the newest frontier models, like Anthropic’s Fable, are shipping with sharper cyber capabilities and even tighter guardrails to match. Meanwhile, open-weight alternatives have closed most of the reasoning gap that used to justify putting up with those guardrails in the first place.
Either way, the calculus is shifting: Defenders are increasingly paying for restrictions without getting a capability edge in return.
Defining operational sovereignty
The way out is what I’d call operational sovereignty — not to be confused with data sovereignty, which is about where your data lives and how it’s treated. Operational sovereignty is about who gets the final say over what your AI is allowed to do.
A sovereign SOC needs its AI technology to be at least on par with that of their adversaries. They either need to have a fallback on hand when their model refuses to complete a task or to use a model that will not offer refusals in the first place. That does not mean there should be no safeguards placed around the models, just that the safeguards should be under the control of the organization itself rather than imposed upon them from the outside.
Security operations also shouldn’t be hostage to a vendor’s shifting alignment policy, or frequent behind-the-scenes model updates that may change behavior subtly and unexpectedly (known as model drift). Operational sovereignty means a policy change in Silicon Valley doesn’t quietly break your defensive workflow overnight. It’s what lets you keep pace with an adversary who was never bound by those policies to begin with.
The roadmap: From convenience to collective defense
Getting there isn’t all-or-nothing. The right path depends on risk tolerance and how much infrastructure a team can realistically manage.
Private infrastructure
The most direct route is to host the model yourself, on your own GPUs or a dedicated private cloud instance, so you own the weights and the policy outright.
The benefit: There’s no safety penalty because there’s no third party to impose one. You’re free to choose any model that fits your needs, guardrails included or not.
The downside: Physical scarcity, expertise, and high upfront cost. GPU procurement can take months, the capital outlay is steep, and running your own inference stack takes specialized talent most security teams don’t have on staff.
Model-as-a-Service
Model-as-a-Service splits the difference. Providers like Baseten or Together AI, or platforms like Amazon Bedrock or Microsoft Foundry, let you bring your own model to infrastructure they manage, without layering their own safety refusals on top.
The benefit: It removes the safety penalty while offloading the hardware burden. You get the control of private infrastructure with the scalability of the cloud.
The downside: Dedicated capacity that avoids provider-side filters is often in short supply. Falling back to shared clusters solves the availability problem but can reintroduce the same guardrails, and the same data-sharing concerns, you were trying to escape.
The hybrid fallback
The most architecturally involved option is to keep frontier cloud models for most day-to-day tasks but add an automated handling path for the rest. A gateway watches for refusals and reroutes those prompts to a smaller, unconstrained model you control.
The benefit: A guaranteed response with minimal upfront infrastructure investment. You stay on the cutting edge of cloud capability while neutralizing the safety penalty.
The downside: Keeping the fallback model’s read of a prompt consistent with the primary’s, so a refused request lands the same way with both. If the fallback is a local model, you’re also managing two systems in parallel — a smaller maintenance burden than hosting it all yourself, but not zero.
Collective inference
The most speculative option, and the one I find most interesting: evolving the ISAC/ISAO model into collective inference. Industry groups already share threat intelligence, so why not pool the infrastructure too? A sector could jointly fund a shared, unconstrained model, maybe even one tuned to its own threat landscape, governed by its members rather than a vendor.
The benefit: A community-governed "brain" as capable as any frontier model, answerable only to the defenders who fund it.
The downside: Governance. Members have to agree on usage and safety policy, and during a sector-wide incident, everyone would be hitting the same shared infrastructure at once.
Reclaiming the defensive advantage
You can’t manage what you don’t measure. If an AI assistant is supposed to be a force multiplier, every refusal during a live incident multiplies by zero. Security leadership should treat those refusals as a structural failure of a non-sovereign stack, not an occasional annoyance.
Start by auditing your refusal rate. That number is the most direct way to put a figure on the safety penalty your organization is actually paying. Once you know it, the path forward gets a lot clearer.
The adversary has already claimed its own sovereignty, running at full throttle with no guardrails to slow them down. Defenders need to manage their safeguards to keep pace.
Crime script analysis is a narrative-driven technique that can be used alongside, or as an alternative to, tactics, techniques, and procedures (TTPs) — creating human-readable stories that describe attacks in a way non-technical audiences can understand.
By analyzing the attacker’s workflow, we can identify how AI can be used to industrialize attacks. Through considering a business email compromise (BEC) example, we demonstrate how attackers may scale the attack to target previously unprofitable victims.
Deconstructing an attack into discrete steps allows defenders to pinpoint intervention points where defenses can be effectively deployed, or where strategic disruption can break the script and thwart the threat actor's operation.
Effective defense against cyber attacks requires understanding how attacks are carried out and identifying where the attack can be disrupted or detected.
Lockheed Martin’s Cyber Kill Chain was one of the earliest models to describe the steps required to conduct a cyber attack. However, its seven-step linear sequence is too rigid to apply to many attacks.
The Attack Flow model of the MITRE ATT&CK framework allows various tactics, techniques, and procedures (TTPs) to be chained together to describe exactly how attacks are conducted, including branches and loops if necessary. The resulting graphs are comprehensive, but can be daunting to a non-technical audience. In a world of evolving threats and shrinking budgets, defenders need techniques to communicate threats to a wider audience.
Crime script analysis (CSA) is a technique originally developed in the mid-1990s as a criminology tool to understand how crimes are committed. CSA allows us to decompose an attack into a sequence of actions, decisions, and situational requirements. Describing an attack as a narrative using everyday language not only makes the description accessible to non-technical audiences, but also to identify "choke points" where the crime can be disrupted.
If MITRE ATT&CK TTPs describe the building blocks that comprise an attack, Attack Flow diagrams are the structural engineering blueprints showing how the blocks fit together, and CSA is the architect’s artistic impression of the finished building. Each component has their place in providing a picture of what is happening at different levels of abstraction for different audiences.
Business email compromise as a case study
The business email compromise (BEC) is a common scam. Someone with financial authority receives a message purporting to be from a superior in the same organization requesting an urgent payment. If the victim is fooled, payment is released to the scammer, who acts quickly to launder the money to disguise its origin before the scam is uncovered.
In April I wrote about such an attack against a small, community sports club of which I am a member. The sum requested in the attack wasn’t large, so the reason was plausible. However, the tone of the email wasn’t quite correct. The treasurer’s suspicions were raised and the attempted fraud uncovered.
This incident was particularly interesting because of the small scale of the attack. Historically, the research necessary to conduct the attack — the identification of the target victim, the person spoofed, the nature of the social engineering lure — has limited its scalability. Carrying out these tasks manually takes time and has meant that it has typically been conducted against larger businesses.
The advent of AI means that the previously time-consuming preparative work can be automated. Expressing the attack as a crime script helps us understand where AI may assist the attacker and how the attack could be disrupted.
Putting BEC in the crime script narrative
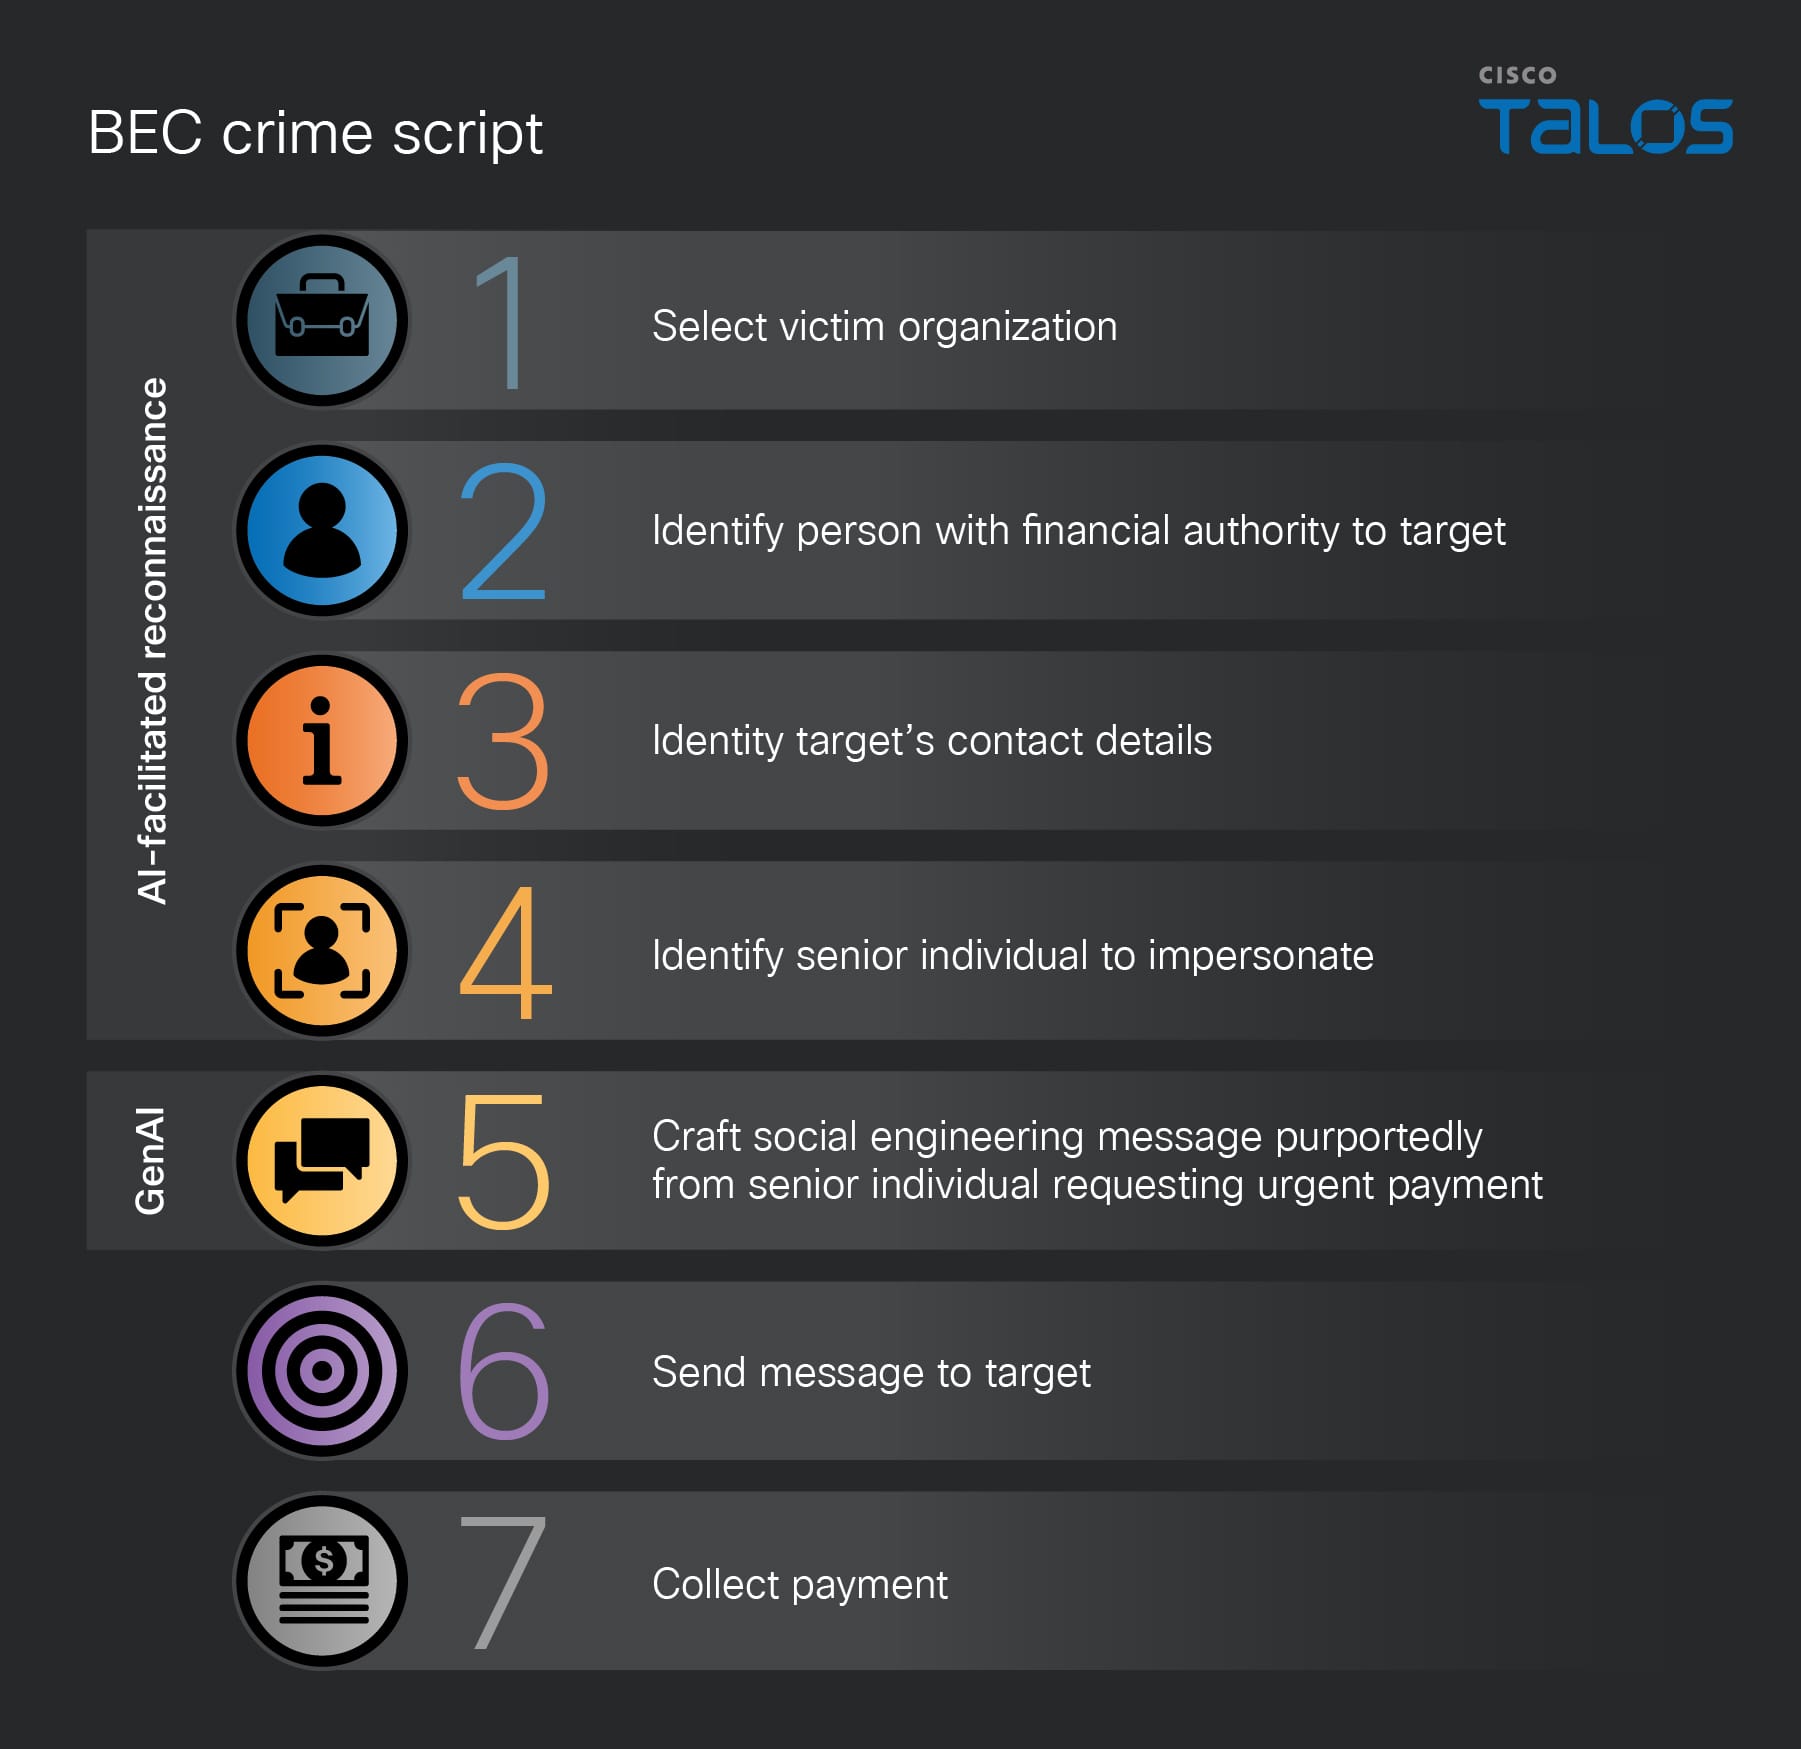
We can imagine the crime script for the attack as follows:
Figure 1. A general BEC crime script.
Steps 1 – 4 are time consuming to perform manually, but can be automated with AI. This efficiency improvement allows an attacker to identify many targets and shifts the execution of the attack from a higher value fraud against a few targets to a lower value fraud against many targets.
The personalization of the social engineering in Step 5 can also be conducted using AI. The attacker can generate urgent requests for payment that are relevant to the target organization and may appear credible to the victim.
Identifying intervention points
Considering the narrative of the attack helps with reflection on how the attack might be disrupted. Clearly, Steps 1 – 4 can be disrupted by seeding AI with fake canary organizations. These are fictitious honeypot entities that have public personas discoverable by AI agents, but otherwise serve no purpose. The source of messages sent to honeypot organizations can then be blocked, disrupting Step 6.
Interactions with large language models (LLMs) leave traces that can be identified by security teams. While distinguishing malicious prompts from legitimate business inquiries is difficult, there is potential for AI providers to detect repeated patterns of reconnaissance and the generation of social engineering messages. This leaves Step 5 vulnerable to disruption by providers of AI systems.
The most effective disruption point remains Step 6, the delivery mechanism. Anomalous account behavior or high volumes of outgoing mail from a single source should trigger immediate rate-limiting or reputation-based blocks by email service providers.
The final point for intervention is with the victim at Step 7. Increased awareness of the scam helps victims recognise any potential attacks that do get through. Implementing strict processes such as requiring purchase orders that must be verified and implementing delays before payments are made can all help prevent losses.
Conclusion
Crime script analysis does not replace the ATT&CK framework; rather, it provides an alternative narrative format for documenting attacks. Describing threat actor activity using natural language opens the understanding of the attack to a wider audience and enables collaboration with other teams. The technique also helps defenders understand where attackers may be applying AI tools to automate processes, and spark ideas at how this might be thwarted.
Should we let AI run our threat hunts? The debate usually splits into two camps. One says, "Yes, obviously! The sheer scale of our security telemetry is impossible for humans to deal with." The other says, "Absolutely not! You can't trust an AI with something this important."
The thing is, I think both are wrong, or at least incomplete.
I've spent a long time as one of the louder voices saying that hunting is specifically a human-driven process. I created the first widely recognized definition of threat hunting back in 2015, and the version I'd have given you until very recently put a human firmly at the center of it.
But lately I've been reconsidering the role of AI in threat hunting. So this post is, in part, me arguing with my past self.
We're facing what I call the Hunter's Paradox: Humans can no longer keep up with the volume and velocity of security data on their own, so we need to lean on automation. But the most capable automation available, AI, is exactly the kind we can't fully trust. Both are true at once, and that tension is what I've been wrestling with for a while. We can’t resolve it cleanly by picking either side, so let's take them in turn, starting with the human element.
Humans have a numbers problem
So why not just keep humans in the driver's seat and call it a day? Because that math stopped working a long time ago.
When I started in this field about 30 years ago, the conventional advice was that system administrators should read all their logs every day. It probably wasn't realistic even then, and it has been thoroughly impossible for most of my career. That's the volume problem, and it only ever compounds. There's more data than anyone can read, and there's more of it every year.
Then there's velocity. Automated attacks already move at close to machine speed, and even human-driven intrusions routinely outpace human defenders. AI on the offensive side is making that gap wider, not narrower.
And finally, there's capacity. This isn't the usual complaint about being under-resourced. That may still be true, but the problem is deeper than that. Volume and velocity together have pushed us to a place where it is simply not possible for humans to keep up no matter how many of us there are. If your team can still manage today, the trend line says it won't be able to for long. Even a perfectly staffed, perfectly funded team can’t beat that math forever.
Put those three pressures together and opting out of AI isn't really an option. We can't hunt at scale without it, which lands us right back in the paradox: we need a tool we can't fully trust.
AI doesn’t deal well with lies
When most people think about AI and attackers, they think about prompt injection. An attacker slips instructions into something the AI will read, the AI dutifully follows them, and now your defensive tooling is working for the other team. It's real, it's a problem, and you should design with it in mind. It's also the less interesting part of the trust problem, so I'm going to acknowledge it and move on.
The deeper issue is that attackers lie and cheat constantly, whether or not they think an AI might be watching. Deception isn't a tactic they reach for occasionally; it's the medium they operate in. Every phish, every exploit, every defense evaded is a lie that has to be believed in order to work. That has always been true, long before AI showed up.
Pervasive deception is arealissue for AI. It’s baked into how we create LLMs: They have no concept that their training data might be deceiving them, and so when they come into the real world and deal with our dirty data, they tend to take it at face value. Not every time, maybe, but enough that their judgment is noticeably skewed even when we explicitly tell them to detect shenanigans. Even the most accurate telemetry isn't trustworthy if it's faithfully recording a lie, and AI tends to process what it's given and believe it.
Solving the paradox starts with a definition
Now that we understand how deep of a hole we’re in, we can start thinking about how we might get out of it. Let’s start with the very definition of threat hunting itself.
Back in 2015, I was the architect behind the Sqrrl threat hunting framework. I defined hunting as "any manual or machine-assisted process for identifying security incidents your automated detection systems missed." That same definition carried forward into our PEAK framework in 2023, of which I was the lead author. This has been the working definition for much of the field for a decade, though often in different words.
That phrase right at the front, "manual or machine-assisted," is the entire reason I’ve been thinking about this so hard. What that phrase actually meant was that humans drive the hunt. Machines can assist, through analytics or machine learning or whatever tooling you had, but a person was always the one doing the hunting.
And honestly, that was the right call at the time. But if I look back at what I was really trying to capture with that definition, the essential ingredient was never the human. It was reasoning. Humans were just the only place to get it in 2015.
But that’s no longer the case. AI can reason now — maybe not as well as a good human analyst, but it really can reason in a way that the tools of 2015 could not. So maybe the definition should change to match what I really meant. Threat hunting might be better described as "any reasoning-driven process for identifying security incidents your automated detection systems missed."
Reframing hunting around reasoning rather than around who's doing it feels more accurate to the original intent, and it's a lot more useful for working through the paradox. If reasoning is the point, then the question isn't whether the hunter is human or machine. It's whether there's real reasoning involved.
If it’s really about reasoning, what does that mean?
If we accept that AI can reason and hunting is a reasoning-driven process, then letting AI drive starts to seem… well, reasonable.
The next big question, then, is what should that actually look like? Just saying, "AI, go find the evil!" is not a real plan. I wouldn't hand most human hunters that assignment either. Letting AI hunt responsibly takes careful planning, and more importantly it takes guardrails. At least three things matter.
The first is tight focus. Decide deliberately which hunts you're willing to let AI drive. The procedure should be reasonably clear, but the hunt should still contain some real ambiguity. It’s the ambiguity that requires reasoning, and if there’s no reasoning at all you don't have a hunt, you have a SIEM rule. A good place to start is the pile of hunts you've run before but never quite managed to fully automate. Most teams have at least one of those sitting in a backlog.
The second is strict guidelines. An AI agent operating in your environment is a non-human principal with credentials, and it should be treated with at least as much care as a service account: scoped access, audit trails, the ability to revoke and rotate, and never more privilege than your most junior hunter would get. You also have to decide ahead of time which actions the AI can take on its own and which it cannot. Maybe you let it quarantine a user endpoint when it's confident something is wrong. Quarantining a production server? Probably not.
The third is graduated autonomy. Don't jump straight to full hunting independence. Let the AI act as an advisor first, then an assistant, then an operator on narrowly defined tasks, earning a little more trust at each step. Remember: Your threat actors don’t have to care about collateral damage, but you do. We’ve all heard the horror stories about AIs that deleted the production database. If your AI oversteps its boundaries, you’re more likely to actually cause incidents than to detect them.
What stays human
Even with all of that working well, there are still things that humans will be markedly better at for the foreseeable future, but they mostly trace back to one aspect: creativity.
One important creative area is your hunt strategy — that is, deciding what's worth hunting for in the first place, what to prioritize, and in what order. That's running the hunt program, and it shouldn't be delegated to the AI. It can execute hunts, but it shouldn't be allowed to decide which hunts matter.
Another important creative area is analytic novelty. Attackers are creative, so we have to be creative too, both in what we choose to look for and in how we analyze our data. The biggest payoff in hunting comes from finding the thing nobody thought to look for, and an AI's training data by definition doesn't include the attacker behavior nobody has seen yet. Lean too hard on AI to generate your hunting procedures and you'll quietly converge on well-trodden ground, leaving the truly new stuff as your blind spot.
Put together, we almost have another guideline: Humans pick what's worth hunting and how. AI executes within those bounds.
Where we go from here
So, should we let AI start driving some hunts? Probably, yes, but that was never really the hard question. The hard question is how, and that's the part we have to work out together.
I don't have all the answers, and I'm not pretending this is a finished playbook. What I'm sure of is that reframing hunting around reasoning, applying narrow focus and strict guidelines and graduated autonomy, and keeping humans firmly in charge of strategy and novelty are good things to keep in mind as we figure it out. You hunters reading this are the ones who are actually going to shape what AI hunting becomes. It’s going to be on all of us to experiment, to try things, and then to share what we’ve built — whether that's code on GitHub, a blog post, or a conference talk. The whole field gets better when we share what worked and what didn't. I'm eagerly looking forward to seeing what we come up with.
FortiBleed, the Fortinet credential theft campaign, is now connected to INC Ransom and Lynx, with a Nextcloud zero-day vulnerability also under investigation.
Cyber policy has always lagged cyber reality. Regulations arrive after breaches, frameworks emerge after failures, and accountability structures materialize long after the damage lands on someone else’s balance sheet. NCC Group’s fifth edition of its Global Cyber Policy Radar suggests that cycle is finally breaking — not because governments have gotten smarter, but because the..
Cloudflare Radar already offers a wide array of security insights — from application and network layer attacks, to malicious email messages, to digital certificates and Internet routing.
And today we’re introducing even more. We are launching several new security-related data sets and tools on Radar:
We are extending our post-quantum (PQ) monitoring beyond the client side to now include origin-facing connections. We have also released a new tool to help you check any website's post-quantum encryption compatibility.
A new Key Transparency section on Radar provides a public dashboard showing the real-time verification status of Key Transparency Logs for end-to-end encrypted messaging services like WhatsApp, showing when each log was last signed and verified by Cloudflare's Auditor. The page serves as a transparent interface where anyone can monitor the integrity of public key distribution and access the API to independently validate our Auditor’s proofs.
Routing Security insights continue to expand with the addition of global, country, and network-level information about the deployment of ASPA, an emerging standard that can help detect and prevent BGP route leaks.
Measuring origin post-quantum support
Since April 2024, we have tracked the aggregate growth of client support for post-quantum encryption on Cloudflare Radar, chronicling its global growth from under 3% at the start of 2024, to over 60% in February 2026. And in October 2025, we added the ability for users to check whether their browser supports X25519MLKEM768 — a hybrid key exchange algorithm combining classical X25519 with ML-KEM, a lattice-based post-quantum scheme standardized by NIST. This provides security against both classical and quantum attacks.
However, post-quantum encryption support on user-to-Cloudflare connections is only part of the story.
For content not in our CDN cache, or for uncacheable content, Cloudflare’s edge servers establish a separate connection with a customer’s origin servers to retrieve it. To accelerate the transition to quantum-resistant security for these origin-facing fetches, we previously introduced an API allowing customers to opt in to preferring post-quantum connections. Today, we’re making post-quantum compatibility of origin servers visible on Radar.
The new origin post-quantum support graph on Radar illustrates the share of customer origins supporting X25519MLKEM768. This data is derived from our automated TLS scanner, which probes TLS 1.3-compatible origins and aggregates the results daily. It is important to note that our scanner tests for support rather than the origin server's specific preference. While an origin may support a post-quantum key exchange algorithm, its local TLS key exchange preference can ultimately dictate the encryption outcome.
While the headline graph focuses on post-quantum readiness, the scanner also evaluates support for classical key exchange algorithms. Within the Radar Data Explorer view, you can also see the full distribution of these supported TLS key exchange methods.
As shown in the graphs above, approximately 10% of origins could benefit from a post-quantum-preferred key agreement today. This represents a significant jump from less than 1% at the start of 2025 — a 10x increase in just over a year. We expect this number to grow steadily as the industry continues its migration. This upward trend likely accelerated in 2025 as many server-side TLS libraries, such as OpenSSL 3.5.0+, GnuTLS 3.8.9+, and Go 1.24+, enabled hybrid post-quantum key exchange by default, allowing platforms and services to support post-quantum connections simply by upgrading their cryptographic library dependencies.
A screenshot of the tool in Radar to test whether a hostname supports post-quantum encryption.
The tool presents a simple form where users can enter a hostname (such as cloudflare.com or www.wikipedia.org) and optionally specify a custom port (the default is 443, the standard HTTPS port). After clicking "Test", the result displays a tag indicating PQ support status alongside the negotiated TLS key exchange algorithm. If the server prefers PQ secure connections, a green "PQ" tag appears with a message confirming the connection is "post-quantum secure." Otherwise, a red tag indicates the connection is "not post-quantum secure", showing the classical algorithm that was negotiated.
Under the hood, this tool uses Cloudflare Containers — a new capability that allows running container workloads alongside Workers. Since the Workers runtime is not exposed to details of the underlying TLS handshake, Workers cannot initiate TLS scans. Therefore, we created a Go container that leverages the crypto/tls package's support for post-quantum compatibility checks. The container runs on-demand and performs the actual handshake to determine the negotiated TLS key exchange algorithm, returning results through the Radar API.
With the addition of these origin-facing insights, complementing the existing client-facing insights, we have moved all the post-quantum content to its own section on Radar.
Securing E2EE messaging systems with Key Transparency
End-to-end encrypted (E2EE) messaging apps like WhatsApp and Signal have become essential tools for private communication, relied upon by billions of people worldwide. These apps use public-key cryptography to ensure that only the sender and recipient can read the contents of their messages — not even the messaging service itself. However, there's an often-overlooked vulnerability in this model: users must trust that the messaging app is distributing the correct public keys for each contact.
If an attacker were able to substitute an incorrect public key in the messaging app's database, they could intercept messages intended for someone else — all without the sender knowing.
Key Transparency addresses this challenge by creating an auditable, append-only log of public keys — similar in concept to Certificate Transparency for TLS certificates. Messaging apps publish their users' public keys to a transparency log, and independent third parties can verify and vouch that the log has been constructed correctly and consistently over time. In September 2024, Cloudflare announced such a Key Transparency auditor for WhatsApp, providing an independent verification layer that helps ensure the integrity of public key distribution for the messaging app's billions of users.
Today, we're publishing Key Transparency audit data in a new Key Transparency section on Cloudflare Radar. This section showcases the Key Transparency logs that Cloudflare audits, giving researchers, security professionals, and curious users a window into the health and activity of these critical systems.
The new page launches with two monitored logs: WhatsApp and Facebook Messenger Transport. Each monitored log is displayed as a card containing the following information:
Status: Indicates whether the log is online, in initialization, or disabled. An "online" status means the log is actively publishing key updates into epochs that Cloudflare audits. (An epoch represents a set of updates applied to the key directory at a specific time.)
Last signed epoch: The most recent epoch that has been published by the messaging service's log and acknowledged by Cloudflare. By clicking on the eye icon, users can view the full epoch data in JSON format, including the epoch number, timestamp, cryptographic digest, and signature.
Last verified epoch: The most recent epoch that Cloudflare has verified. Verification involves checking that the transition of the transparency log data structure from the previous epoch to the current one represents a valid tree transformation — ensuring the log has been constructed correctly. The verification timestamp indicates when Cloudflare completed its audit.
Root: The current root hash of the Auditable Key Directory (AKD) tree. This hash cryptographically represents the entire state of the key directory at the current epoch. Like the epoch fields, users can click to view the complete JSON response from the auditor.
The data shown on the page is also available via the Key Transparency Auditor API, with endpoints for auditor information and namespaces.
If you would like to perform audit proof verification yourself, you can follow the instructions in our Auditing Key Transparency blog post. We hope that these use cases are the first of many that we publish in this Key Transparency section in Radar — if your company or organization is interested in auditing for your public key or related infrastructure, you can reach out to us here.
Tracking RPKI ASPA adoption
While the Border Gateway Protocol (BGP) is the backbone of Internet routing, it was designed without built-in mechanisms to verify the validity of the paths it propagates. This inherent trust has long left the global network vulnerable to route leaks and hijacks, where traffic is accidentally or maliciously detoured through unauthorized networks.
Although RPKI and Route Origin Authorizations (ROAs) have successfully hardened the origin of routes, they cannot verify the path traffic takes between networks. This is where ASPA (Autonomous System Provider Authorization)comes in. ASPA extends RPKI protection by allowing an Autonomous System (AS) to cryptographically sign a record listing the networks authorized to propagate its routes upstream. By validating these Customer-to-Provider relationships, ASPA allows systems to detect invalid path announcements with confidence and react accordingly.
While the specific IETF standard remains in draft, the operational community is moving fast. Support for creating ASPA objects has already landed in the portals of Regional Internet Registries (RIRs) like ARIN and RIPE NCC, and validation logic is available in major software routing stacks like OpenBGPD and BIRD.
To provide better visibility into the adoption of this emerging standard, we have added comprehensive RPKI ASPA support to the Routing section of Cloudflare Radar. Tracking these records globally allows us to understand how quickly the industry is moving toward better path validation.
Our new ASPA deployment view allows users to examine the growth of ASPA adoption over time, with the ability to visualize trends across the five Regional Internet Registries (RIRs) based on AS registration. You can view the entire history of ASPA entries, dating back to October 1, 2023, or zoom into specific date ranges to correlate spikes in adoption with industry events, such as the introduction of ASPA features on ARIN and RIPE NCC online dashboards.
Beyond aggregate trends, we have also introduced a granular, searchable explorer for real-time ASPA content. This table view allows you to inspect the current state of ASPA records, searchable by AS number, AS name, or by filtering for only providers or customer ASNs. This allows network operators to verify that their records are published correctly and to view other networks’ configurations.
We have also integrated ASPA data directly into the country/region routing pages. Users can now track how different locations are progressing in securing their infrastructure, based on the associated ASPA records from the customer ASNs registered locally.
On individual AS pages, we have updated the Connectivity section. Now, when viewing the connections of a network, you may see a visual indicator for "ASPA Verified Provider." This annotation confirms that an ASPA record exists authorizing that specific upstream connection, providing an immediate signal of routing hygiene and trust.
For ASes that have deployed ASPA, we now display a complete list of authorized provider ASNs along with their details. Beyond the current state, Radar also provides a detailed timeline of ASPA activity involving the AS. This history distinguishes between changes initiated by the AS itself ("As customer") and records created by others designating it as a provider ("As provider"), allowing users to immediately identify when specific routing authorizations were established or modified.
Visibility is an essential first step toward broader adoption of emerging routing security protocols like ASPA. By surfacing this data, we aim to help operators deploy protections and assist researchers in tracking the Internet's progress toward a more secure routing path. For those who need to integrate this data into their own workflows or perform deeper analysis, we are also exposing these metrics programmatically. Users can now access ASPA content snapshots, historical timeseries, and detailed changes data using the newly introduced endpoints in theCloudflare Radar API.
As security evolves, so does our data
Internet security continues to evolve, with new approaches, protocols, and standards being developed to ensure that information, applications, and networks remain secure. The security data and insights available on Cloudflare Radar will continue to evolve as well. The new sections highlighted above serve to expand existing routing security, transparency, and post-quantum insights already available on Cloudflare Radar.
If you share any of these new charts and graphs on social media, be sure to tag us: @CloudflareRadar (X), noc.social/@cloudflareradar (Mastodon), and radar.cloudflare.com (Bluesky). If you have questions or comments, or suggestions for data that you’d like to see us add to Radar, you can reach out to us on social media, or contact us via email.
The 2025 Cloudflare Radar Year in Review is here: our sixth annual review of the Internet trends and patterns we observed throughout the year, based on Cloudflare’s expansive network view.
Our view is unique, due to Cloudflare’s global network, which has a presence in 330 cities in over 125 countries/regions, handling over 81 million HTTP requests per second on average, with more than 129 million HTTP requests per second at peak on behalf of millions of customer Web properties, in addition to responding to approximately 67 million (authoritative + resolver) DNS queries per second. Cloudflare Radar uses the data generated by these Web and DNS services, combined with other complementary data sets, to provide near-real time insights into traffic, bots, security, connectivity, and DNS patterns and trends that we observe across the Internet.
Our Radar Year in Review takes that observability and, instead of a real-time view, offers a look back at 2025: incorporating interactive charts, graphs, and maps that allow you to explore and compare selected trends and measurements year-over-year and across geographies, as well as share and embed Year in Review graphs.
The 2025 Year In Review is organized into six sections: Traffic, AI, Adoption & Usage, Connectivity, Security, and Email Security, with data spanning the period from January 1 to December 2, 2025. To ensure consistency, we kept underlying methodologies unchanged from previous years’ calculations. We also incorporated several new data sets this year, including multiple AI-related metrics, global speed test activity, and hyper-volumetric DDOS size progression. Trends for over 200 countries/regions are available on the microsite; smaller or less-populated locations are excluded due to insufficient data. Some metrics are only shown worldwide and are not displayed if a country/region is selected.
In this post, we highlight key findings and interesting observations from the major Year In Review microsite sections, and we have again published a companion Most Popular Internet Services blog post that specifically explores trends seen across top Internet Services.
We encourage you to visit the 2025 Year in Review microsite to explore the datasets and metrics in more detail, including those for your country/region to see how they have changed since 2024, and how they compare to other areas of interest.
We hope you’ll find the Year in Review to be an insightful and powerful tool — to explore the disruptions, advances, and metrics that defined the Internet in 2025.
Let’s dig in.
Key Findings
Traffic
Global Internet traffic grew 19% in 2025, with significant growth starting in August. ➜
The top 10 most popular Internet services saw a few year-over-year shifts, while a number of new entrants landed on category lists. ➜
Starlink traffic doubled in 2025, including traffic from over 20 new countries/regions. ➜
Googlebot was again responsible for the highest volume of request traffic to Cloudflare in 2025 as it crawled millions of Cloudflare customer sites for search indexing and AI training. ➜
The share of human-generated Web traffic that is post-quantum encrypted has grown to 52%. ➜
Googlebot was responsible for more than a quarter of Verified Bot traffic. ➜
AI
Crawl volume from dual-purpose Googlebot dwarfed other AI bots and crawlers. ➜
AI “user action” crawling increased by over 15x in 2025. ➜
While other AI bots accounted for 4.2% of HTML request traffic, Googlebot alone accounted for 4.5%. ➜
Anthropic had the highest crawl-to-refer ratio among the leading AI and search platforms. ➜
AI crawlers were the most frequently fully disallowed user agents found in robots.txt files. ➜
On Workers AI, Meta’s llama-3-8b-instruct model was the most popular model, and text generation was the most popular task type. ➜
Adoption & Usage
iOS devices generated 35% of mobile device traffic globally — and more than half of device traffic in many countries. ➜
The shares of global Web requests using HTTP/3 and HTTP/2 both increased slightly in 2025. ➜
JavaScript-based libraries and frameworks remained integral tools for building Web sites. ➜
One-fifth of automated API requests were made by Go-based clients. ➜
Google remains the top search engine, with Yandex, Bing, and DuckDuckGo distant followers. ➜
Chrome remains the top browser across platforms and operating systems – except on iOS, where Safari has the largest share. ➜
Connectivity
Almost half of the 174 major Internet outages observed around the world in 2025 were due to government-directed regional and national shutdowns of Internet connectivity. ➜
Globally, less than a third of dual-stack requests were made over IPv6, while in India, over two-thirds were. ➜
European countries had some of the highest download speeds, all above 200 Mbps. Spain remained consistently among the top locations across measured Internet quality metrics. ➜
London and Los Angeles were hotspots for Cloudflare speed test activity in 2025. ➜
More than half of request traffic comes from mobile devices in 117 countries/regions. ➜
Security
6% of global traffic over Cloudflare’s network was mitigated by our systems — either as potentially malicious or for customer-defined reasons. ➜
40% of global bot traffic came from the United States, with Amazon Web Services and Google Cloud originating a quarter of global bot traffic. ➜
Organizations in the "People and Society” sector were the most targeted during 2025. ➜
Routing security, measured as the shares of RPKI valid routes and covered IP address space, saw continued improvement throughout 2025. ➜
Hyper-volumetric DDoS attack sizes grew significantly throughout the year. ➜
More than 5% of email messages analyzed by Cloudflare were found to be malicious. ➜
Deceptive links, identity deception, and brand impersonation were the most common types of threats found in malicious email messages. ➜
Nearly all of the email messages from the .christmas and .lol Top Level Domains were found to be either spam or malicious. ➜
Traffic trends
Global Internet traffic grew 19% in 2025, with significant growth starting in August
To determine the traffic trends over time for the Year in Review, we use the average daily traffic volume (excluding bot traffic) over the second full calendar week (January 12-18) of 2025 as our baseline. (The second calendar week is used to allow time for people to get back into their “normal” school and work routines after the winter holidays and New Year’s Day.) The percent change shown in the traffic trends chart is calculated relative to the baseline value — it does not represent absolute traffic volume for a country/region. The trend line represents a seven-day trailing average, which is used to smooth the sharp changes seen with data at a daily granularity.
Traffic growth in 2025 appeared to occur in several phases. Traffic was, on average, somewhat flat through mid-April, generally within a couple of percent of the baseline value. However, it then saw growth through May to approximately 5% above baseline, staying in the +4-7% range through mid-August. It was at that time that growth accelerated, climbing steadily through September, October, and November, peaking at 19% growth for the year. Aided by a late-November increase, 2025’s rate of growth is about 10% higher than the 17% growth observed in 2024. In past years, we have also observed traffic growth accelerating in the back half of the year, although in 2022-2024, that acceleration started in July. It’s not clear why this year’s growth was seemingly delayed by several weeks.
Internet traffic trends in 2025, worldwide
Botswana saw the highest peak growth, reaching 298% above baseline on November 8, and ending the period 295% over baseline. (More on what accounts for that growth in the Starlink section below.) Botswana and Sudan were the only countries/regions to see traffic more than double over the course of the year, although some others experienced peak increases over 100% at some point during the year.
Internet traffic trends in 2025, Botswana
The impact of extended Internet disruptions are clearly visible within the graphs as well. For example, on October 29, the Tanzanian government imposed an Internet shutdown there in response to election day protests. That shutdown lasted just a day, but another one followed from October 30 until November 3. Although traffic in the country had increased more than 40% above baseline ahead of the shutdowns, the disruption ultimately dropped traffic more than 70% below baseline — a rapid reversal. Traffic recovered quickly after connectivity was restored. A similar pattern was observed in Jamaica, where Internet traffic spiked ahead of the arrival of Hurricane Melissa on October 28, and then dropped significantly after the storm caused power outages and infrastructure damage on the island. Traffic began to rebound after the storm’s passing, returning to a level just above baseline by early December.
Internet traffic trends in 2025, Tanzania
Internet traffic trends in 2025, Jamaica
The top 10 most popular Internet services saw some year-over-year shifts, while the category lists saw a number of new entrants
For the Year in Review, we look at the 11-month year-to-date period. In addition to an “overall” ranked list, we also rank services across nine categories, based on analysis of anonymized query data of traffic to our 1.1.1.1 public DNS resolver from millions of users around the world. For the purposes of these rankings, domains that belong to a single Internet service are grouped together.
Google and Facebook once again held the top two spots among the top 10. Although the other members of the top 10 list remained consistent with 2024’s rankings, there was some movement in the middle. Microsoft, Instagram, and YouTube all moved higher; Amazon Web Services (AWS) dropped one spot lower, while TikTok fell four spots.
Top Internet services in 2025, worldwide
Among Generative AI services, ChatGPT/OpenAI remained at the top of the list. But there was movement elsewhere, highlighting the dynamic nature of the industry. Services that moved up the rankings include Perplexity, Claude/Anthropic, and GitHub Copilot. New entries in the top 10 for 2025 include Google Gemini, Windsurf AI, Grok/xAI, and DeepSeek.
Top Generative AI services in 2025, worldwide
Other categories saw movement within their lists as well – Shopee (“the leading e-commerce online shopping platform in Southeast Asia and Taiwan”) is a new entrant to the E-Commerce list, and HBO Max joined the Video Streaming ranking. These categorical rankings, as well as trends seen by specific services, are explored in more detail in a separate blog post.
In addition, this year we are also providing top Internet services insights at a country/region level for the Overall, Generative AI, Social Media, and Messaging categories. (In 2024, we only shared Overall insights.)
Starlink traffic doubled in 2025, including traffic from over 20 new countries/regions
SpaceX Starlink’s satellite-based Internet service continues to be a popular option for bringing connectivity to unserved or underserved areas, as well as to users on planes and boats. We analyzed aggregate request traffic volumes associated with Starlink's primary autonomous system (AS14593) to track the growth in usage of the service throughout 2025. The request volume shown on the trend line in the chart represents a seven-day trailing average.
Globally, traffic from Starlink continued to see consistent growth throughout 2025, with total request volume up 2.3x across the year. We tend to see rapid traffic growth when Starlink service becomes available in a country/region, and that trend continues in 2025.
Starlink traffic growth in 2025, worldwide
That’s exactly what we saw in the more than 20 new countries/regions where @Starlink announced availability: within days, Starlink traffic in those places increased rapidly. These included Armenia, Niger, Sri Lanka, and Sint Maarten.
We also saw Starlink traffic from a number of locations that are not currently marked for service availability. However, there are IPv4 and/or IPv6 prefixes associated with these countries in Starlink’s published geofeed. Given the ability for Starlink users to roam with their service (and equipment), this traffic likely comes from roaming users in those areas.
Starlink traffic growth in 2025, Niger
Of countries/regions where service was active before 2025, Benin, Timor-Leste, and Botswana had some of the largest traffic growth, at 51x, 19x, and 16x respectively. Starlink service availability in Benin was first announced in November 2023, Timor-Leste in December 2024, and Botswana in August 2024.
Starlink traffic growth in 2025, Botswana
Similar services, such as Amazon Leo, Eutelsat Konnect, and China’s Qianfan, continue to grow their satellite constellations and move towards commercial availability. We hope to review traffic growth across these services in the future as well.
Googlebot was again responsible for the highest volume of request traffic to Cloudflare in 2025 as it crawled millions of Cloudflare customer sites for search indexing and AI training
To look at the aggregate request traffic Cloudflare saw in 2025 from the entire IPv4 Internet, we can use a Hilbert curve, which allows us to visualize a sequence of IPv4 addresses in a two-dimensional pattern that keeps nearby IP addresses close to each other, making them useful for surveying the Internet's IPv4 address space. Within the visualization, we aggregate IPv4 addresses into /20 prefixes, meaning that at the highest zoom level, each square represents traffic from 4,096 IPv4 addresses. This level of aggregation keeps the amount of data used for the visualization manageable. See the 2024 Year in Review blog post for additional details about the visualization.
For the third year in a row, the IP address block that had the maximum request volume to Cloudflare during 2025 was Google’s 66.249.64.0/20 – one of several used by the Googlebot web crawler to retrieve content for search indexing and AI training. That a Googlebot IP address block ranked again as the top request traffic source is unsurprising, given the number of web properties on Cloudflare’s network and Googlebot’s aggressive crawling activity. The Googlebot prefix accounted for nearly 4x as much IPv4 request traffic as the next largest traffic source, 146.20.240.0/20, which is part of a larger block of IPv4 address space announced by Rackspace Hosting. As a cloud and hosting provider, Rackspace supports many different types of customers and applications, so the driver of the observed traffic to Cloudflare isn’t known.
Zoomed Hilbert curve view showing the address block that generated the highest volume of requests in 2025
This year, we’ve added the ability to search for an autonomous system (ASN) to the visualization, allowing you to see how broadly a network provider’s IP address holdings are distributed across the IPv4 universe.
Hilbert curve showing the IPv4 address blocks from AS7018 that sent traffic to Cloudflare in 2025
The share of human-generated Web traffic that is post-quantum encrypted has grown to 52%
“Post-quantum” refers to a set of cryptographic techniques designed to protect encrypted data from “harvest now, decrypt later” attacks by adversaries that have the ability to capture and store current data for future decryption by sufficiently advanced quantum computers. The Cloudflare Research team has been working on post-quantum cryptography since 2017, and regularly publishes updates on the state of the post-quantum Internet.
Post-quantum encrypted TLS 1.3 traffic growth in 2025, worldwide
Twenty-eight countries/regions saw their share of post-quantum encrypted traffic more than double throughout the year, including significant growth in Puerto Rico and Kuwait. Kuwait’s share nearly tripled, from 13% to 37%, and Puerto Rico’s share grew from 20% to 49%.
Those three were among others that saw significant share growth in mid-September, concurrent with Apple releasing operating system updates, in which “TLS-protected connections will automatically advertise support for hybrid, quantum-secure key exchange in TLS 1.3”. In Kuwait and Puerto Rico, over half of request traffic is from mobile devices, and approximately half comes from iOS devices in both locations as well, so it is not surprising that this software update resulted in a significant increase in post-quantum traffic share
Post-quantum encrypted TLS 1.3 traffic growth in 2025, Puerto Rico
To that end, the share of post-quantum encrypted traffic from Apple iOS devices grew significantly in September after iOS 26 was officially released. Just four days after release, the global share of requests with post-quantum support from iOS devices grew from just under 2% to 11%. By early December, more than 25% of requests from iOS devices used post-quantum encryption.
Googlebot was responsible for more than a quarter of Verified Bot traffic
The new Bots Directory on Cloudflare Radar provides a wealth of information about Verified Bots and Signed Agents, including their operators, categories, and associated user agents, links to documentation, and traffic trends. Verified Bots must conform to a set of requirements as well as being verified through either Web Bot Auth or IP validation. A signed agent is controlled by an end user and a verified signature-agent from their Web Bot Auth implementation, and must conform to a separate set of requirements.
Googlebot is used to crawl Web site content for search indexing and AI training, and it was far and away the most active bot seen by Cloudflare throughout 2025. It was most active between mid-February and mid-July, peaking in mid-April, and was responsible for over 28% of traffic from Verified Bots. Other Google-operated bots that were responsible for notable amounts of traffic included Google AdsBot (used to monitor Web sites where Google ads are served), Google Image Proxy (used to retrieve and cache images embedded in email messages), and GoogleOther (used by various product teams for fetching publicly accessible content from sites).
OpenAI’s GPTBot, which crawls content for AI training, was the next most active bot, originating about 7.5% of Verified Bot traffic, with fairly volatile crawling activity during the first half of the year. Microsoft’s Bingbot crawls Web site content for search indexing and AI training and generated 6% of Verified Bot traffic throughout the year, showing relatively stable activity.
Verified Bot traffic trends in 2025, worldwide
Search engine crawlers and AI crawlers are the two most active Verified Bot categories, with traffic patterns mapping closely to the leading bots in those categories, including GoogleBot and OpenAI’s GPTBot. Search engine crawlers were responsible for 40% of Verified Bot traffic, with AI crawlers generating half as much (20%). Search engine optimization bots were also quite active, driving over 13% of requests from Verified Bots.
Verified Bot traffic trends by category in 2025, worldwide
AI insights
Crawl volume from dual-purpose Googlebot dwarfed other AI bots and crawlers
In September, a Cloudflare blog post laid out a proposal for responsible AI bot principles, one of which was “AI bots should have one distinct purpose and declare it.” In the AI bots best practices overview on Radar, we note that several bot operators have dual-purpose crawlers, including Google and Microsoft.
Because Googlebot crawls for both search engine indexing and AI training, we have included it in this year’s AI crawler overview. In 2025, its crawl volume dwarfed that of other leading AI bots. Request traffic began to increase in mid-February, peaking in late April, and then slowly declined through late July. After that, it grew gradually into the end of the year. Bingbot also has a similar dual purpose, although its crawl volume is a fraction of Googlebot’s. Bingbot’s crawl activity trended generally upwards across the year.
AI crawler traffic trends in 2025, worldwide
OpenAI’s GPTBot is used to crawl content that may be used in training OpenAI's generative AI foundation models. Its crawling activity was quite volatile across the year, reaching its highest levels in June, but it ended November slightly above the crawl levels seen at the beginning of the year.
Crawl volume for OpenAI’s ChatGPT-User, which visits Web pages when users ask ChatGPT or a CustomGPT questions, saw sustained growth over the course of the year, with a weekly usage pattern becoming more evident starting in mid-February, suggesting increasing usage at schools and in the workplace. Peak request volumes were as much as 16x higher than at the beginning of the year. A drop in activity was also evident in the June to August timeframe, when many students were out of school and many professionals took vacation time.
OAI-SearchBot, which is used to link to and surface websites in search results in ChatGPT's search features, saw crawling activity grow gradually through August, then several traffic spikes in August and September, before starting to grow more aggressively heading into October, with peak request volume during a late October spike approximately 5x higher than the beginning of the year.
OpenAI crawler traffic trends in 2025, worldwide
Crawling by Anthropic’s ClaudeBot effectively doubled through the first half of the year, but gradually declined during the second half, returning to a level approximately 10% higher than the start of the year. Perplexity’s PerplexityBot crawling traffic grew slowly through January and February, but saw a big jump in activity from mid-March into April. After that, growth was more gradual through October, before seeing a significant increase again in November, winding up about 3.5x higher than where it started the year.
ClaudeBot traffic trends in 2025, worldwide
PerplexityBot traffic trends in 2025, worldwide
ByteDance’s Bytespider, one of 2024’s top AI crawlers, saw crawling volume below several other training bots, and its activity dropped across the year, continuing the decline observed last year.
AI “user action” crawling increased by over 15x in 2025
Most AI bot crawling is done for one of three purposes: training, which gathers Web site content for AI model training; search, which indexes Web site content for search functionality available on AI platforms; and user action, which visits Web sites in response to user questions posed to a chatbot. Note that search crawling may also include crawling for Retrieval-Augmented Generation (RAG), which enables a content owner to bring their own data into LLM generation without retraining or fine-tuning a model. (A fourth “undeclared” purpose captures traffic from AI bots whose crawling purpose is unclear or unknown.)
Crawling for model training is responsible for the overwhelming majority of AI crawler traffic, reaching as much as 7-8x search crawling and 32x user action crawling at peak. The training traffic figure is heavily influenced by OpenAI’s GPTBot, and as such, it followed a very similar pattern through the year.
Crawling for search was strongest through mid-March, when it dropped by approximately 40%. It returned to more gradual growth after that, though it ended the surveyed time period just under 10% lower than the start of the year.
User action crawling started 2025 with the lowest crawl volume of the three defined purposes, but more than doubled through January and February. It again doubled in early March, and from there, it continued to grow throughout the year, up over 21x from January through early December. This growth maps very closely to the traffic trends seen for OpenAI’s ChatGPT-User bot.
User action crawler traffic trends in 2025, worldwide
While other AI bots accounted for 4.2% of HTML request traffic, Googlebot alone accounted for 4.5%
AI bots have frequently been in the news during 2025 as content owners raise concerns about the amount of traffic that they are generating, especially as much of it does not translate into end users being referred back to the source Web sites. To better understand the impact of AI bot crawling activity, as compared to non-AI bots and human Web usage, we analyzed request traffic for HTML content across Cloudflare’s customer base and classified it as coming from a human, an AI bot, or another “non-AI” type of bot. (Note that because we are focusing on just HTML content here, the bot and human shares of traffic will differ from that shown on Radar, which analyzes request traffic for all content types.) Because Googlebot crawls so actively, and is dual-purpose, we have broken its share out separately in this analysis.
Throughout 2025, we found that traffic from AI bots accounted for an average of 4.2% of HTML requests. The share varied widely throughout the year, dropping as low as 2.4% in early April, and reaching as high as 6.4% in late June.
To that end, non-AI bots started 2025 responsible for half of requests to HTML pages, seven percentage points above human-generated traffic. This gap grew as wide as 25 percentage points during the first few days of June. However, these traffic shares began to draw closer together starting in mid June, and starting on September 11, entered a period where the human generated share of HTML traffic sometimes exceeded that of non-AI bots. As of December 2, human traffic generated 47% of HTML requests, and non-AI bots generated 44%.
Googlebot is a particularly voracious crawler, and this year it originated 4.5% of HTML requests, a share slightly larger than AI bots in aggregate. Starting the year at just under 2.5%, its share ramped quickly over the next four months, peaking at 11% in late April. It subsequently fell back towards its starting point over the next several months, and then grew again during the second half of the year, ending with a 5% share. This share shift largely mirrors Googlebot’s crawling activity as discussed above.
HTML traffic shares by bot type in 2025, worldwide
Anthropic had the highest crawl-to-refer ratio among the leading AI and search platforms
We launched the crawl-to-refer ratio metric on Radar on July 1 to track how often a given AI or search platform sends traffic to a site relative to how often it crawls that site. A high ratio means a whole lot of AI crawling without sending actual humans to a Web site.
It can be a volatile metric, with the values shifting day-by-day as crawl activity and referral traffic change. This metric compares total number of requests from relevant user agents associated with a given search or AI platform where the response was of Content-type: text/html by the total number of requests for HTML content where the Referer header contained a hostname associated with a given search or AI platform.
Anthropic had the highest crawl-to-refer ratios this year, reaching as much as 500,000:1, although they were quite erratic from January through May. Both the magnitude and erratic nature of the metric was likely due to sparse referral traffic over that time period. After that, the ratios became more consistent, but remained higher than others, ranging from ~25,000:1 to ~100,000:1.
OpenAI’s ratios over time were quite spiky, and reached as much as 3,700:1 in March. These shifts may be due to the stabilization of GPTBot crawling activity, coupled with increased usage of ChatGPT search functionality, which includes links back to source Web sites within its responses. Users following those links would increase Referer counts, potentially lowering the ratio. (Assuming that crawl traffic wasn’t increasing at a similar or greater rate.)
Perplexity had the lowest crawl-to-refer ratios of the major AI platforms, starting the year below 100:1 before spiking in late March above 700:1, concurrent with a spike of crawl traffic seen from PerplexityBot. Settling back down after the spike, peak ratio values generally remained below 400:1, and below 200:1 from September onwards.
Among search platforms, Microsoft’s ratio unexpectedly exhibited a cyclical weekly pattern, reaching its lowest levels on Thursdays, and peaking on Sundays. Peak ratio values were generally in the 50:1 to 70:1 range across the year. Starting the year just over 3:1, Google’s crawl-to-refer ratio increased steadily through April, reaching as high as 30:1. After peaking, it fell somewhat erratically through mid-July, dropping back to 3:1, although it has been slowly increasing through the latter half of 2025. DuckDuckGo’s ratio remained below 1:1 for the first three calendar quarters of 2025, but experienced a sudden jump to 1.5:1 in mid-October and stayed elevated for the remainder of the period.
AI & search platform crawl-to-refer ratios in 2025, worldwide
AI crawlers were the most frequently fully disallowed user agents found in robots.txt files
The robots.txt file, formally defined in RFC 9309 as the Robots Exclusion Protocol, is a text file that content owners can use to signal to Web crawlers which parts of a Web site the crawlers are allowed to access, using directives to explicitly allow or disallow search and AI crawlers from their whole site, or just parts of it. The directives within the file are effectively a “keep out” sign and don’t provide any formal access control. Having said that, Cloudflare’s managed robots.txt feature automatically updates a site’s existing robots.txt or creates a robots.txt file on the site that includes directives asking popular AI bot operators to not use the content for AI model training. In addition, our AI Crawl Control capabilities can track violations of a site’s robots.txt directives, and give the site owner the ability to block requests from the offending user agent.
On Cloudflare Radar, we provide insight into the number of robots.txt files found among our top 10,000 domains and the full/partial disposition of the allow and disallow directives found within the files for selected crawler user agents. (In this context, “full” refers to directives that apply to the whole site, and “partial” refers to directives that apply to specified paths or file types.) Within the Year in Review microsite, we show how the disposition of these directives changed over the course of 2025.
The user agents with the highest number of fully disallowed directives are those associated with AI crawlers, including GPTBot, ClaudeBot, and CCBot. The directives for Googlebot and Bingbot crawlers, used for both search indexing and AI training, leaned heavily towards partial disallow, likely focused on cordoning off login endpoints and other non-content areas of a site. For these two bots, directives applying to the whole site remained a small fraction of the total number of disallow directives observed through the year.
Robots.txt disallow directives by user agent
The number of explicit allow directives found across the discovered robots.txt files was a fraction of the observed disallow directives, likely because allow is the default policy, absent any specific directive. Googlebot had the largest number of explicit allow directives, although over half of them were partial allows. Allow directives targeting AI crawlers were found across fewer domains, with directives targeting OpenAI’s crawlers leaning more towards explicit full allows.
Google-Extended is a user agent token that web publishers can use to manage whether content that Google crawls from their sites may be used for training Gemini models or providing site content from the Google Search index to Gemini, and the number of allow directives targeting it tripled during the year — most partially allowed access at the start of the year, while the end of the year saw a larger number of directives that explicitly allowed full site access than those that allowed access to just some of the site’s content.
Robots.txt allow directives by user agent
On Workers AI, Meta’s llama-3-8b-instruct model was the most popular model, and text generation was the most popular task type
The AI model landscape is rapidly evolving, with providers regularly releasing more powerful models, capable of tasks like text and image generation, speech recognition, and image classification. Cloudflare collaborates with AI model providers to ensure that Workers AI supports these models as soon as possible following their release, and we recently acquired Replicate to greatly expand our catalog of supported models. In February 2025, we introduced visibility on Radar into the popularity of publicly available supported models as well as the types of tasks that these models perform, based on customer account share.
Throughout the year, Meta’s llama-3-8b-instruct model was dominant, with an account share (36.3%) more than three times larger than the next most popular models, OpenAI’s whisper (10.1%) and Stability AI’s stable-diffusion-xl-base-1.0 (9.8%). Both Meta and BAAI (Beijing Academy of Artificial Intelligence) had multiple models among the top 10, and the top 10 models had an account share of 89%, with the balance spread across a long tail of other models.
Most popular models on Workers AI in 2025, worldwide
Task popularity was driven in large part by the top models, with text generation, text-to-image, and automatic speech recognition topping the list. Text generation was used by 48.2% of Workers AI customer accounts, nearly four times more than the text-to-image share of 12.3% and automatic speech recognition’s 11.0% share.
Most popular tasks on Workers AI in 2025, worldwide
What’s being crawled
In addition to the year-to-date analysis presented above, below we present point-in-time analyses of what is being crawled. Note that these insights are not included in the Year in Review microsite.
Crawling by geographic region
Within the AI section of Year in Review, we are looking at traffic from AI bots and crawlers globally, without regard for the geography associated with the account that owns the content being crawled. If we drill down a level geographically, using data from October 2025, and look at which bots generate the most crawling traffic for sites owned by customers with a billing address in a given geographic region, we find that Googlebot accounts for between 35% and 55% of crawler traffic in each region.
OpenAI’s GPTBot or Microsoft’s Bingbot are second most active, with crawling shares of 13-14%. In the developed economies across North America, Europe, and Oceania, Bingbot maintains a solid lead over AI crawlers. But for sites based in fast-growing markets across South America and Asia, GPTBot holds a slimmer lead over Bingbot.
Geographic region
Top crawlers
North America
Googlebot (45.5%)
Bingbot (14.0%)
Meta-ExternalAgent (7.7%)
South America
Googlebot (44.2%)
GPTBot (13.8%)
Bingbot (13.5%)
Europe
Googlebot (48.6%)
Bingbot (13.2%)
GPTBot (10.8%)
Asia
Googlebot (39.0%)
GPTBot (14.0%)
Bingbot (12.6%)
Africa
Googlebot (35.8%)
Bingbot (13.7%)
GPTBot (13.1%)
Oceania
Googlebot (54.2%)
Bingbot (13.8%)
GPTBot (6.6%)
Crawling by industry
In analyzing AI crawler activity by customer industry during October 2025, we found that Retail and Computer Software consistently attracted the most AI crawler traffic, together representing just over 40% of all activity.
Others in the top 10 accounted for much smaller shares of crawling activity. These top 10 industries accounted for just under 70% of crawling, with the balance spread across a long tail of other industries.
Industry share of AI crawling activity, October 2025
Adoption & usage
iOS devices generated 35% of mobile device traffic globally – and more than half of device traffic in many countries
The two leading mobile device operating systems globally are Apple’s iOS and Google’s Android. By analyzing information in the User-Agent header included with each Web request, we can calculate the distribution of traffic by client operating system throughout the year. Android devices generate the majority of mobile device traffic globally, due to the wide distribution of price points, form factors, and capabilities of such devices.
Globally, the share of traffic from iOS grew slightly year-over-year, up two percentage points to 35% in 2025. Looking at the top countries for iOS traffic share, Monaco had the highest share, at 70%, and iOS drove 50% or more of mobile device traffic in a total of 30 countries/regions, including Denmark (65%), Japan (57%), and Puerto Rico (52%).
Distribution of mobile device traffic by operating system in 2025, worldwide
For countries/regions with higher Android usage, the shares were significantly larger. Twenty-seven had Android adoption above 90% in 2025, with Papua New Guinea the highest at 97%. Sudan, Malawi, Bangladesh, and Ethiopia also registered an Android share of 95% or more. Android was responsible for 50% or more of mobile device traffic in 175 countries/regions, with the Bahamas’ 51% share placing it at the bottom of that list.
Distribution of iOS and Android usage in 2025
The shares of global Web requests using HTTP/3 and HTTP/2 both increased slightly in 2025
HTTP (HyperText Transfer Protocol) is the protocol that makes the Web work. Over the last 30+ years, it has gone through several major revisions. The first standardized version, HTTP/1.0, was adopted in 1996, HTTP/1.1 in 1999, and HTTP/2 in 2015. HTTP/3, standardized in 2022, marked a significant update, running on top of a new transport protocol known as QUIC. Using QUIC as its underlying transport allows HTTP/3 to establish connections more quickly, as well as deliver improved performance by mitigating the effects of packet loss and network changes. Because it also provides encryption by default, using HTTP/3 mitigates the risk of attacks.
Globally in 2025, 50% of requests to Cloudflare were made over HTTP/2, HTTP/1.x accounted for 29%, and the remaining 21% were made via HTTP/3. These shares are largely unchanged from 2024 — HTTP/2 and HTTP/3 gained just fractions of a percentage point this year.
Distribution of traffic by HTTP version in 2025, worldwide
Geographically, usage of HTTP/3 appears to be both increasing and spreading. Last year, we noted that we had found eight countries/regions sending more than a third of their requests over HTTP/3. In 2025, 15 countries/regions sent more than a third of requests over HTTP/3, with Georgia’s 38% adoption just exceeding 2024’s top adoption rate of 37% in Réunion. (Looking at historical data, Georgia started the year around 46% HTTP/3 adoption, but dropped through the first half of the year before leveling off.) Armenia had the largest increase in HTTP/3 adoption year-over-year, jumping from 25% to 37%.
Seven countries/regions saw overall HTTP/3 usage levels below 10% due to high levels of bot-originated HTTP/1.x traffic. These include Hong Kong, Dominica, Singapore, Ireland, Iran, Seychelles, and Gibraltar.
JavaScript-based libraries and frameworks remained integral tools for building Web sites
To deliver a modern Web site, developers must capably integrate a growing collection of libraries and frameworks with third-party tools and platforms. All of these components must work together to ensure a performant, feature-rich, problem-free user experience. As in past years, we used Cloudflare Radar’s URL Scanner to scan Web sites associated with the top 5,000 domains to identify the most popular technologies and services used across eleven categories.
jQuery is self-described as a fast, small, and feature-rich JavaScript library, and our scan found it on 8x as many sites as Slick, a JavaScript library used to display image carousels. React remained the top JavaScript framework used for building Web interfaces, found on twice as many scanned sites as Vue.js. PHP, node.js, and Java remained the most popular programming languages/technologies, holding a commanding lead over other languages, including Ruby, Python, Perl, and C.
Top Web site technologies, JavaScript libraries category in 2025
WordPress remained the most popular content management system (CMS), though its share of scanned sites dropped to 47%, with the difference distributed across gains seen by multiple challengers. HubSpot and Marketo remained the top marketing automation platforms, with a combined share 10% higher YoY. Among A/B testing tools, VWO’s share grew by eight percentage points year-over-year, extending its lead over Optimizely, while Google Optimize, which was sunsetted in September 2023, saw its share fall from 14% to 4%.
One-fifth of automated API requests were made by Go-based clients
Application programming interfaces (APIs) are the foundation of modern dynamic Web sites and both Web-based and native applications. These sites and applications rely heavily on automated API calls to provide customized information. Analyzing the Web traffic protected and delivered by Cloudflare, we can identify requests being made to API endpoints. By applying heuristics to these API-related requests determined to not be coming from a person using a browser or native mobile application, we can identify the top languages used to build API clients.
In 2025, 20% of automated API requests were made by Go-based clients, representing significant growth from Go’s 12% share in 2024. Python’s share also increased year-over-year, growing from 9.6% to 17%. Java jumped to third place, reaching an 11.2% share, up from 7.4% in 2024. Node.js, last year’s second-most popular language, saw its share fall to just 8.3% in 2025, pushing it down to fourth place, while .NET remained at the bottom of the top five, dropping to just 2.3%.
Most popular automated API client languages in 2025
Google remains the top search engine, with Yandex, Bing, and DuckDuckGo distant followers
Cloudflare is in a unique position to measure search engine market share because we protect websites and applications for millions of customers. To that end, since the fourth quarter of 2021, we have been publishing quarterly reports on this data. We use the HTTP referer header to identify the search engine sending traffic to customer sites and applications, and present the market share data as an overall aggregate, as well as broken out by device type and operating system. (Device type and operating system insights are based on the User-Agent and Client Hints HTTP request headers.)
Globally, Google referred the most traffic to sites protected and delivered by Cloudflare, with a nearly 90% share in 2025. The other search engines in the top 5 include Bing (3.1%), Yandex (2.0%), Baidu (1.4%), and DuckDuckGo (1.2%). Looking at trends across the year, Yandex dropped from a 2.5% share in May to a 1.5% share in July, while Baidu grew from 0.9% in April to 1.6% in June.
Overall search engine market share in 2025, worldwide
Yandex users are primarily based in Russia, where the domestic platform holds a 65% market share, almost double that of Google at 34%. In the Czech Republic, users prefer Google (84%), but local search engine Seznam’s 7.7% share is a strong showing compared to the second place search engines in other countries.
Overall search engine market share in 2025, Czech Republic
For traffic from “desktop” systems aggregated globally, Google’s market share drops to about 80%, while Bing’s jumps to nearly 11%. This is likely driven by the continued market dominance of Windows-based systems: On Windows, Google refers just 76% of traffic, while Bing refers about 14%. For traffic from mobile devices, Google holds almost 93% of market share, with the same share seen for traffic from both Android and iOS devices.
Overall search engine market share in 2025, Windows-based systems
For additional details, including search engines aggregated under “Other”, please refer to the quarterly Search Engine Referral Reports on Cloudflare Radar.
Chrome remains the top browser across platforms and operating systems – except on iOS, where Safari has the largest share
Cloudflare is also in a unique position to measure browser market share, and we have been publishing quarterly reports on the topic for several years. To identify the browser and associated operating system making content requests, we use information from the User-Agent and Client Hints HTTP headers. We present browser market share data as an overall aggregate, as well as broken out by device type and operating system. Note that the shares of browsers available on both desktop and mobile devices, such as Google Chrome or Apple Safari, are presented in aggregate.
Globally, two-thirds of request traffic to Cloudflare came from Chrome in 2025, similar to its share last year. Safari, available exclusively on Apple devices, was the second most-popular browser, with a 15.4% market share. They were followed by Microsoft Edge (7.4%), Mozilla Firefox (3.7%) and Samsung Internet (2.3%).
Overall browser market share in 2025, worldwide
In Russia, Chrome remains the most popular with a 44% share, but the domestic Yandex Browser comes in a strong second with a 33% market share, as compared to the sub-10% shares for Safari, Edge, and Opera. Interestingly, the Yandex Browser actually beat Chrome by a percentage point (39% to 38%) in June before giving up significant market share to Chrome as the year progressed.
Overall browser market share in 2025, Russia
As the default browser on iOS, Safari is far and away the most popular on such devices, with a 79% market share, four times Chrome’s 19% share. Less than 1% of requests come from DuckDuckGo, Firefox, and QQ Browser (developed in China by Tencent). In contrast, on Android, 85% of requests are from Chrome, while vendor-provided Samsung Internet is a distant second with a 6.6% share. Huawei Browser, another vendor-provided browser, is third at just 1%. And despite being the default browser on Windows, Edge’s 19% share pales in comparison to Chrome, which leads with a 69% share on that operating system.
Overall browser market share in 2025, iOS devices
For additional details, including browsers aggregated under “Other”, please refer to the quarterly Browser Market Share Reports on Cloudflare Radar.
Connectivity
Almost half of the 174 major Internet outages observed around the world in 2025 were due to government-directed regional and national shutdowns of Internet connectivity
Internet outages continue to be an ever-present threat, and the potential impact of these outages continues to grow, as they can lead to economic losses, disrupted educational and government services, and limited communications. During 2025, we covered significant Internet disruptions and their associated causes in our quarterly summary posts (Q1, Q2, Q3) as well standalone posts covering major outages in Portugal & Spain and Afghanistan. The Cloudflare Radar Outage Center tracks these Internet outages, and uses Cloudflare traffic data for insights into their scope and duration.
Nearly half of the observed outages this year were related to Internet shutdowns intended to prevent cheating on academic exams. Countries including Iraq, Syria, and Sudan again implemented regular multi-hour shutdowns over the course of several weeks during exam periods. Other government-directed shutdowns in Libya and Tanzania were implemented in response to protests and civil unrest, while in Afghanistan, the Taliban ordered the shutdown of fiber optic Internet connectivity in multiple provinces as part of a drive to “prevent immorality.”
Cable cuts, affecting both submarine and domestic fiber optic infrastructure, were also a leading cause of Internet disruptions in 2025. These cuts resulted in network providers in countries/regions including the United States, South Africa, Haiti, Pakistan, and Hong Kong experiencing service disruptions lasting from several hours to several days. Other notable outages include one caused by a fire in a telecom building in Cairo, Egypt, which disrupted Internet connectivity across multiple service providers for several days, and another in Jamaica, where damage caused by Hurricane Melissa resulted in lower Internet traffic from the island for over a week.
Within the timeline on the Year in Review microsite, hovering over a dot will display information about that outage, and clicking on it will link to additional insights.
Over 170 major Internet outages were observed around the world during 2025
Globally, less than a third of dual-stack requests were made over IPv6, while in India, over two-thirds were
Available IPv4 address space has been largely exhausted for a decade or more, though solutions like Network Address Translation have enabled network providers to stretch limited IPv4 resources. This has served in part to slow the adoption of IPv6, designed in the mid-1990s as a successor protocol to IPv4, and offers an expanded address space intended to better support the expected growth in the number of Internet-connected devices.
For nearly 15 years, Cloudflare has been a vocal and active advocate for IPv6 as well, launching solutions including Automatic IPv6 Gateway in 2011, which enabled free IPv6 support for all of our customers and IPv6 support by default for all of our customers in 2014. Simplistically, server-side support is only half of what is needed to drive IPv6 adoption, because end user connections need to support it as well. By aggregating and analyzing the IP version used for requests made to Cloudflare across the year, we can get insight into the distribution of traffic across IPv6 and IPv4.
Globally, 29% of IPv6-capable (“dual-stack”) requests for content were made over IPv6, up a percentage point from 28% in 2024. India again topped the list with an IPv6 adoption rate of 67%, followed by just three other countries/regions (Malaysia, Saudi Arabia, and Uruguay) that also made more than half of such requests over IPv6, the same as last year. Some of the largest gains were seen in Belize, which grew from 4.3% to 24% year-over-year, and Qatar, which saw its adoption nearly double to 33% in 2025. Unfortunately, some countries/regions still lag the leaders, with 94 seeing adoption rates below 10%, including Russia (8.6%), Ireland (6.5%), and Hong Kong (3.0%). Even further behind are the 20 countries/regions with adoption rates below 1%, including Tanzania (0.9%), Syria (0.3%), and Gibraltar (0.1%).
Distribution of traffic by IP version in 2025, worldwide
Top five countries for IPv6 adoption in 2025
European countries had some of the highest download speeds, all above 200 Mbps. Spain remained consistently among the top locations across measured Internet quality metrics
Over the past decade or so, we have turned to Internet speed tests for many purposes: keeping our service providers honest, troubleshooting a problematic connection, or showing off a particularly high download speed on social media. In fact, we’ve become conditioned to focus on download speeds as the primary measure of a connection’s quality. While it is absolutely an important metric, for increasingly popular use cases — like videoconferencing, live-streaming, and online gaming — strong upload speeds and low latency are also critical. However, even when Internet providers offer service tiers that include high symmetric speeds and lower latency, consumer adoption is often mixed due to cost, availability, or other issues.
Tests on speed.cloudflare.com measure both download and upload speeds, as well as loaded and unloaded latency. By aggregating the results of tests taken around the world during 2025, we can get a country/region perspective on average values for these connection quality metrics, as well as insight into the distribution of the measurements.
Europe was well-represented among those with the highest average download speeds in 2025. Spain, Hungary, Portugal, Denmark, Romania, and France were all in the top 10, with both Spain and Hungary averaging download speeds above 300 Mbps. Spain’s average grew by 25 Mbps from 2024, while Hungary’s jumped 46 Mbps. Meanwhile, Asian countries had many of the highest average upload speeds, with South Korea, Macau, Singapore, and Japan reaching the top 10, all seeing averages in excess of 130 Mbps.
But it was Spain that topped the list for the upload metric as well at 206 Mbps, up 13 Mbps from 2024. The country’s strong showing across both speed metrics is potentially attributable to “UNICO-Broadband,” a “call for projects by telecommunications operators aiming at the deployment of high-speed broadband infrastructure capable of providing services at symmetric speeds of at least 300 Mbps, scalable at 1 Gbps,” which aimed to cover 100 % of the population in 2025.
Countries/regions with the highest download speeds in 2025, worldwide
As noted above, low latency connections are needed to provide users with good gaming and videoconferencing/streaming experiences. The latency metric can be broken down into loaded and idle latency. The former measures latency on a loaded connection, where bandwidth is actively being consumed, while the latter measures latency on an “idle” connection, when there is no other network traffic present. (These definitions are from the speed test application’s perspective.)
In 2025, a number of European countries were among those with both the lowest idle and loaded latencies. For average idle latency, Iceland measured the lowest at 13 ms, just 2 ms better than Moldova. In addition to these two, Portugal, Spain, and Hungary also ranked among the top 10, all with average idle latencies below 20 ms. Moldova topped the list of countries/regions with the lowest average loaded latency, at 73 ms. Hungary, Spain, Belgium, Portugal, Slovakia, and Slovenia were also part of the top 10, all with average loaded latencies below 100 ms.
Measured idle/loaded latency, Moldova
London and Los Angeles were hotspots for Cloudflare speed test activity in 2025
As we discussed above, the speed test at speed.cloudflare.com measures a user’s connection speeds and latency. We reviewed the aggregate findings from those tests, highlighting the countries/regions with the best results. However, we also wondered about test activity around the world -– where are users most concerned about their connection quality, and how frequently do they perform tests? A new animated Year in Review visualization illustrates speed test activity, aggregated weekly.
Data is aggregated at a regional level and the associated activity is plotted on the map, with circles sized based on the number of tests taken each week. Note that locations with fewer than 100 speed tests per week are not plotted. Looking at test volume across the year, the greater London and Los Angeles areas were most active, as were Tokyo and Hong Kong and several U.S. cities.
Animating the graph to see changes across the year, a number of week-over-week surges in test volume are visible. These include in the Nairobi, Kenya, area during the seven-day period ending June 10; in the Tehran, Iran, area the period ending July 29; across multiple areas in Russia the period ending August 5; and in the Karnataka, India, area the period ending October 28. It isn’t clear what drove these increases in test volume — the Cloudflare Radar Outage Center does not show any observed Internet outages impacting those areas around those times, so it is unlikely to be subscribers testing the restoration of connectivity.
Cloudflare speed test activity by location in 2025
More than half of request traffic comes from mobile devices in 117 countries/regions
For better or worse, over the last quarter-century, mobile devices have become an indispensable part of everyday life. Adoption varies around the world — statistics from the World Bank show multiple countries/regions with mobile phone ownership above 90%, while in several others, ownership rates are below 10%, as of October 2025. In some countries/regions, mobile devices primarily connect to the Internet via Wi-Fi, while other countries/regions are “mobile first,” where 4G/5G services are the primary means of Internet access.
Information contained within the User-Agent header included with each request to Cloudflare enables us to categorize it as coming from a mobile, desktop, or other type of device. Aggregating this categorization globally across 2025 found that 43% of requests were from mobile devices, up from 41% in 2024. The balance came from “classic” laptop and desktop type devices. Similar to an observation made last year, these traffic shares were in line with those measured in Year in Review reports dating back to 2022, suggesting that mobile device usage has achieved a “steady state.”
In 117 countries/regions, more than half of requests came from mobile devices, led by Sudan and Malawi at 75% and 74% respectively. Five other African countries/regions — Eswatini (Swaziland), Yemen, Botswana, Mozambique, and Somalia — also had mobile request shares above 70% in 2025, in line with strong mobile phone ownership in the region. Among countries/regions with low mobile device traffic share, Gibraltar was the only one below 10% (at 5.1%), with just six others originating less than a quarter of requests from mobile devices. This is fewer than in 2024, when a dozen countries/regions had a mobile share below 25%.
Distribution of traffic by device type in 2025, worldwide
Global distribution of traffic by device type in 2025
Security
6% of global traffic over Cloudflare’s network was mitigated by our systems — either as potentially malicious or for customer-defined reasons
Cloudflare automatically mitigates attack traffic targeting customer websites and applications using DDoS mitigation techniques or Web Application Firewall (WAF) Managed Rules, protecting them from a variety of threats posed by malicious actors. We also enable customers to mitigate traffic, even if it isn’t malicious, using techniques like rate-limiting requests or blocking all traffic from a given location. The need to do so may be driven by regulatory or business requirements. We looked at the overall share of traffic to Cloudflare’s network throughout 2025 that was mitigated for any reason, as well as the share that was blocked as a DDoS attack or by WAF Managed Rules.
This year, 6.2% of global traffic was mitigated, down a quarter of a percentage point from 2024. 3.3% of traffic was mitigated as a DDoS attack, or by managed rules, up one-tenth of a percentage point year over year. General mitigations were applied to more than 10% of the traffic coming from over 30 countries/regions, while 14 countries/regions had DDoS/WAF mitigations applied to more than 10% of originated traffic. Both counts were down in comparison to 2024.
Equatorial Guinea had the largest shares of mitigated traffic with 40% generally mitigated and 29% with DDoS/WAF mitigations applied. These shares grew over the last year, from 26% (general) and 19% (DDoS/WAF). In contrast, Dominica had the smallest shares of mitigated traffic, with just 0.7% of traffic mitigated, with DDoS/WAF mitigations applied to just 0.1%.
The large increase in mitigated traffic seen during July in the graph below is due to a very large DDoS attack campaign that primarily targeted a single Cloudflare customer domain.
Mitigated traffic trends in 2025, worldwide
40% of global bot traffic came from the United States, with Amazon Web Services and Google Cloud originating a quarter of global bot traffic
A bot is a software application programmed to do certain tasks, and Cloudflare uses advanced heuristics to differentiate between bot traffic and human traffic, scoring each request on the likelihood that it originates from a bot or a human user. By monitoring traffic suspected to be from bots, site and application owners can spot and, if necessary, block potentially malicious activity. However, not all bots are malicious — bots can also be helpful, and Cloudflare maintains a directory of verified bots that includes those used for things like search engine indexing, security scanning, and site/application monitoring. Regardless of intent, we analyzed where bot traffic was originating from in 2025, using the IP address of a request to identify the network (autonomous system) and country/region associated with the bot making the request.
Globally, the top 10 countries/regions accounted for 71% of observed bot traffic. Forty percent originated from the United States, far ahead of Germany’s 6.5% share. The US share was up over five percentage points from 2024, while Germany’s share was down a fraction of a percentage point. The remaining countries in the top 10 all contributed bot traffic shares below 5% in 2025.
Global bot traffic distribution by source country/region in 2025
Looking at bot traffic by network, we found that cloud platforms remained among the leading sources. This is due to a number of factors, including the ease of using automated tools to quickly provision compute resources, their relatively low cost, their broadly distributed geographic footprints, and the platforms’ high-bandwidth Internet connectivity.
Two autonomous systems associated with Amazon Web Services accounted for a total of 14.4% of observed bot traffic, and two associated with Google Cloud were responsible for a combined 9.7% of bot traffic. They were followed by Microsoft Azure, which originated 5.5% of bot traffic. The shares from all three platforms were up as compared to 2024. These cloud platforms have a strong regional data center presence in many of the countries/regions in the top 10. Elsewhere, around the world, local telecommunications providers frequently accounted for the largest shares of automated bot traffic observed in those countries/regions.
Global bot traffic distribution by source network in 2025
Organizations in the "People and Society” vertical were the most targeted during 2025
Attackers are constantly shifting their tactics and targets, mixing things up in an attempt to evade detection, or based on the damage they intend to cause. They may try to cause financial harm to businesses by targeting ecommerce sites during a busy shopping period, make a political statement by attacking government-related or civil society sites, or attempt to knock opponents offline by attacking a game server. To identify vertical-targeted attack activity during 2025, we analyzed mitigated traffic for customers that had an associated industry and vertical within their customer record. Mitigated traffic was aggregated weekly by source country/region across 17 target verticals.
Organizations in the "People and Society” vertical were the most targeted across the year, with 4.4% of global mitigated traffic targeting the vertical. Customers classified as “People and Society” include religious institutions, nonprofit organizations, civic & social organizations, and libraries. The vertical started out the year with under 2% of mitigated traffic, but saw the share jump to 10% the week of March 5, and increase to over 17% by the end of the month. Other attack surges targeting these sites occurred in late April (to 19.1%) and early July (to 23.2%). Many of these types of organizations are protected by Cloudflare’s Project Galileo, and this blog post details the attacks and threats they experienced in 2024 and 2025.
Gambling/Games, the most-targeted vertical last year, saw its share of mitigated attacks drop by more than half year-over-year, to just 2.6%. While one might expect to see attacks targeting gambling sites peak around major sporting events like the Super Bowl and March Madness, such a trend was not evident, as attack share peaked at 6.5% the week of March 5 — a month after the Super Bowl, and a couple of weeks before the start of March Madness.
Global mitigated traffic share by vertical in 2025, summary view
Routing security, measured as the shares of RPKI valid routes and covered IP address space, saw continued improvement throughout 2025
Border Gateway Protocol (BGP) is the Internet’s core routing protocol, enabling traffic to flow between source and destination by communicating routes between networks. However, because it relies on trust between connected networks, incorrect information shared between peers (intentionally or not) can send traffic to the wrong place — potentially to systems under control of an attacker. To address this, Resource Public Key Infrastructure (RPKI) was developed as a cryptographic method of signing records that associate a BGP route announcement with the correct originating autonomous system (AS) number to ensure that the information being shared originally came from a network that is allowed to do so. Cloudflare has been a vocal advocate for routing security, including as a founding participant in the MANRS CDN and Cloud Programme and by providing a public tool that enables users to test whether their Internet provider has implemented BGP safely.
We analyzed data available on Cloudflare Radar’s Routing page to determine the share of RPKI valid routes and how that share changed throughout 2025, as well as determining the share of IP address space covered by valid routes. The latter metric is noteworthy because a route announcement covering a large amount of IP address space (millions of IPv4 addresses) has a greater potential impact than an announcement covering a small block of IP address space (hundreds of IPv4 addresses).
We started 2025 with 50% valid IPv4 routes, growing to 53.9% by December 2. The share of valid IPv6 routes increased to 60.1%, up 4.7 percentage points. Looking at the global share of IP address space covered by valid routes, IPv4 increased to 48.5%, a three percentage point increase. The share of IPv6 address space covered by valid routes fell slightly to 61.6%. Although the year-over-year changes for these metrics are slowing, we have made significant progress over the last five years. Since the start of 2020, the share of RPKI valid IPv4 routes and IPv4 address space have both grown by approximately 3x.
Shares of global RPKI valid routing entries by IP version in 2025
Shares of globally announced IP address space covered by RPKI valid routes in 2025
Barbados saw the biggest growth in the share of valid IPv4 routes, growing from 2.2% to 20.8%. Looking at valid IPv6 routes, Mali saw the most significant share growth in 2025, from 10.0% to 58.3%.
Barbados also experienced the biggest increase in the share of IPv4 space covered by valid routes, jumping from just 2.0% to 18.6%. For IPv6 address space, both Tajikistan and Dominica went from having effectively no space covered by valid routes at the start of the year, to 5.5% and 3.5% respectively.
Hyper-volumetric DDoS attack sizes grew significantly throughout the year
In our quarterly DDoS Report series (Q1, Q2, Q3), we have highlighted the increasing frequency and size of hyper-volumetric network layer attacks targeting Cloudflare customers and Cloudflare’s infrastructure. We define a “hyper-volumetric network layer attack” as one that operates at Layer 3/4 and that peaks at more than one terabit per second (1 Tbps) or more than one billion packets per second (1 Bpps). These reports provide a quarterly perspective, but we also wanted to show a view of activity across the year to understand when attackers are most active, and how attack sizes have grown over time.
Looking at hyper-volumetric attack activity in 2025 from a Tbps perspective, July saw the largest number of such attacks, at over 500, while February saw the fewest, at just over 150. Attack intensity remained generally below 5 Tbps, although a 10 Tbps attack blocked at the end of August was a harbinger of things to come. This attack was the first of a campaign of >10 Tbps attacks that took place during the first week of September, ahead of a series of >20 Tbps attacks during the last week of the month. In early October, multiple increasingly larger hyper-volumetric attacks were observed, with the largest for the month peaking at 29.7 Tbps. However, that record was soon eclipsed, as an early November attack reached 31.4 Tbps.
From a Bpps perspective, hyper-volumetric attack activity was much lower, with November experiencing the most (over 140), while just three were seen in February and June. Attack intensity across the year generally remained below 4 Bpps through late August, though a succession of increasingly larger attacks were seen over the next several months, peaking in October. Although the intensity of most of the 110+ attacks blocked in October was below 5 Bpps, a 14 Bpps attack seen during the month was the largest hyper-volumetric attack by packets per second blocked during the year, besting five other successive record-setting attacks that occurred in September.
Peak DDoS attack sizes in 2025
Email security
More than 5% of email messages analyzed by Cloudflare were found to be malicious
Recent statistics suggest that email remains the top communication channel for external business contact, despite the growing enterprise use of collaboration/messaging apps. Given its broad enterprise usage, attackers still find it to be an attractive entry point into corporate networks. Generative AI tools make it easier to craft highly targeted malicious emails that convincingly impersonate trusted brands or legitimate senders (like corporate executives) but contain deceptive links, dangerous attachments, or other types of threats. Cloudflare Email Security protects customers from email-based attacks, including those carried out through targeted malicious email messages.
In 2025, an average of 5.6% of emails analyzed by Cloudflare were found to be malicious. The share of messages processed by Cloudflare Email Security that were found to be malicious generally ranged between 4% and 6% throughout most of the year. Our data shows a jump in malicious email share starting in October, likely due to an improved classification system implemented by Cloudflare Email Security.
Global malicious email share trends in 2025
Deceptive links, identity deception, and brand impersonation were the most common types of threats found in malicious email messages
Deceptive links were the top malicious email threat category in 2025, found in 52% of messages, up from 43% in 2024. Since the display text for a hyperlink in HTML can be arbitrarily set, attackers can make a URL appear as if it links to a benign site when, in fact, it is actually linking to a malicious resource that can be used to steal login credentials or download malware. The share of processed emails containing deceptive links was as high as 70% in late April, and again in mid-November.
Identity deception occurs when an attacker sends an email claiming to be someone else. They may do this using domains that look similar, are spoofed, or use display name tricks to appear to be coming from a trusted domain. Brand impersonation is a form of identity deception where an attacker sends a phishing message that impersonates a recognizable company or brand. Brand impersonation may also use display name spoofing or domain impersonation. Identity deception (38%) and brand impersonation (32%) were growing threats in 2025, up from 35% and 23% respectively in 2024. Both saw an increase in mid-November.
Email threat category trends in 2025, worldwide
Nearly all of the email messages from the .christmas and .lol Top Level Domains were found to be either spam or malicious
In addition to providing traffic, geographic distribution, and digital certificate insights for Top Level Domains (TLDs) like .com or .us, Cloudflare Radar also provides insights into the “most abused” TLDs – those with domains that we have found are originating the largest shares of malicious and spam email among messages analyzed by Cloudflare Email Security. The analysis is based on the sending domain’s TLD, found in the From: header of an email message. For example, if a message came from sender@example.com, then example.com is the sending domain, and .com is the associated TLD. For the Year in Review analysis, we only included TLDs from which we saw an average minimum of 30 messages per hour.
Based on messages analyzed throughout 2025, we found that .christmas and .lol were the most abused TLDs, with 99.8% and 99.6% of messages from these TLDs respectively characterized as either spam or malicious. Sorting the list of TLDs by malicious email share, .cfd and .sbs both had more than 90% of analyzed emails categorized as malicious. The .best TLD was the worst in terms of spam email share, with 69% of email messages characterized as spam.
TLDs originating the largest total shares of malicious and spam email in 2025
Conclusion
Although the Internet and the Web continue to evolve and change over time, it appears that some of the key metrics have become fairly stable. However, we expect that others, such as those metrics tracking AI trends, will shift over the coming years as that space evolves at a rapid pace.
We encourage you to visit the Cloudflare Radar 2025 Year In Review microsite and explore the trends for your country/region, and consider how they impact your organization as you plan for 2026. You can also get near real-time insight into many of these metrics and trends on Cloudflare Radar. And as noted above, for insights into the top Internet services across multiple industry categories and countries/regions, we encourage you to read the companion Year in Review blog post.
As the saying goes, it takes a village to make our annual Year in Review happen, from aggregating and analyzing the data, to creating the microsite, to developing associated content. I’d like to acknowledge those team members that contributed to this year’s effort, with thanks going out to: Jorge Pacheco, Sabina Zejnilovic, Carlos Azevedo, Mingwei Zhang, Sofia Cardita (data analysis); André Páscoa, Nuno Pereira (frontend development); João Tomé (Most Popular Internet Services); David Fidalgo, Janet Villarreal, and the internationalization team (translations); Jackie Dutton, Kari Linder, Guille Lasarte (Communications); Laurel Wamsley (blog editing); and Paula Tavares (Engineering Management), as well as other colleagues across Cloudflare for their support and assistance.

 Entrar